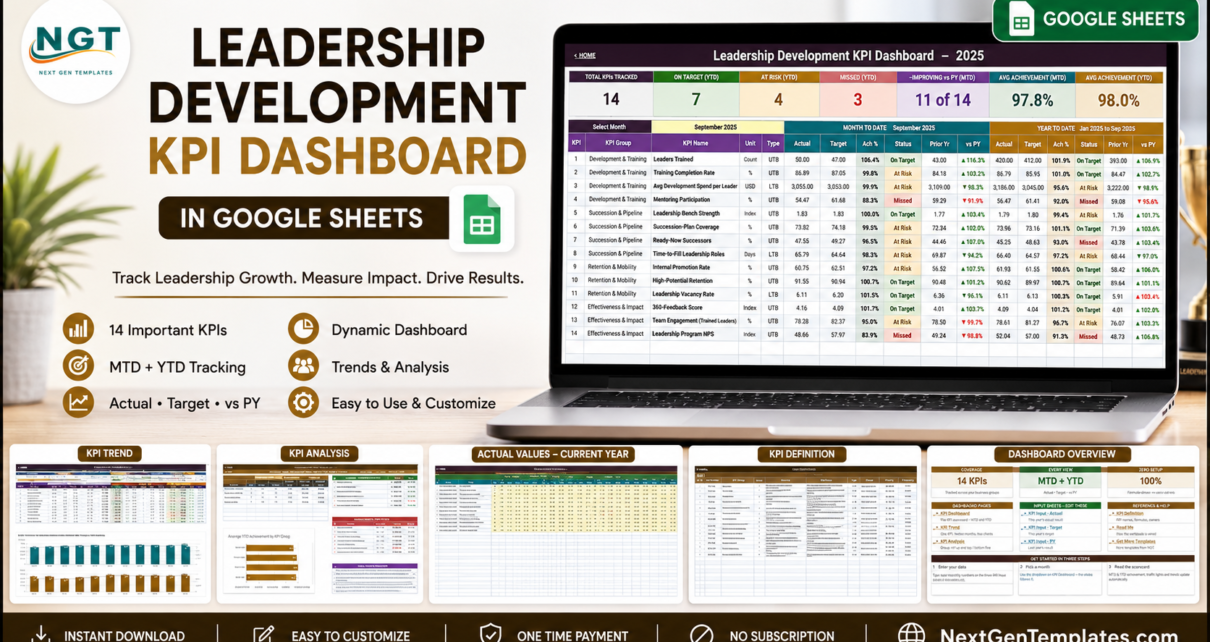
The Leadership Development KPI Dashboard in Google Sheets tracks 14 leadership KPIs across 4 KPI groups and 10 tabs, and every figure on every page follows a single month picker. Three charts, seven summary cards and a full MTD-plus-YTD scorecard recalculate the moment you change the selected month — there is no refresh step, no add-on and no query to run. Setup takes under 10 minutes.
Most L&D teams already have the numbers. What they do not have is one page that shows whether leadership development is actually working this month, and whether it is on track for the year. Spend sits in one spreadsheet, succession notes in another, and 360 results in a PDF from a vendor. This template gives those numbers a single home and a traffic light each, so the monthly leadership review takes minutes rather than an afternoon of copy-paste.
Get the Leadership Development KPI Dashboard in Google Sheets
One thing to be clear about up front: this is the KPI scorecard edition. It has a month picker, traffic lights, a KPI Trend page and a KPI Analysis page. It is not the analytical, multi-chart Leadership Development dashboard — that is a separate template, and plenty of teams keep both.
Key Features of the Leadership Development KPI Dashboard
- 14 leadership KPIs in four groups. Development & Training, Succession & Pipeline, Retention & Mobility and Effectiveness & Impact. Between them they cover Leaders Trained, Training Completion Rate, Avg Development Spend per Leader, Mentoring Participation, Leadership Bench Strength, Succession-Plan Coverage, Ready-Now Successors, Time-to-Fill Leadership Roles, Internal Promotion Rate, High-Potential Retention, Leadership Vacancy Rate, 360-Feedback Score, Team Engagement (Trained Leaders) and Leadership Program NPS.
- One month picker for the whole workbook. Choose the reporting month on the KPI Dashboard sheet and the seven header cards, the 14-row scorecard and the entire KPI Analysis page re-base to it.
- MTD and YTD side by side. Every KPI carries Actual, Target, Achievement %, Status, Prior Year and vs PY for month-to-date, then the same six columns again for year-to-date.
- Traffic lights with editable thresholds. On Target from 100%, At Risk 95% to 99%, Missed below 95% — change the numbers in the Status formulas and the scorecard re-colours.
- Upper-the-better and Lower-the-better logic. Achievement is Actual ÷ Target for UTB KPIs and Target ÷ Actual for LTB KPIs, so coming in under budget on Avg Development Spend per Leader, or under target on Time-to-Fill Leadership Roles, correctly scores above 100%.
- The KPI list is data, not formulas. Add, rename or delete a KPI on the KPI Definition sheet and the scorecard, trend picker and analysis roll-up all follow automatically.
- Pure Google Sheets. Built entirely from native Google Sheets functions — no Apps Script, no add-ons, nothing to install.
Sheets Explanation
Dashboard Overview (Home)
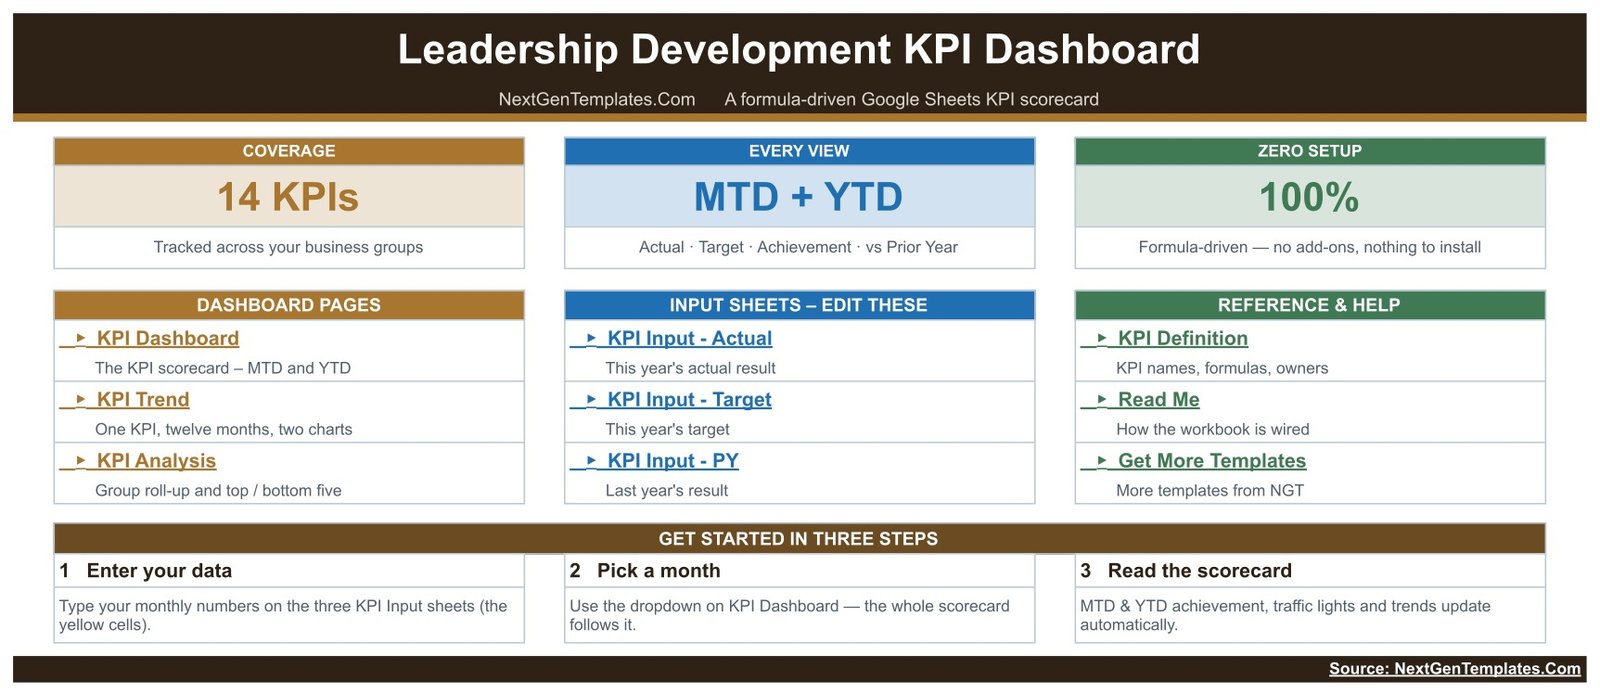
The landing tab states the build in three cards — 14 KPIs tracked, MTD + YTD in every view, 100% formula-driven — then gives one-click links to the three dashboard pages, the three input sheets and the reference sheets. A Get Started in Three Steps strip tells a first-time user where to type, where to pick a month and where to read the answer.
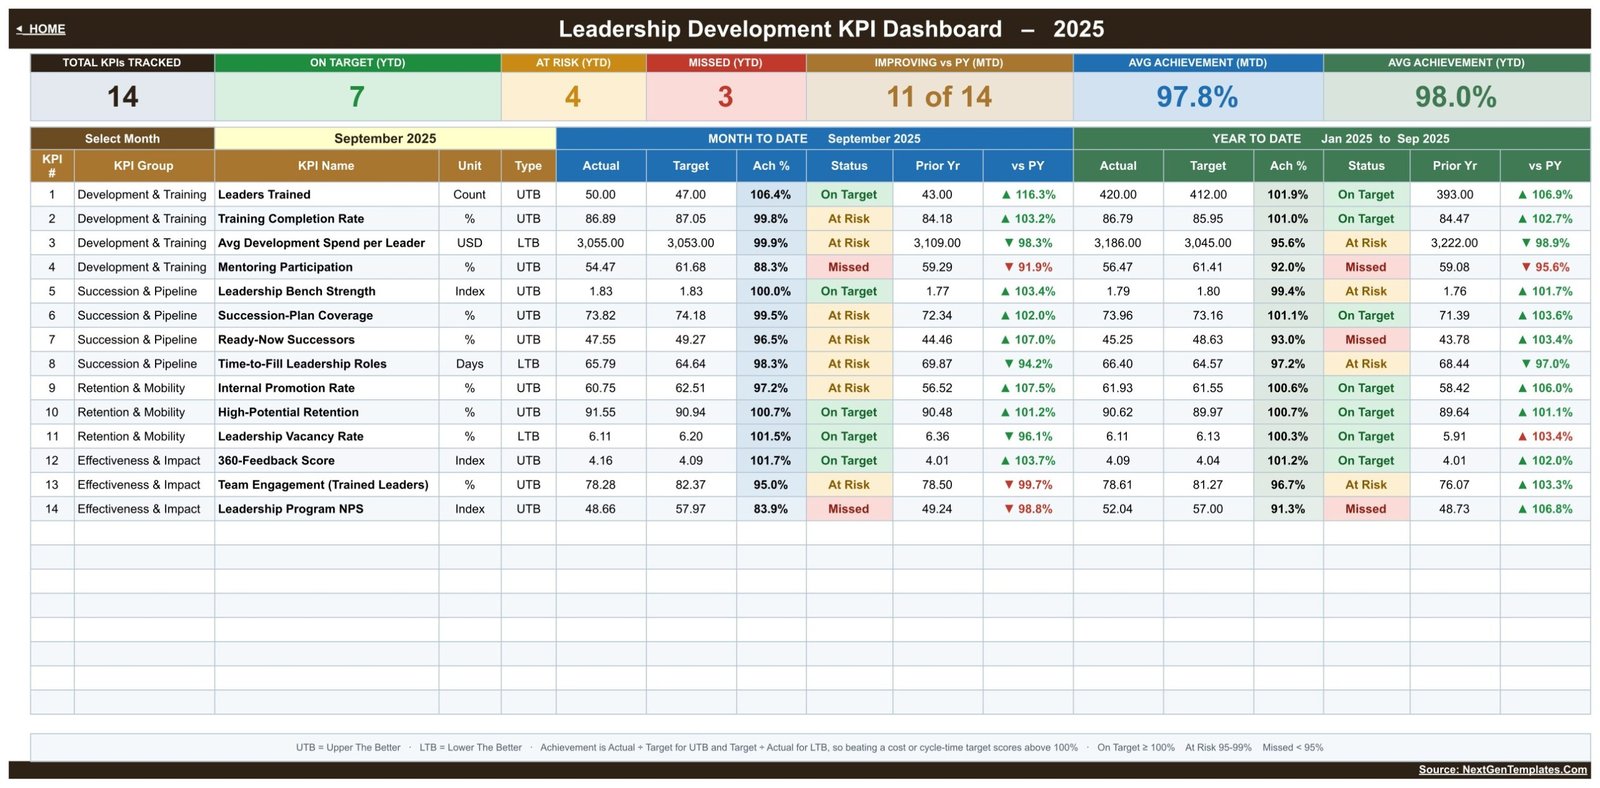
KPI Dashboard — the scorecard
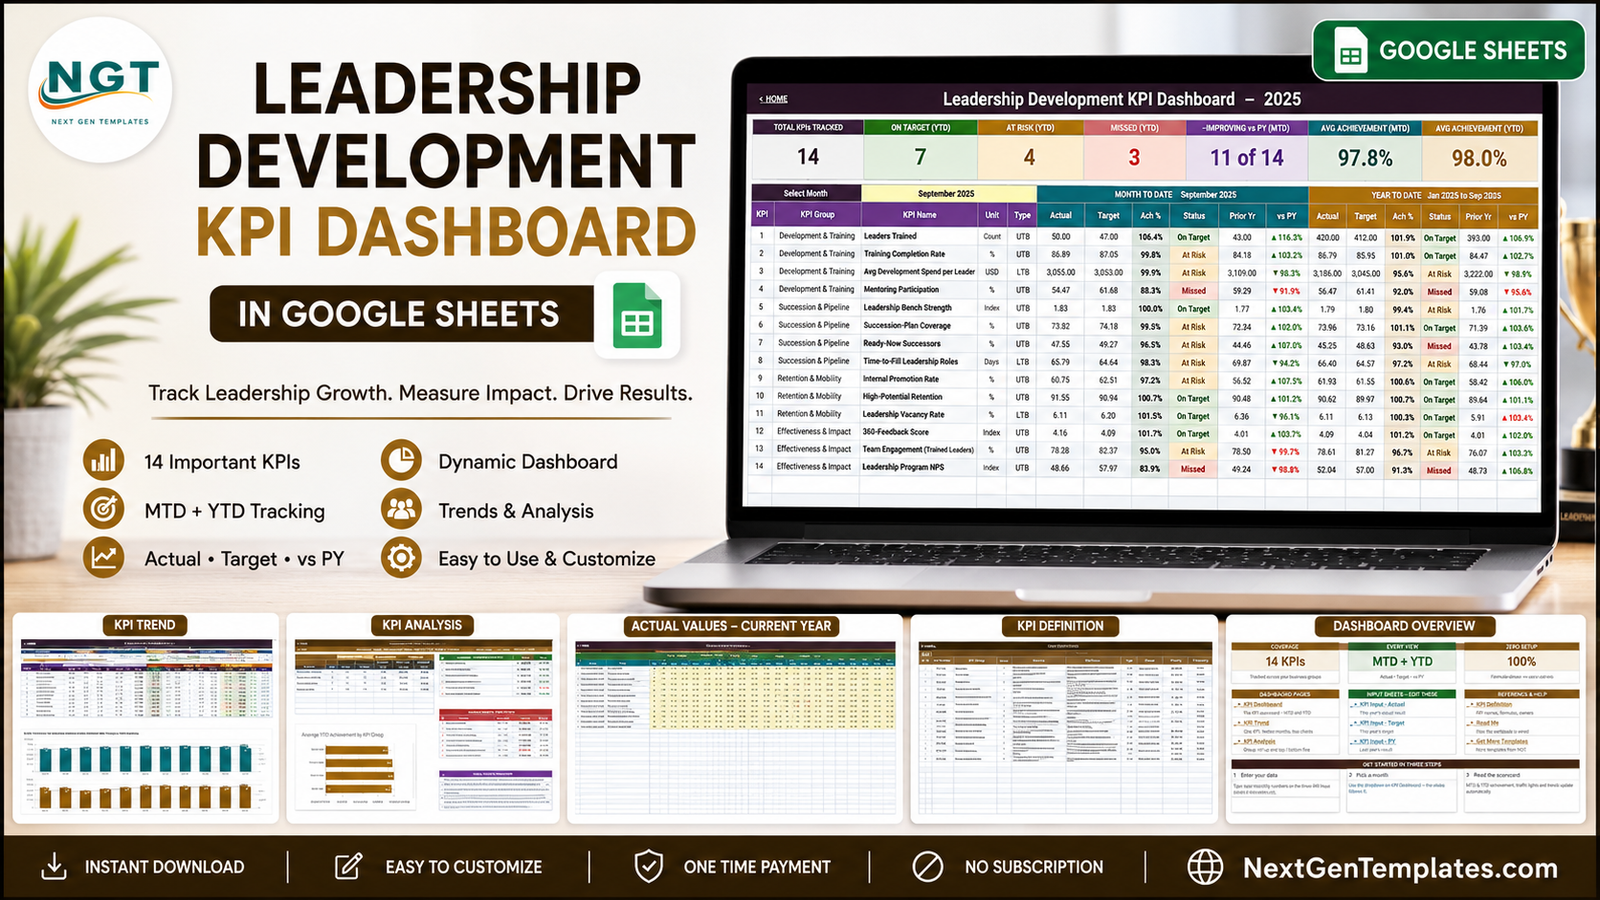
Seven header cards report Total KPIs Tracked, On Target (YTD), At Risk (YTD), Missed (YTD), Improving vs PY (MTD), Avg Achievement (MTD) and Avg Achievement (YTD). Below the month picker, the 14-row table repeats Actual, Target, Achievement %, Status, Prior Yr and vs PY for month-to-date and again for year-to-date, so a KPI that looks fine this month but is behind for the year stands out immediately.
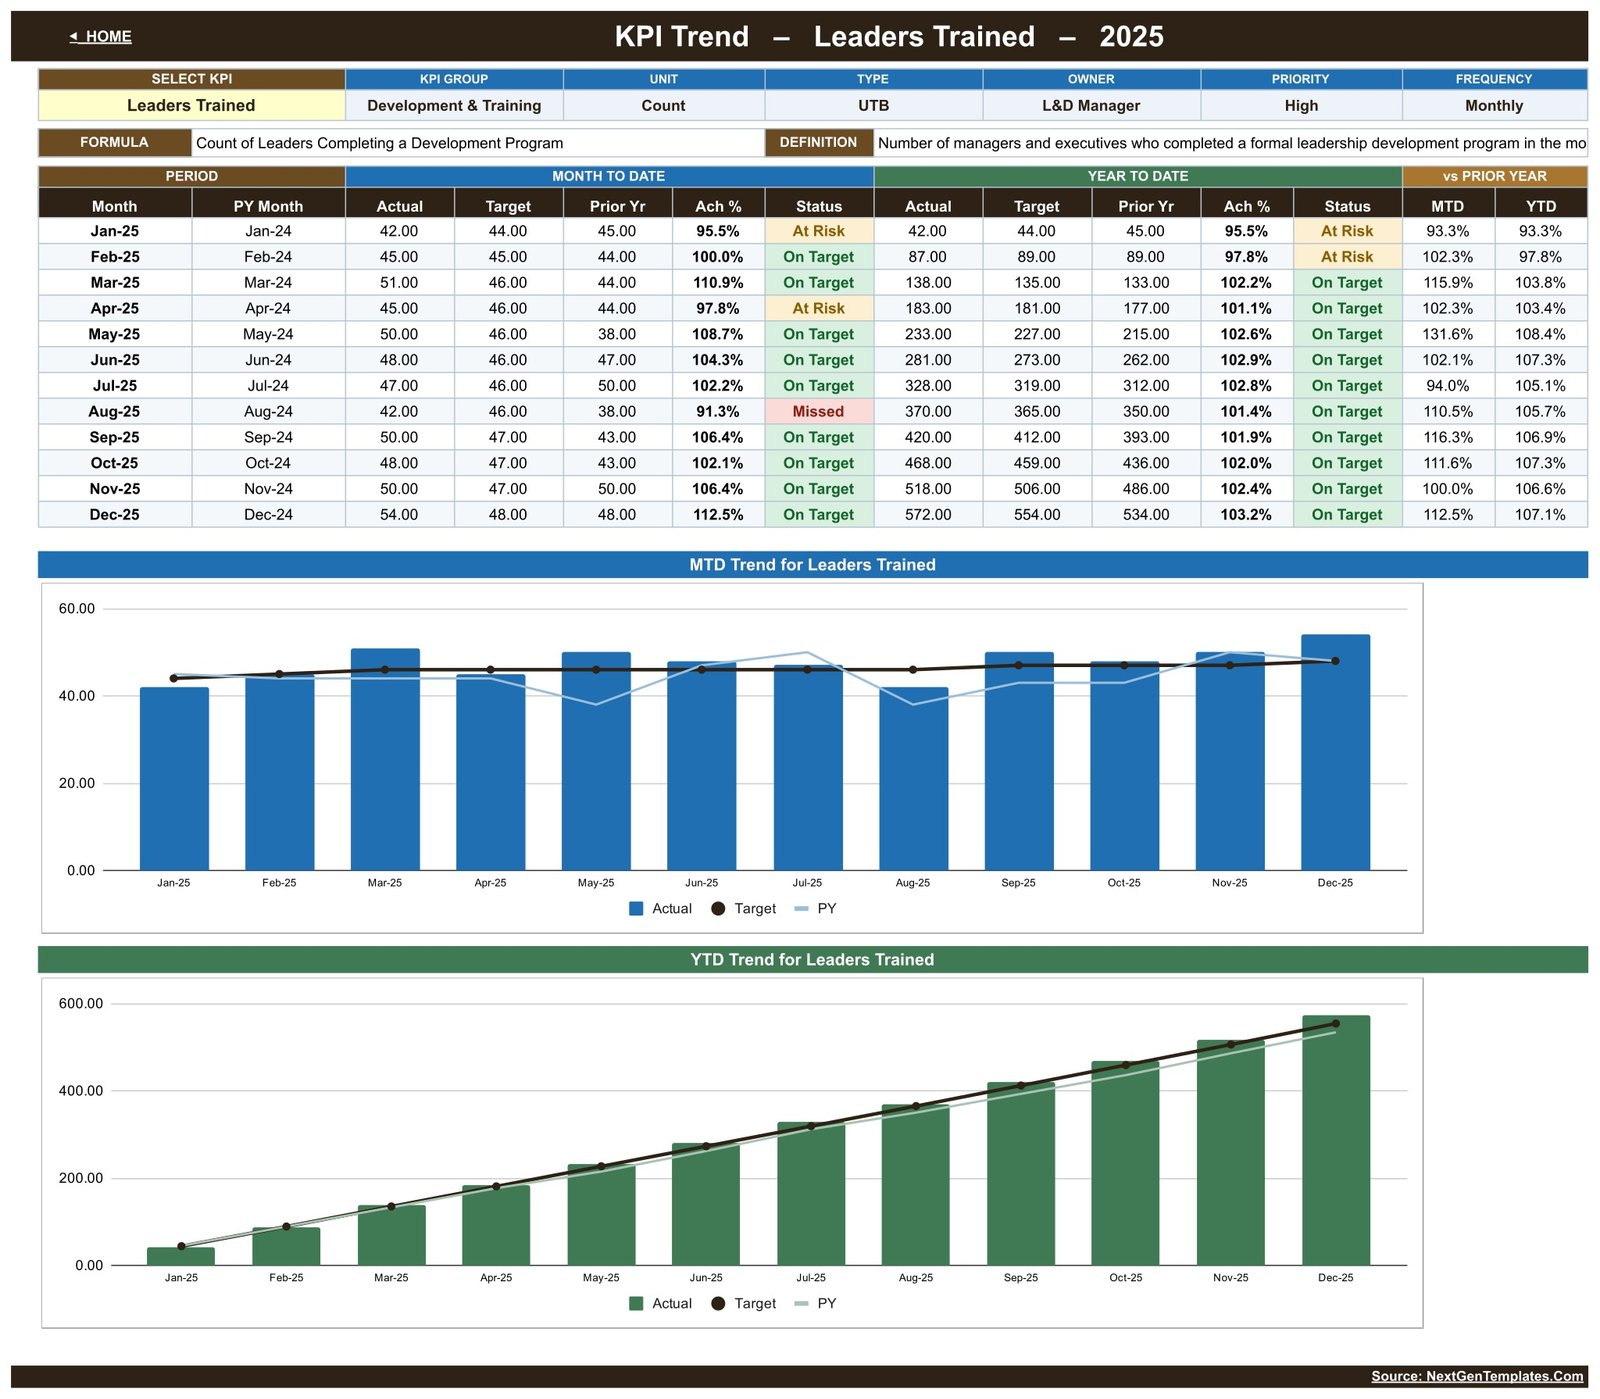
KPI Trend — one KPI, twelve months
Pick a KPI from the dropdown and the page shows its group, unit, type, owner, priority, frequency, formula and definition, then twelve months of MTD and YTD actual, target, prior year, achievement and status. Two charts follow the selection: Actual, Target and Prior Year by Month for MTD, and the cumulative version of the same three series for YTD.
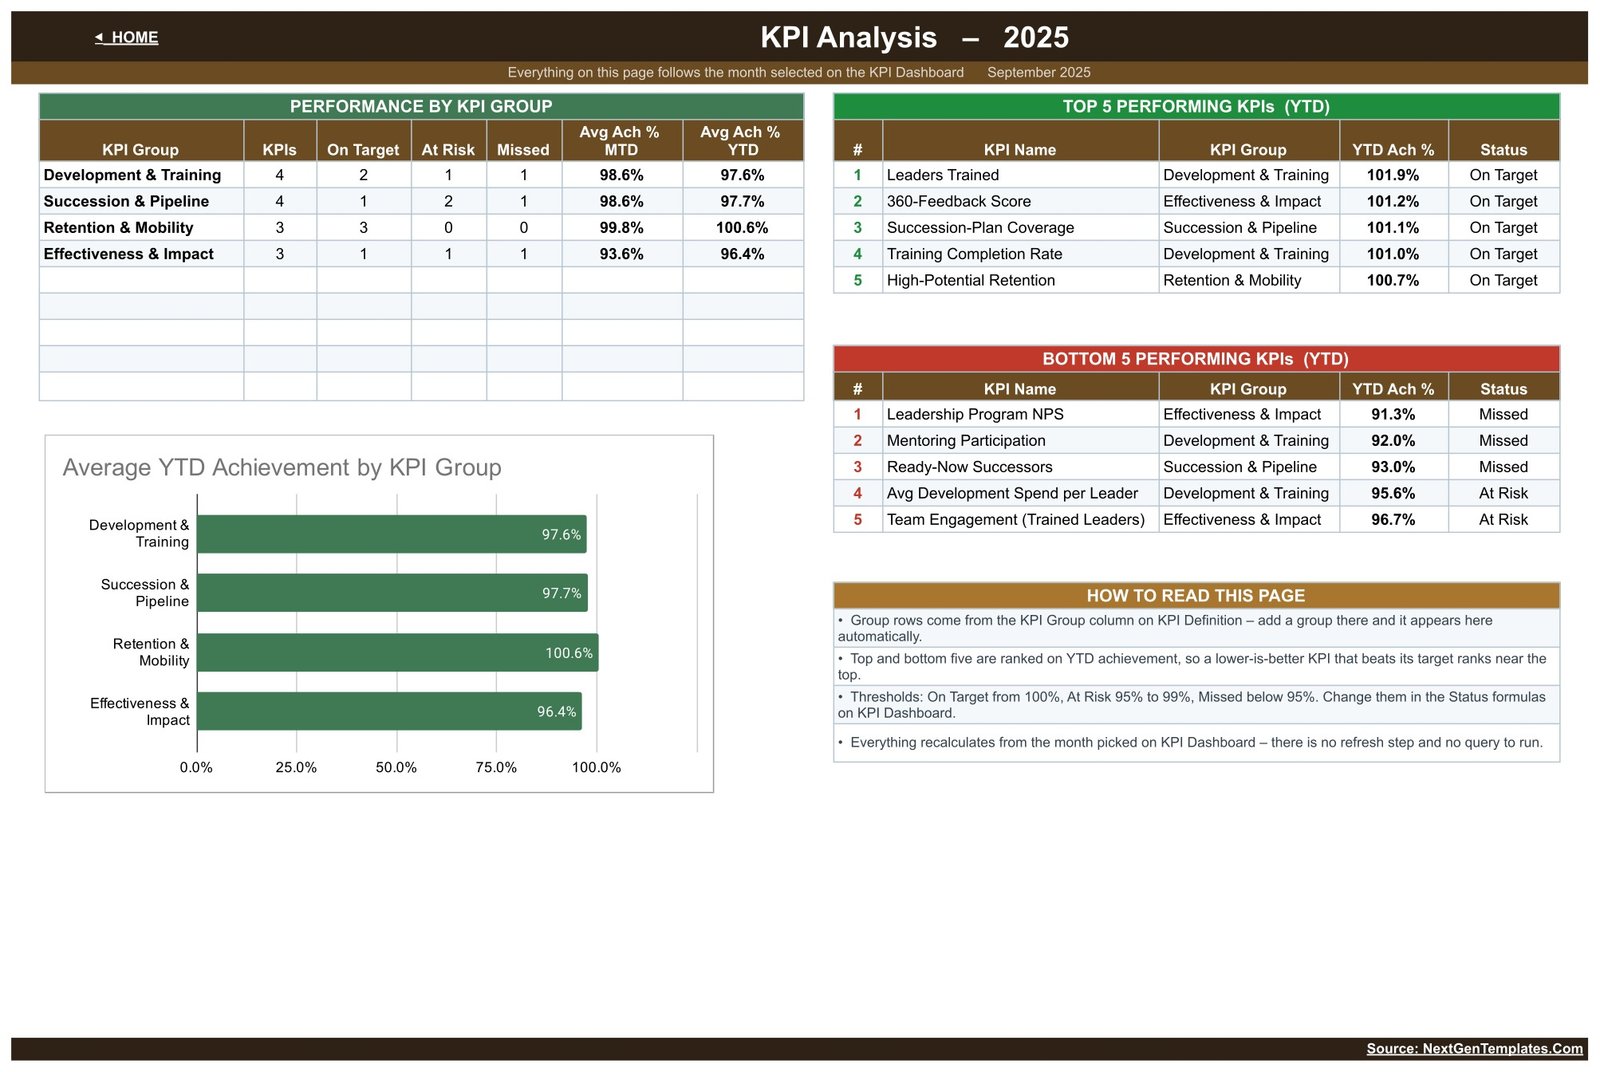
KPI Analysis — groups, top five, bottom five
A Performance by KPI Group table counts On Target, At Risk and Missed KPIs per group and averages their MTD and YTD achievement. Beside it sit Top 5 and Bottom 5 Performing KPIs ranked on YTD achievement, and below is the chart Average YTD Achievement by KPI Group. A How to Read This Page panel spells out the thresholds and where to change them.
KPI Input – Actual Values (Current Year)
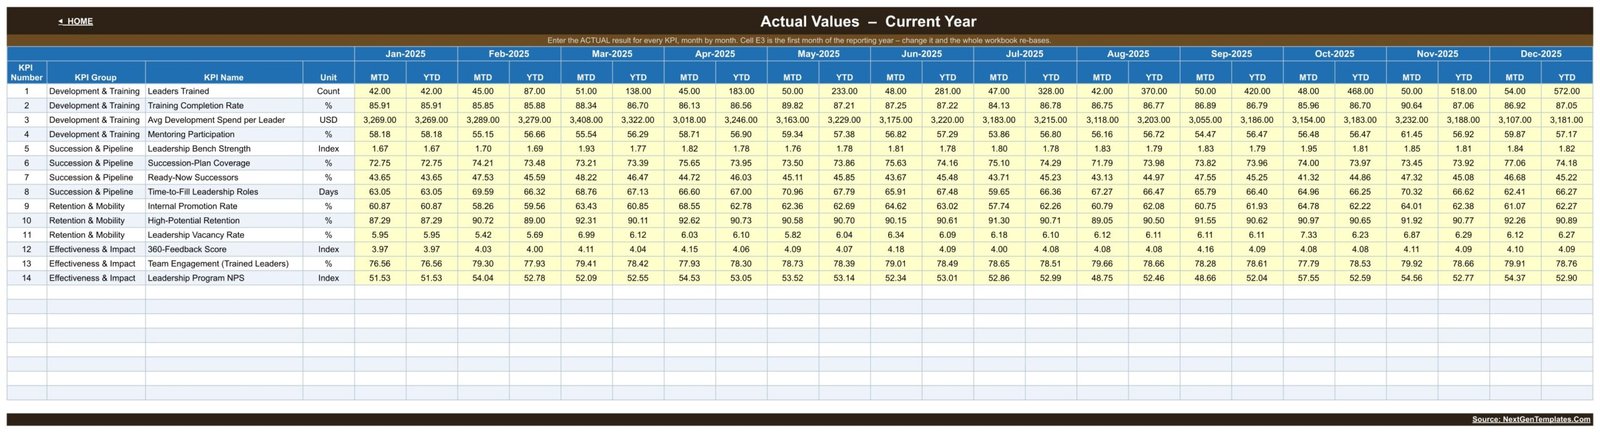
This is where you type. Twelve month columns, each with an MTD and a YTD cell, run across the 14 KPI rows in yellow input cells. Cell E3 sets the first month of the reporting year, so changing it re-bases the entire workbook. Two more sheets in the identical layout hold Target and Prior Year.
KPI Definition — the master list
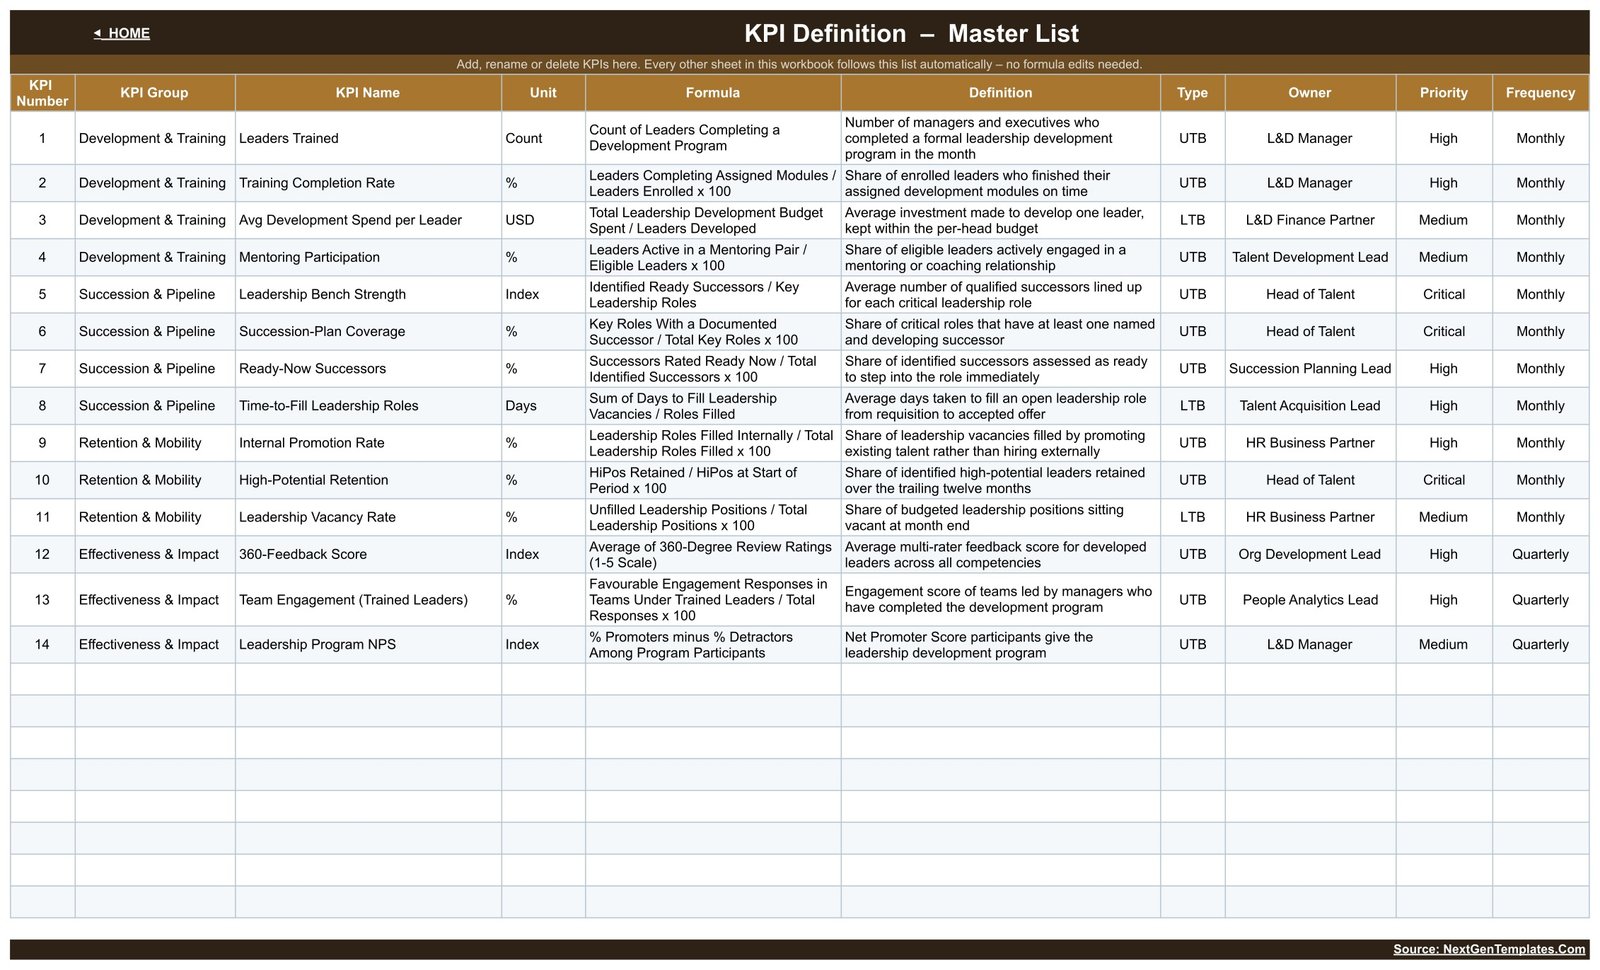
Each KPI is defined once: number, group, name, unit, formula, plain-English definition, type (UTB or LTB), owner, priority and frequency. Edit this sheet to rename a KPI, reassign an owner or swap in your own metric, and every other sheet follows without a single formula edit.
Leadership Development KPI Dashboard vs. a Microsoft Excel Dashboard vs. Paid HR SaaS — Feature Comparison
| Feature | Leadership Development KPI Dashboard in Google Sheets | Microsoft Excel dashboard | BambooHR / Workday / Cornerstone |
|---|---|---|---|
| Cost | $8.99 one-time | $10-30 one-time, plus an Office licence | $6-15 per employee per month |
| Platform | Google Sheets, browser and mobile app | Desktop Excel, best on Windows | Vendor cloud only |
| Setup time | Under 10 minutes — type into three input sheets | Under 30 minutes, refresh pivots after each change | Weeks — HRIS import, field mapping, vendor onboarding |
| Real-time team collaboration | ✅ Native, several editors at once | Only via OneDrive co-authoring | ✅ Yes |
| Mobile access | ✅ Google Sheets mobile app | Limited | ✅ Yes |
| Add or rename your own KPIs | ✅ Edit one master list, no formula changes | ✅ But usually needs formula and pivot edits | Restricted to the vendor’s metric catalogue |
| Share with a link | ✅ Standard Google Drive sharing | File attachment or OneDrive link | Per-seat login required |
| Own your data | ✅ Your Drive, your file, export any time | ✅ Your file | Export limited by plan |
| Year-1 cost at 5 users | $8.99 total | $10-30 plus licences | $360-900 |
For an L&D or HR team that wants a shared monthly leadership scorecard without a per-seat HR platform, the Leadership Development KPI Dashboard sits in the sweet spot.
Who Should Use This Template
Perfect for:
- L&D and talent managers at 50-2,000 person companies reporting leadership metrics monthly.
- HR business partners who already keep leadership numbers in a spreadsheet and want a presentable scorecard over them.
- Heads of Talent who need bench strength, succession coverage and ready-now successors on one page.
- HR consultants who deliver a monthly or quarterly leadership pack to clients.
- Anyone running a leadership programme who wants MTD and YTD achievement without writing the formulas.
Not a fit if:
- You need figures pulled automatically from an HRIS or LMS — every number here is typed in by you.
- You are looking for a compliance, employment-law or audit tool. This is a tracking and visualisation template, not a compliance system, and it gives no HR advice.
- You expect a validated assessment instrument. The 360-Feedback Score, Ready-Now Successors and bench-strength figures are simply the values you enter; nothing here scores, assesses or validates a person.
- Your organisation requires SSO, SOC 2 or role-level permissions inside the report itself.
- You want per-employee records — this is a monthly KPI scorecard, not a personnel database.
Real-World Use Cases
Priya runs L&D at a 400-person software company. Each month she types the number of leaders who completed a programme, the completion rate and the spend per leader into the input sheet, picks the month on the KPI Dashboard, and drops the scorecard straight into her leadership deck. Her previous routine — three spreadsheets and a manual chart rebuild — took most of a morning.
Daniel is Head of Talent at a manufacturing group. He watches three numbers: Leadership Bench Strength, Succession-Plan Coverage and Ready-Now Successors. The Succession & Pipeline block on the KPI Analysis page gives him all three with MTD and YTD achievement, and the KPI Trend page tells him whether Time-to-Fill Leadership Roles is genuinely improving or just had one good month.
Meera is an independent HR consultant. She keeps one copy of the template per client, renames the KPI Definition rows to match each client’s own leadership framework, and shares a view-only Google Sheets link each quarter. Her clients read the traffic lights without needing a login or a licence.
Advantages of the Leadership Development KPI Dashboard
The obvious advantage is cost: $8.99 once against $360-900 a year for five seats on an HR platform. But the practical advantage is speed of change. Because the KPI list lives on one sheet as data rather than being hard-coded into formulas, swapping a KPI takes seconds. If your organisation measures “coaching hours per leader” instead of “mentoring participation”, you type the new name, unit, formula and owner on the KPI Definition sheet and every page picks it up.
The second advantage is that MTD and YTD sit next to each other. Monthly HR reporting frequently overreacts to a single bad month; showing both views on one row makes it obvious whether a dip is noise or a trend. The vs Prior Year columns add a third reference point without another click.
The third is portability. It is a Google Sheet. Anyone you share it with can open it, on any device, without buying anything. For the same reasons it works well alongside our other scorecards — see the Internal Communications KPI Dashboard in Google Sheets and the Workplace Safety KPI Dashboard in Google Sheets, which use the identical layout.
Opportunities for Improvement
Honesty helps here more than a sales pitch. First, data entry is manual. There is no HRIS connector, so someone has to type twelve numbers a month per KPI — fine for a monthly cadence, tedious if you wanted daily refreshes.
Second, the workbook is built around a twelve-month calendar year. If you run a fiscal year that starts in April you set cell E3 accordingly, but comparisons to a differently based prior year need a little care when you first set it up.
Third, long text can clip. Very long KPI names, KPI Group labels or Owner values are truncated at the column edge on the scorecard and definition pages rather than wrapping — on the sample build the Definition field on the KPI Trend page is cut off mid-sentence. Widening the column or shortening the label fixes it in a few seconds, but it is worth knowing before you paste in a 60-character metric name.
Fourth, there is no user-level security inside the sheet. Google Drive sharing is all-or-nothing per sheet; if different managers must see different KPI groups, you will need separate copies.
Best Practices
- Set cell E3 on the input sheets before you enter anything else — it defines the reporting year for the whole workbook.
- Fill Target and Prior Year for the full twelve months up front. The traffic lights are meaningless without a target, and the vs PY columns need last year’s figures.
- Keep KPI names under about 30 characters so nothing clips on the scorecard.
- Set the Type column honestly: mark cost, cycle-time and vacancy KPIs as LTB, everything else as UTB. Getting this wrong inverts the traffic light.
- Assign a real owner to each KPI on the KPI Definition sheet. A scorecard without owners becomes a report nobody acts on.
- Agree your thresholds once with the leadership team, change them in the Status formulas, and leave them alone for the year.
- Keep a separate copy per year rather than overwriting last year’s numbers — the prior-year columns will thank you.
Explore Relevant Templates
- Internal Communications KPI Dashboard in Google Sheets — the same scorecard build for reach, engagement and channel performance.
- Conflict Resolution KPI Dashboard in Google Sheets — case volume, resolution time and escalation metrics for employee relations.
- Employee Benefits Utilization KPI Dashboard in Google Sheets — enrolment, take-up and cost per benefit.
- Employee Retention KPI Dashboard in Google Sheets — the retention counterpart to this template’s Retention & Mobility group.
- Read the Conflict Resolution scorecard walkthrough and the Diversity & Inclusion Dashboard in Google Sheets for two more HR-side builds.
Also available as: Leadership Development Dashboard in Power BI — the analytical, multi-chart take on the same topic, useful alongside this scorecard rather than instead of it.
Prefer to learn the reporting side yourself? The Excel Pivot Tables & Dashboards course on NextGenTemplates Academy walks through the techniques step by step, with practice files.
Get the Leadership Development KPI Dashboard in Google Sheets
Frequently Asked Questions
What KPIs does the Leadership Development KPI Dashboard track?
The Leadership Development KPI Dashboard tracks 14 KPIs in four groups: Development & Training, Succession & Pipeline, Retention & Mobility and Effectiveness & Impact. Examples include Leaders Trained, Succession-Plan Coverage, Ready-Now Successors, Internal Promotion Rate and High-Potential Retention. Every KPI is editable on one sheet.
Can I add or rename KPIs?
Yes. The KPI Definition sheet is the master list. Rename a KPI, change its unit, owner, priority or type, or add rows, and the KPI Dashboard, KPI Trend and KPI Analysis pages update on their own. You never edit a formula to do it.
How long does setup take?
Under 10 minutes for the first month. Make a copy from the link in the PDF, set the reporting-year start month in cell E3, then type your actuals, targets and prior-year numbers into the three yellow input sheets. Every month after that is one column of typing.
Does the Leadership Development KPI Dashboard connect to my HRIS or LMS?
No. It is a manual tracking and visualisation template — you enter the monthly numbers yourself. That is deliberate: it works identically whether your data lives in Workday, in a training provider’s portal, or in someone’s notebook.
How does this compare to BambooHR or Workday?
Those are full HR platforms billed per employee per month, typically $6-15. The Leadership Development KPI Dashboard is a one-time $8.99 scorecard you own outright. It will not run payroll or store employee records; it gives you a shared monthly leadership KPI view at a fraction of the cost.
Is this an assessment or compliance tool?
No. Figures such as 360-Feedback Score, Ready-Now Successors and Leadership Bench Strength are simply the values you type in. The Leadership Development KPI Dashboard displays and trends them; it does not assess anyone, validate any instrument, or offer employment-law or HR advice. Follow your own policies before acting on any number.
Is this the same as the analytical Leadership Development dashboard?
No. This is the KPI scorecard edition — month picker, traffic lights, KPI Trend page and KPI Analysis page. The analytical version is a separate multi-chart template. Many teams use the scorecard for monthly reporting and the analytical dashboard for deeper slicing.
About the Author
Built by PK — Microsoft Certified Professional with 15+ years of Excel, Google Sheets and Power BI experience. Founder of NextGenTemplates, reaching 300K+ subscribers across three YouTube channels. Every template is hand-built and tested before release.
Conclusion
If leadership development is something your organisation reports on monthly, this template turns that report into a five-minute job. Fourteen KPIs, four groups, one month picker, traffic lights on both MTD and YTD, and a KPI list you can rewrite in a minute without touching a formula. It will not replace an HR platform, and it does not pretend to — it replaces the spreadsheet gymnastics that usually sit around one.
Instant download · One-time payment · No subscription
Last updated: August 2026