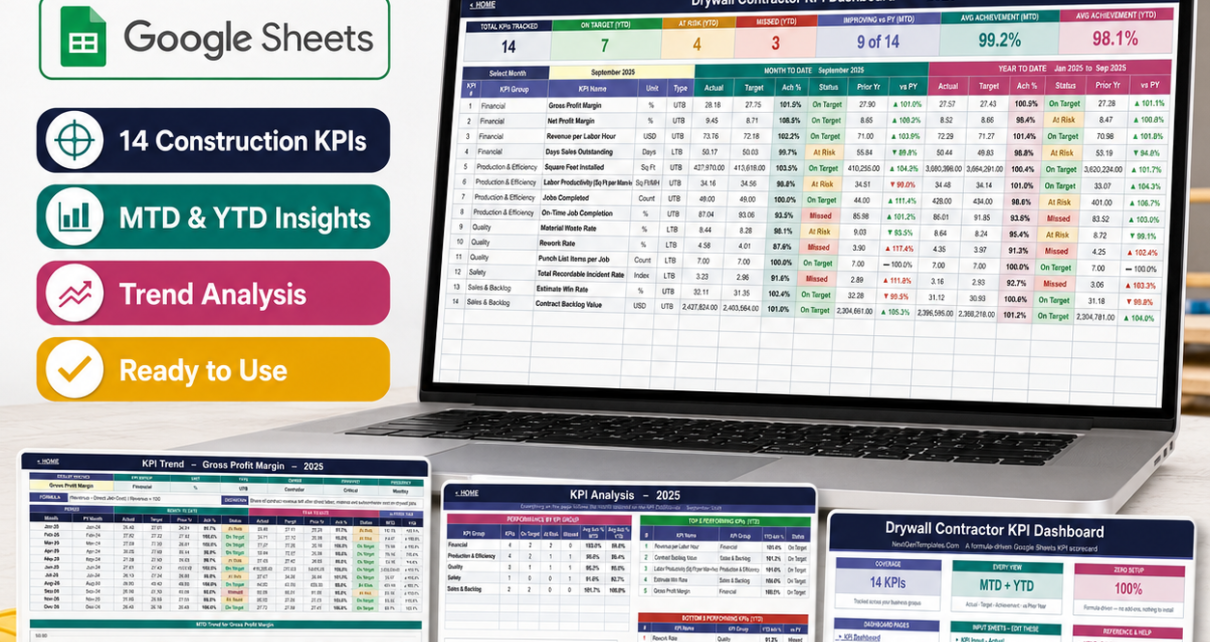
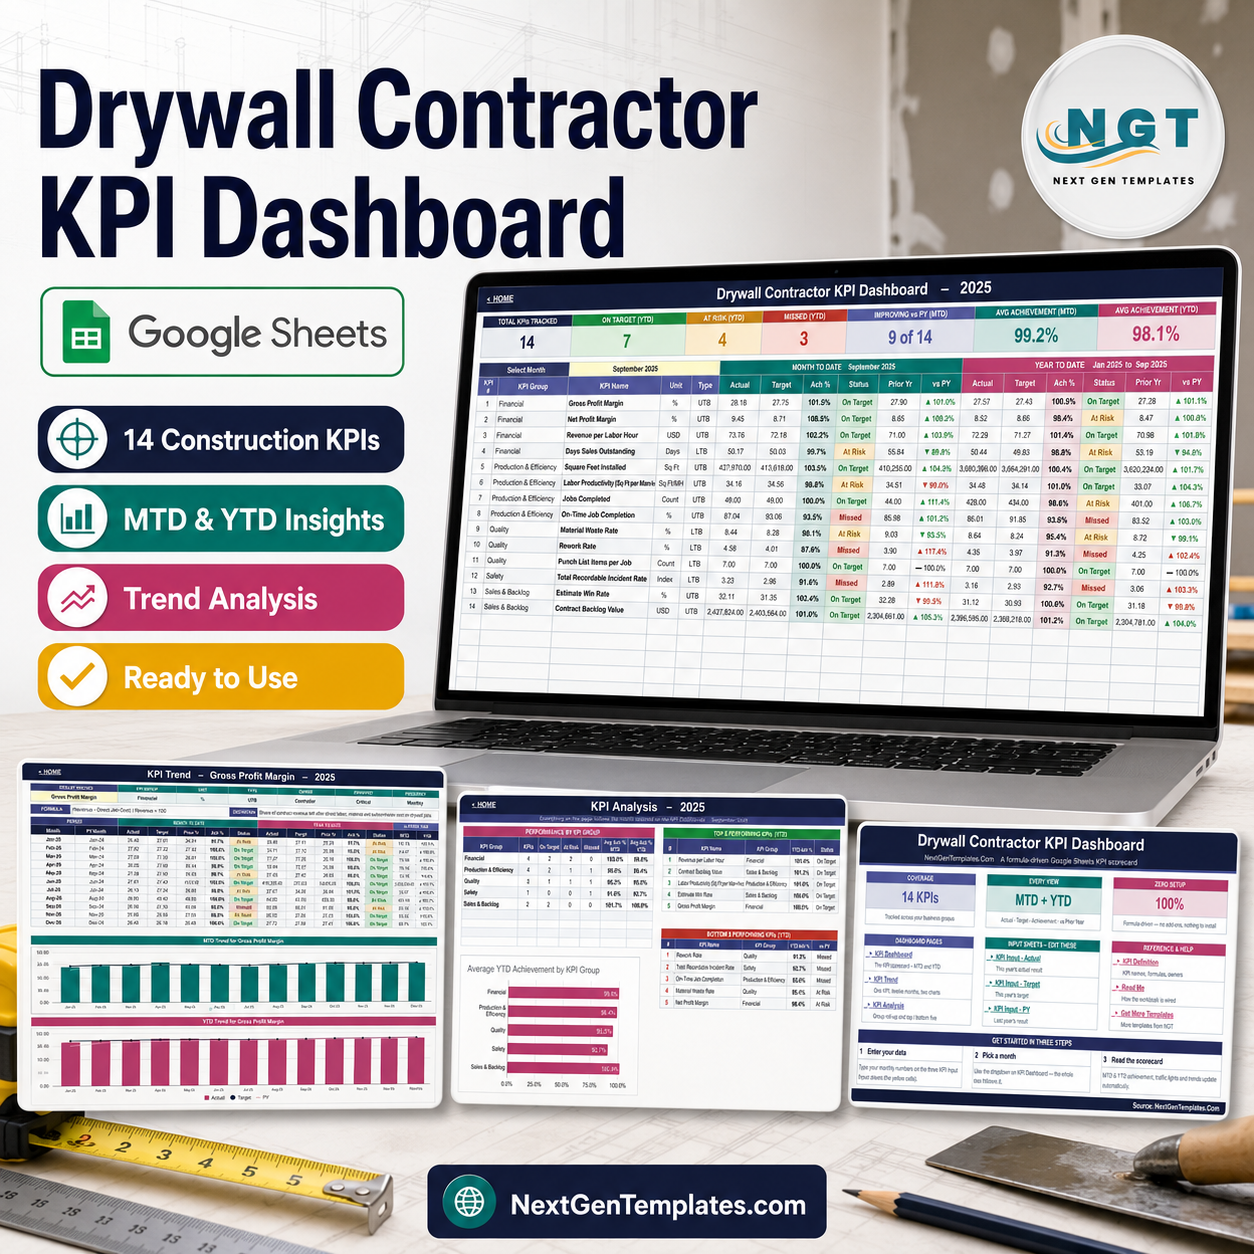
Most drywall contractors already know their revenue. Far fewer can say, on the fifth of the month, whether labor productivity slipped, whether rework ate the margin, or whether the backlog is quietly shrinking. The Drywall Contractor KPI Dashboard in Google Sheets puts all of that on one page: 14 drywall-specific KPIs in five groups, each showing Month-to-Date and Year-to-Date actual, target, achievement percentage, status and prior-year comparison. Pick a month from a single dropdown and every page in the workbook follows it.Drywall Contractor KPI Dashboard in Google Sheets
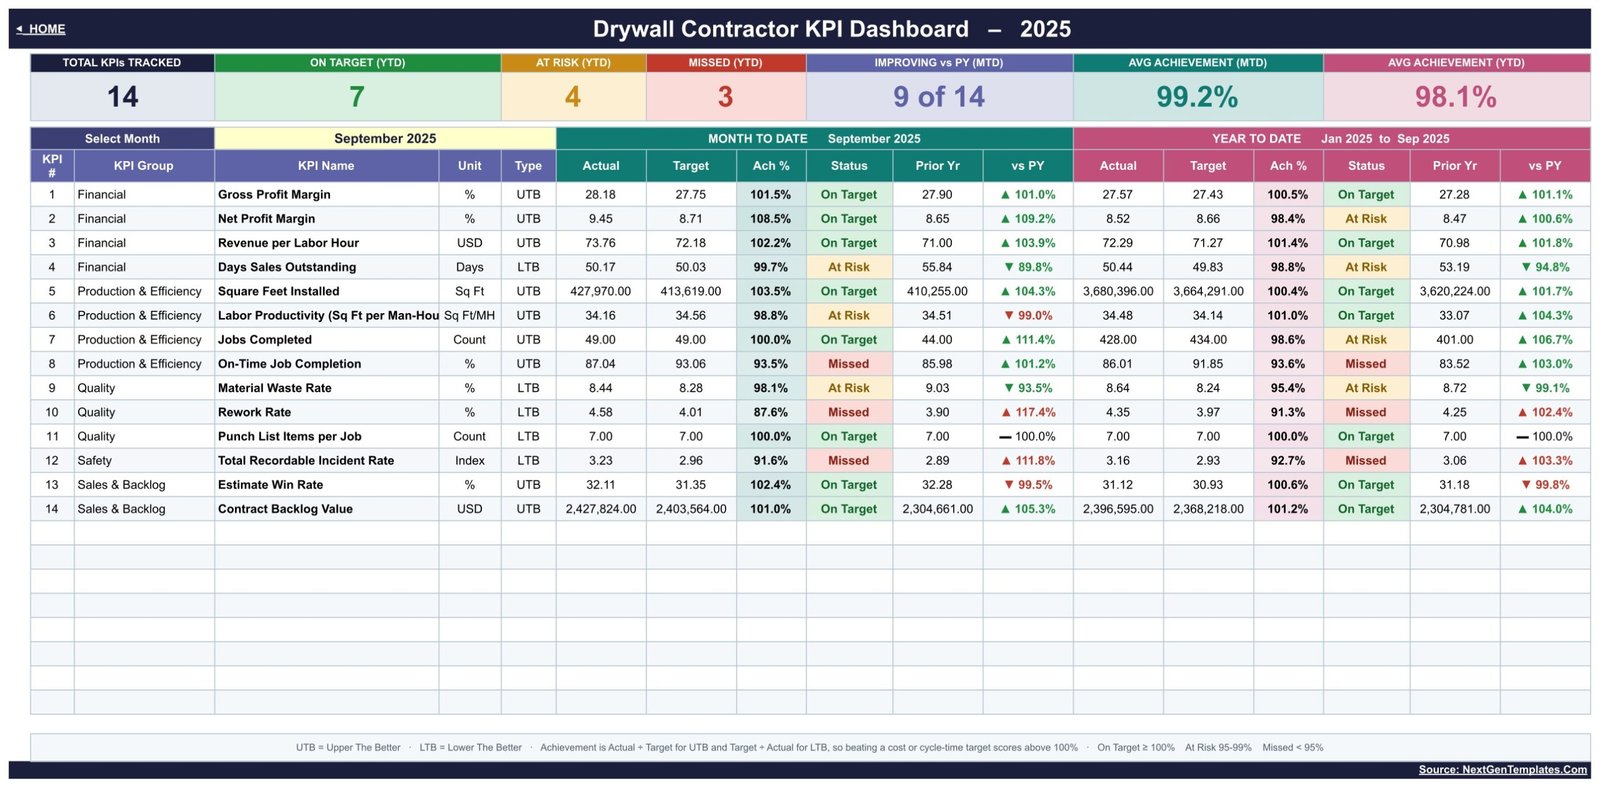
In the sample year that ships with the template, 7 of 14 KPIs sit On Target for the year, 4 are At Risk and 3 are Missed, with average YTD achievement at 98.1%. That is the point of a scorecard: the headline number looks healthy while three specific metrics – rework, on-time completion and recordable incidents – are the ones actually costing money.
This is the KPI Dashboard edition – the month-picker scorecard with a KPI Trend page and a KPI Analysis page. It is a different template from the Drywall Contractor KPI Scorecard and from our analytical dashboards. The same dashboard is also published as the Excel edition and the Power BI edition.
Key Features of the Drywall Contractor KPI Dashboard
Everything in the workbook is native Google Sheets formulas. There is no add-on to authorise, no Apps Script, no macro, and no refresh button – the numbers recalculate as you type.
- 14 KPIs across five groups. Financial (Gross Profit Margin, Net Profit Margin, Revenue per Labor Hour, Days Sales Outstanding), Production & Efficiency (Square Feet Installed, Labor Productivity in Sq Ft per Man-Hour, Jobs Completed, On-Time JobDrywall Contractor KPI Dashboard in Google Sheets Completion), Quality (Material Waste Rate, Rework Rate, Punch List Items per Job), Safety (Total Recordable Incident Rate) and Sales & Backlog (Estimate Win Rate, Contract Backlog Value).Drywall Contractor KPI Dashboard in Google Sheets
- MTD and YTD in one row. Each KPI carries Actual, Target, Achievement %, Status, Prior Year and vs PY twice – once for the selected month, once for the year to date.
- Seven header tiles. Total KPIs Tracked, On Target (YTD), At Risk (YTD), Missed (YTD), Improving vs PY (MTD), Average Achievement (MTD) and Average Achievement (YTD).
- Correct scoring for lower-is-better metrics. Every KPI is typed UTB (upper the better) or LTB (lower the better). Achievement is Actual divided by Target for UTB and Target divided by Actual for LTB, so beating a waste, rework, DSO or incident-rate target scores above 100% rather than below it.
- Editable traffic-light thresholds. On Target from 100%, At Risk from 95% to 99%, Missed below 95% – all held in the Status formulas on the dashboard sheet, so you can move them.
- A master KPI list. Add, rename or delete a KPI on the KPI Definition sheet and the dashboard, trend and analysis pages follow automatically. No formula edits anywhere else.
- Twelve months of history per KPI, with prior-year figures behind every month.
Dashboard Pages Explanation
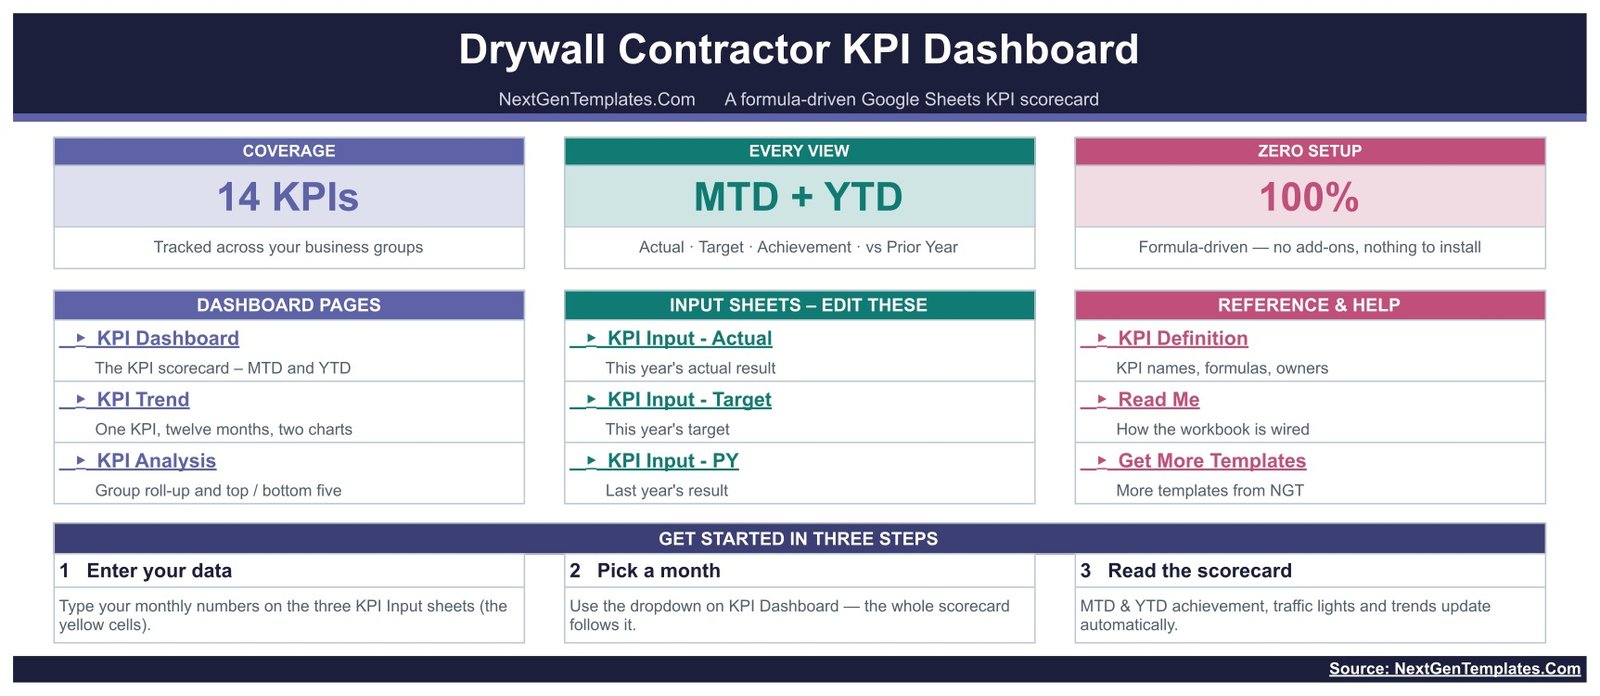
The workbook ships with nine sheets, linked from a Home page that also carries a three-step start guide.
KPI Dashboard
The scorecard itself. A Select Month dropdown sits above a 14-row table split into a Month-to-Date block and a Year-to-Date block. Each row shows the KPI number, group, name, unit and type, then Actual, Target, Achievement %, Status, Prior Yr and vs PY for both periods. Status cells are colour-coded green, amber and red, and the vs PY column carries an up, down or flat marker.
KPI Trend
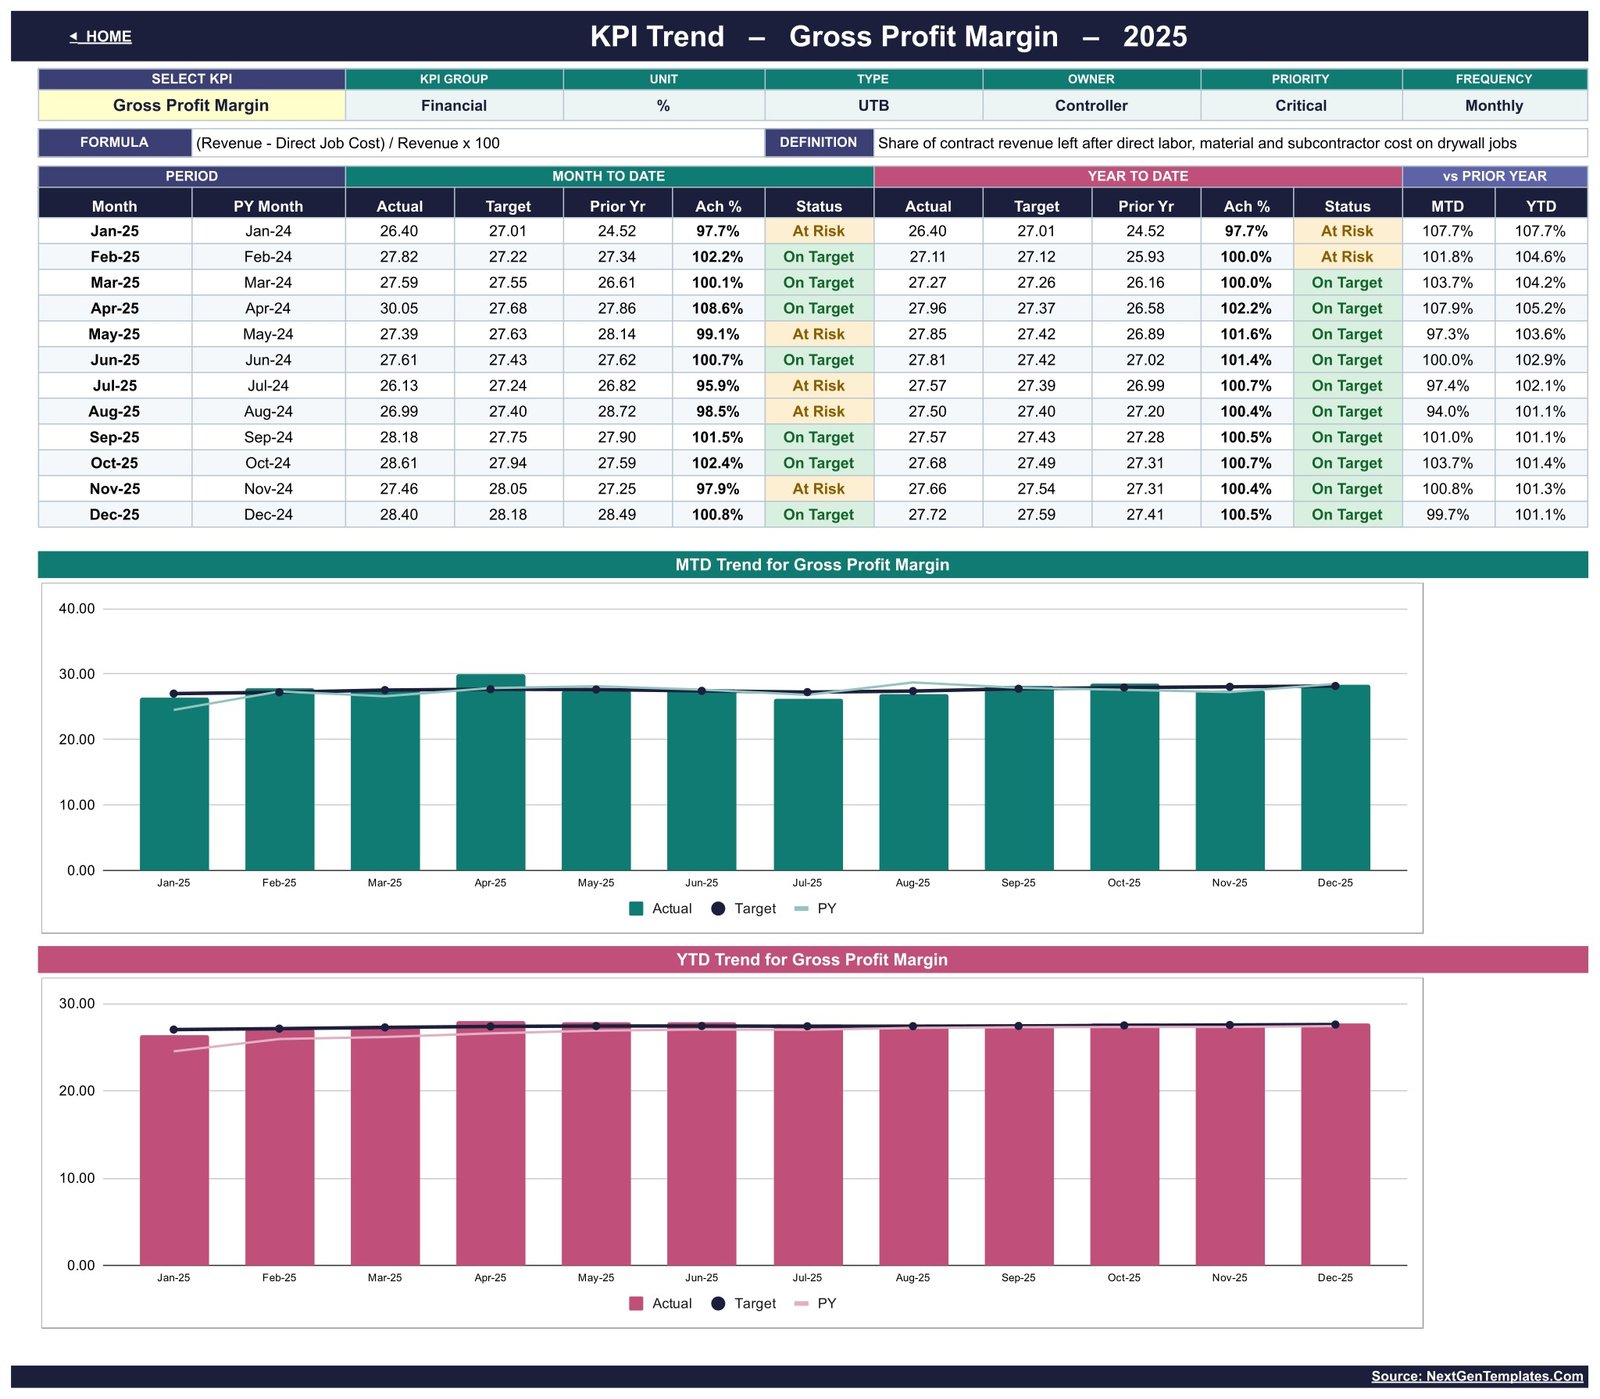
Pick any one KPI from a dropdown and the page fills with its group, unit, type, owner, priority, frequency, formula and definition, then twelve rows – one per month – showing MTD actual, target, prior year, achievement and status alongside the YTD equivalents and the vs-PY ratios. Two charts sit underneath: an MTD trend and a YTD trend, each plotting Actual as bars against Target and prior-year lines.
KPI Analysis
A roll-up that follows the same selected month. Performance by KPI Group counts how many KPIs in each group are On Target, At Risk or Missed and gives the average MTD and YTD achievement per group. An Average YTD Achievement by KPI Group bar chart sits below it, and to the right are Top 5 and Bottom 5 Performing KPIs ranked on YTD achievement. In the sample year, Safety ranks lowest at 92.7% and Sales & Backlog highest at 100.9%.
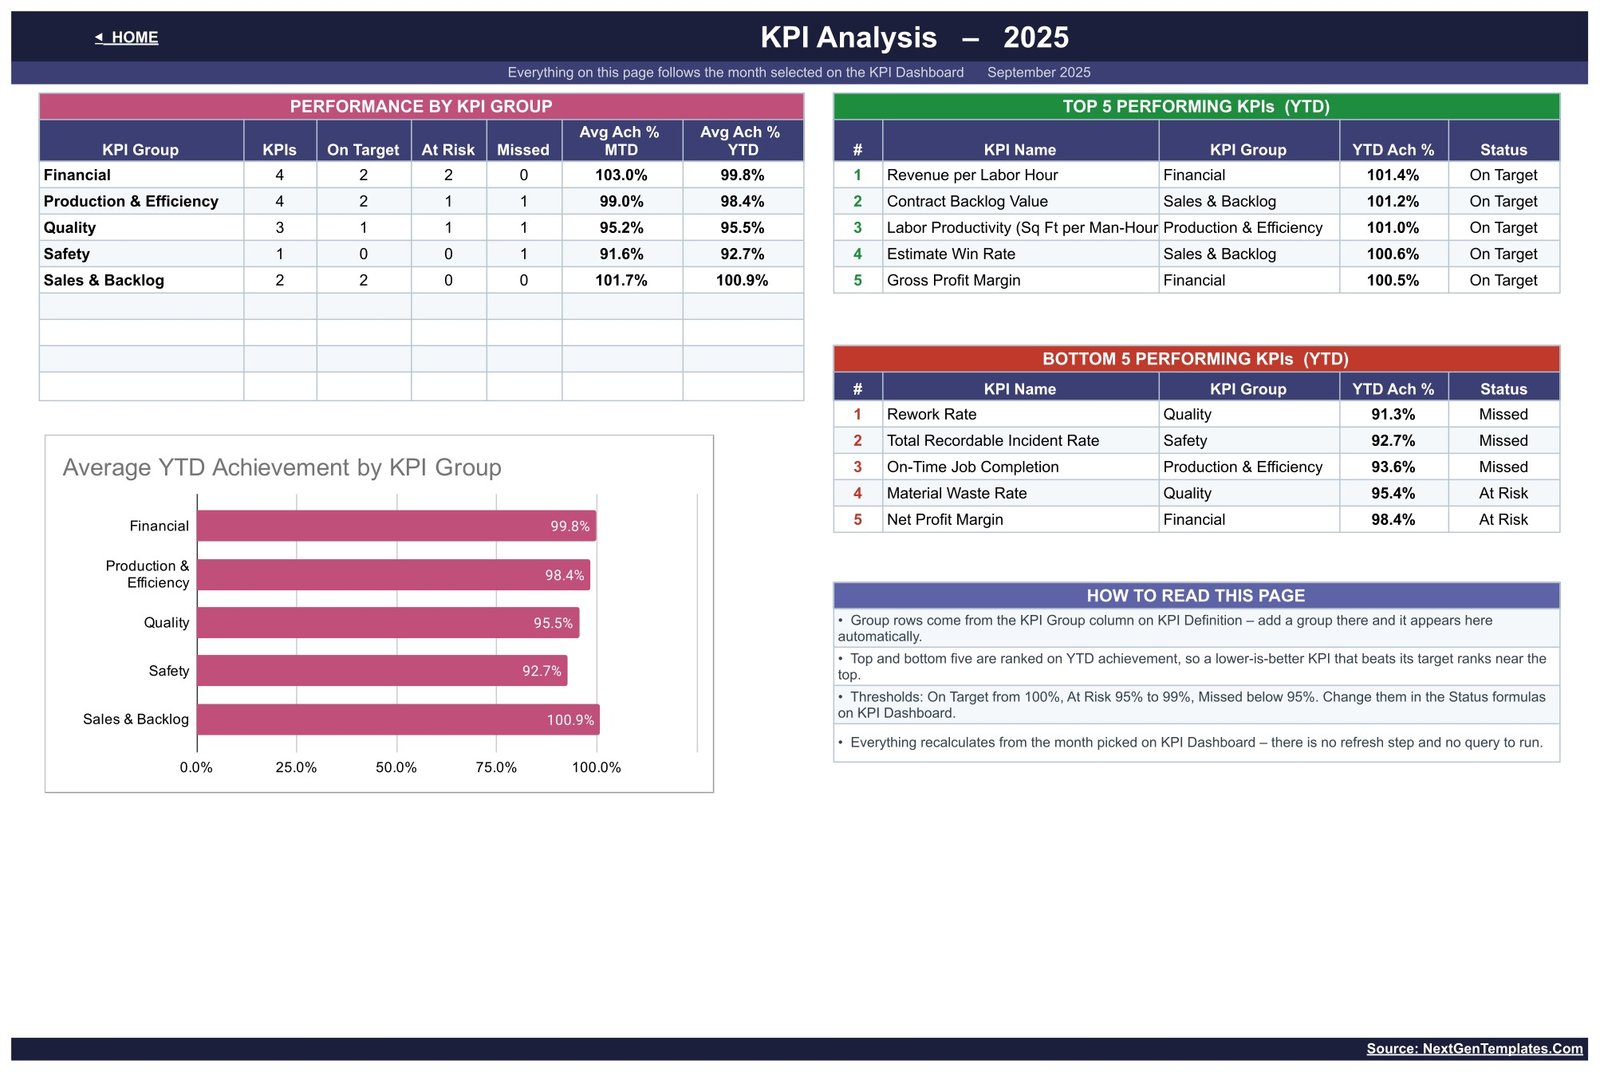
The three input sheets
KPI Input – Actual, KPI Input – Target and KPI Input – PY are laid out identically: one row per KPI, one MTD and one YTD column per month from January to December. Only the shaded cells are for typing. Cell E3 on the Actual sheet sets the first month of the reporting year, so a company running a July-to-June fiscal year changes one cell and the whole workbook re-bases.
KPI Definition, Read Me and Get More Templates
KPI Definition is the master list – number, group, name, unit, formula, definition, type, owner, priority and frequency for all 14 KPIs. It is the sheet you edit to make the template yours. Read Me explains how the workbook is wired, and Get More Templates links to the rest of the library.
Drywall Contractor KPI Dashboard vs. Excel vs. Paid Construction SaaS – Feature Comparison
| Feature | This template (Google Sheets) | Excel KPI dashboard | Paid construction SaaS |
|---|---|---|---|
| Cost | One-time 13.99 (sale 8.99) | One-time 19.99 | Roughly 375 – 800 per month |
| Platform | Any browser, plus the free mobile app | Microsoft Excel desktop | Vendor cloud platform |
| Setup time | Under 30 minutes | Under 30 minutes | 4 – 12 weeks of onboarding |
| Real-time team collaboration | Yes, natively | Only via OneDrive co-authoring | Yes |
| Mobile access | Yes | Limited | Yes |
| Customizable KPI list | Yes – one master sheet | Yes | Restricted to vendor fields |
| Share with link | Yes – viewer or editor | File must be sent or synced | Per-seat licence |
| MTD and YTD in one row | Yes | Yes | Usually separate reports |
| Prior-year comparison | Built in on both MTD and YTD | Built in | Add-on module |
| Year-1 cost at 5 users | 13.99 total | 19.99 total | 4,500 – 9,600 |
Who Should Use This Template
It fits drywall, taping and interior finishing contractors with roughly 5 to 60 field staff who already record job costs and labor hours somewhere and want a monthly management page rather than a live integration. In practice that means four roles:
- Owners and general managers who need one page before a partner meeting or a bank review.
- Controllers who own margin, DSO and backlog and report them monthly.
- Field superintendents who live on square feet per man-hour, waste and on-time completion.
- Chief estimators tracking win rate against the backlog it feeds.
It is the wrong tool if you want automatic job costing pulled from accounting software, daily crew scheduling, take-off estimating, or per-project Gantt charts. Those are different products. This is a monthly scorecard, and it is deliberately manual so it works no matter what accounting stack you run.
Real-World Use Cases
Catching a margin illusion
A 22-person residential drywall crew closed a month at 28.18% gross margin against a 27.75% target – comfortably On Target. The same row set showed On-Time Job Completion at 93.5% achievement and Rework Rate at 87.6%, both Missed. The margin was being propped up by crews absorbing rework in overtime that had not yet hit the cost report. Without a scorecard, that month reads as a win.
Quarterly lender reporting
A commercial interiors contractor with a covenant tied to profitability keeps Days Sales Outstanding, Contract Backlog Value and Net Profit Margin on the YTD half of the dashboard, prints the KPI Dashboard sheet to PDF and sends it. The prior-year columns answer the lender’s next question before it is asked.
Separating a bad week from a bad trend
A superintendent saw Labor Productivity land at 98.8% of target for the month. The KPI Trend page for that single KPI showed twelve months of history and made it clear this was the second consecutive month under target, not one bad week – which pointed at board delivery scheduling rather than crew performance.
Advantages of the Drywall Contractor KPI Dashboard
- Nothing to install or authorise. Native formulas only. If you can open a Google Sheet, you can run it. Google’s own guide to sharing files and folders covers the only setup step that matters.
- Construction-specific KPIs, not generic business metrics. Board square footage installed, square feet per man-hour, punch list items per job and OSHA recordable incident rate are the numbers a drywall business actually argues about.
- Exception-first. The Bottom 5 list and the Missed count tell you where to look before you read a single row.
- Portable across fiscal years. One cell re-bases the reporting year.
- Genuinely editable. Change the KPI list on one sheet and everything else follows – no hidden helper columns to repair.
Opportunities for Improvement
Being straight about the limits is more useful than a feature list:
- Data entry is manual. Three input sheets a month, typically 15 to 30 minutes once your source reports are open. There is no accounting connector.
- Monthly granularity only. There is no weekly or per-job view. Job-level analysis needs a different template.
- Targets are yours to set. The sample targets are realistic but generic; a scorecard is only as honest as its targets.
- One year at a time. Multi-year comparison means the current year plus prior year, not a rolling five-year history.
- Charts are Google Sheets charts. Clear and readable, but not interactive drill-down. If you want slicers and cross-filtering, the Power BI edition is the better fit.
Best Practices
- Close the month before you enter it. Entering provisional cost figures and correcting them later destroys the trend page.
- Set targets once a year, not monthly. Moving a target after a miss is how scorecards become decoration.
- Assign every KPI an owner. The KPI Definition sheet has an Owner column – use it, and review the Bottom 5 with those people by name.
- Trim the list. Fourteen KPIs is already a lot for a monthly meeting. Delete the ones nobody acts on rather than adding more.
- Protect the calculated ranges. Share the sheet with your controller and superintendent as editors and everyone else as viewers, and protect everything outside the input cells.
- Read the trend before you react. A single Missed month on a volatile KPI such as Jobs Completed usually means seasonality, not failure.
Explore Relevant Templates
- Drywall Contractor KPI Dashboard in Google Sheets – the template described in this article.
- Drywall Contractor KPI Dashboard in Excel – the same 14 KPIs for Microsoft 365 teams.
- Drywall Contractor KPI Dashboard in Power BI – interactive report pages for the same metric set.
- Drywall Contractor KPI Scorecard in Google Sheets – the lighter scorecard edition.
- Masonry Contractor KPI Dashboard in Google Sheets – the same engine, masonry KPIs.
- Insulation Contractor KPI Scorecard in Google Sheets – for insulation and spray foam crews.
- Browse every Google Sheets KPI Dashboard.
Frequently Asked Questions
What do I actually download?
A PDF. It carries the “Make a copy” link for the Google Sheet along with setup notes. Click the link and Google Drive creates your own private, fully editable copy. There is no file to import and nothing to install.
How is this different from the Drywall Contractor KPI Scorecard?
They are separate products. The scorecard is a lighter monthly summary. This KPI Dashboard edition adds a dedicated KPI Trend page for any single KPI, a KPI Analysis page with group roll-ups and top and bottom five rankings, and a wider 14-KPI set covering safety and backlog.
Can I add my own KPIs?
Yes. The KPI Definition sheet is the master list. Add a row with a group, name, unit, formula, definition, type, owner, priority and frequency, and the dashboard, trend and analysis pages pick it up automatically.
Does it work on a phone or tablet?
Yes, through the free Google Sheets app. The scorecard is wide, so a tablet is more comfortable than a phone for reading the full MTD and YTD table.
Why do some lower-is-better KPIs show above 100%?
Because that is correct. Rework Rate, Material Waste Rate, Days Sales Outstanding, Punch List Items per Job and Total Recordable Incident Rate are typed LTB, so achievement is Target divided by Actual. Coming in below target is a win and scores above 100%.
Can two people use it at once?
Yes. It is an ordinary Google Sheet, so your controller can enter financials while your superintendent enters production hours.
Is the sample data real drywall company data?
No. It is a full year of realistic sample figures so every chart, status and ranking renders the moment you open the file. Replace it with your own numbers on the three input sheets.
About the Author
Built by PK – Microsoft Certified Professional with 15+ years of Excel, Google Sheets, and Power BI experience. Founder of NextGenTemplates, reaching 300K+ subscribers across YouTube channels. Every template is hand-built and tested before release.
Conclusion
A drywall business does not fail because nobody looked at revenue. It fails because rework, waste, collection days and safety drift a little each month while the top line still looks fine. The Drywall Contractor KPI Dashboard in Google Sheets makes that drift visible in one page a month: 14 KPIs, MTD and YTD together, prior-year comparison on every line, and a Bottom 5 list that tells you where to start.
Get the Drywall Contractor KPI Dashboard in Google Sheets – instant download, lifetime access and free updates. Prefer Microsoft 365? The Excel edition and the Power BI edition carry the same metric set.
For walkthroughs of this and every other NextGenTemplates build, subscribe on youtube.com/@PKAnExcelExpert.