Church Finance Dashboard in HTML is a browser-based interactive analytics template designed for churches, ministries, and faith-based organizations that need to track tithes, offerings, departmental expenses, donor contributions, and monthly income patterns — all without installing any software. This HTML Dashboard runs directly in Chrome, Edge, Firefox, or Safari and provides a complete 360-degree view of your church’s financial health through 5 interactive dashboard pages with dynamic charts, KPI cards, and filter controls.
Whether you are a church pastor, finance committee member, treasurer, or nonprofit administrator, this dashboard consolidates all your financial data into one clean, responsive, and visually compelling interface. Simply open the HTML file in your browser, replace the sample data with your own, and start analyzing. For alternative platforms, explore the Church Finance Dashboard in Excel or the Church Finance Dashboard in Power BI.
Click here to Purchase Church Finance Dashboard in HTML
Key Features of Church Finance Dashboard in HTML
The Church Finance Dashboard in HTML includes 5 interactive dashboard pages with 20+ analytical charts, 6 dynamic KPI cards, interactive filter controls, and a searchable data view with CSV export. It tracks Total Income, Total Expense, Net Amount, Budget Allocated, Received, and Pledged across multiple departments, fund types, donor types, and payment methods. The dashboard is built with modern web technologies and requires no coding knowledge — just open and explore.
Key capabilities include fund type analysis with income breakdown by sub-category and fund distribution, department-level tracking comparing budgets, expenses, income, and transaction counts, donor insights showing contribution patterns by type, payment method, and event, and monthly trend analysis for spotting seasonal giving patterns. All pages feature interactive filters for instant data slicing.
Dashboard Pages Explanation
Overview Page
The Overview Page is the high-level command center of your church finances. It displays 6 KPI cards at the top showing Total Income, Total Expense, Net Amount, Budget Allocated, Received, and Pledged. Below the KPI cards, you’ll find five interactive charts: Income by Category shows how revenue is distributed across different income categories, Transaction Status Distribution displays the breakdown of completed, pending, and cancelled transactions, Monthly Income Trend tracks income patterns over time to identify seasonal giving peaks, Income vs Expense by Department compares financial performance across all church departments, and Top 10 Donors by Income highlights your most significant contributors. Multiple filter controls allow you to slice data by category, department, fund type, and status instantly.
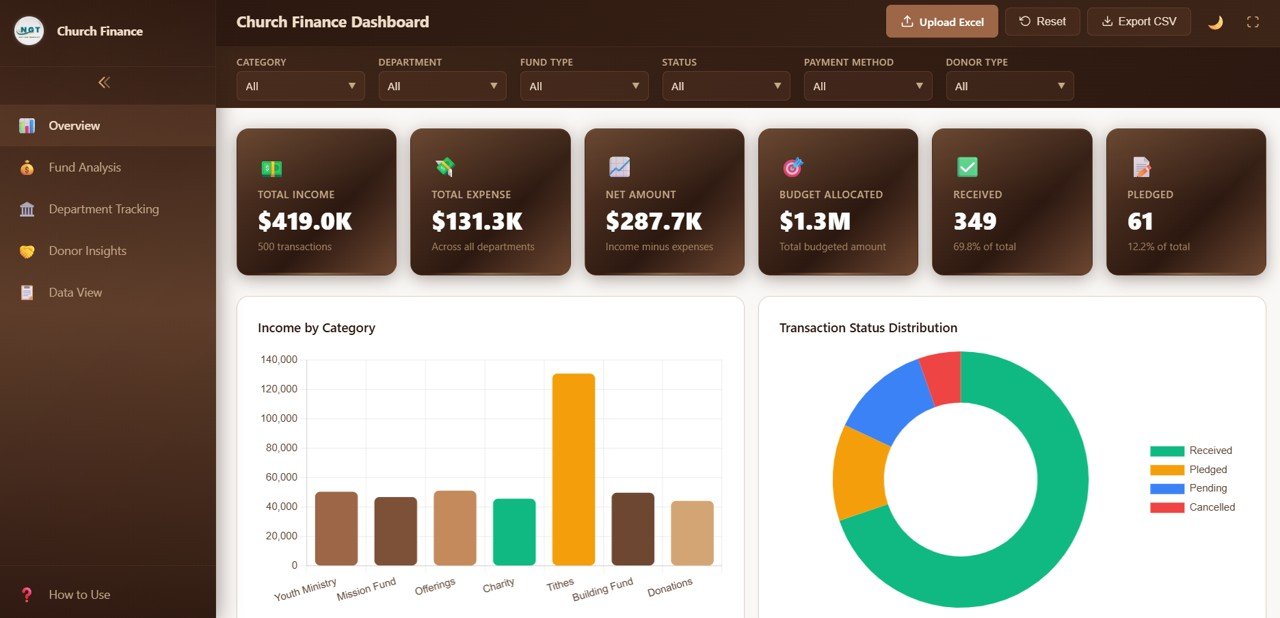
Church Finance Dashboard Overview
Fund Analysis Page
The Fund Analysis page breaks down all financial data by fund type to help treasurers understand exactly where funds are coming from. It includes five analytical charts: Income by Fund Type shows total income grouped by each fund category, Income by Sub Category provides a granular breakdown within each fund type, Fund Type Distribution displays the proportional split across all fund types, Category Income by Fund Type cross-references income categories against fund types, and Monthly Income by Fund Type tracks how each fund type performs over time. This page is essential for understanding tithe, offering, mission fund, building fund, and special collection patterns.
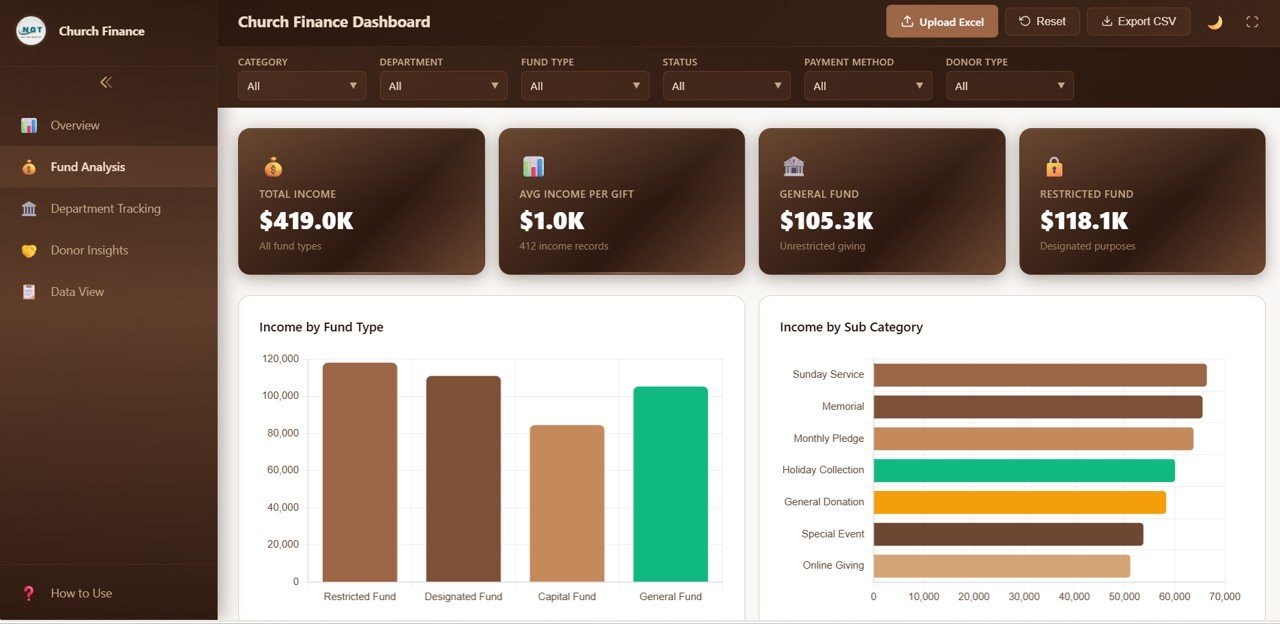
Fund Analysis Page
Department Tracking Page
The Department Tracking page provides financial visibility across all church departments. It features five charts: Income by Department compares revenue generated by each department, Budget Allocation by Department shows how the church budget is distributed, Expense by Department tracks spending patterns, Department Transaction Count measures activity levels, and Monthly Department Income Trend identifies which departments are growing or declining over time. This page helps church leadership make data-driven decisions about budget allocation and resource planning.
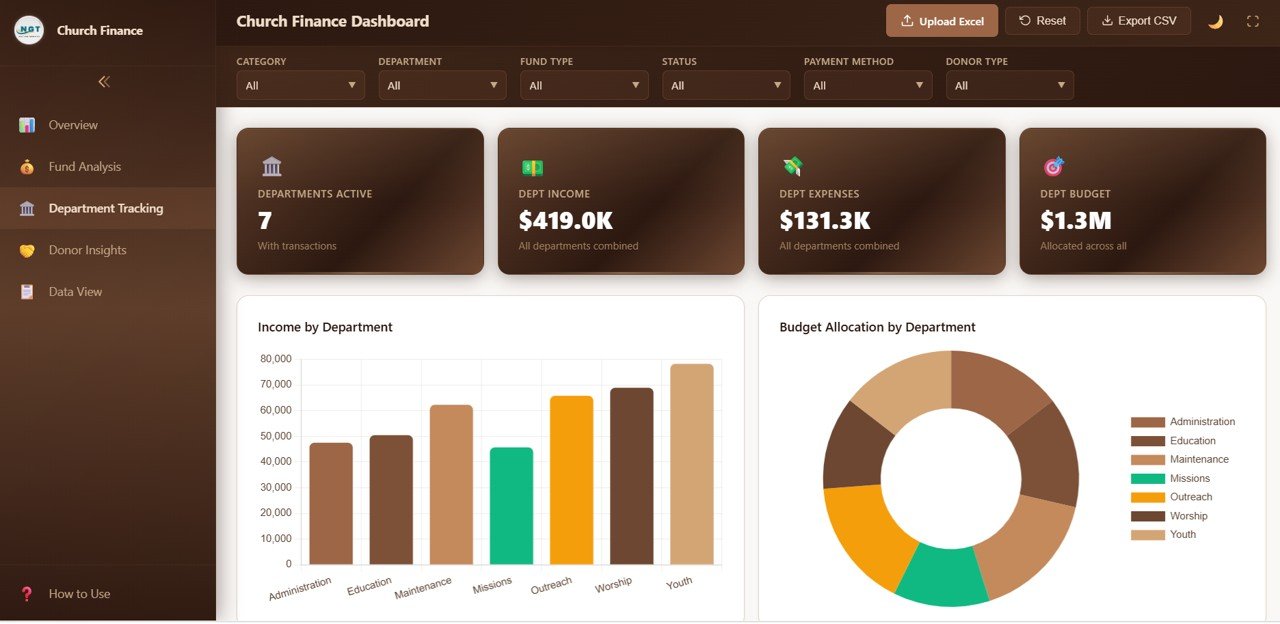
Department Tracking Page
Donor Insights Page
The Donor Insights page analyzes donor behavior and contribution patterns with five focused charts: Income by Donor Type segments contributions by individual, corporate, foundation, and other donor categories, Income by Payment Method shows which payment channels (cash, check, online, bank transfer) your donors prefer, Donor Type Distribution displays the proportional breakdown of donor categories, Income by Event tracks donations linked to specific church events and campaigns, and Monthly Income by Donor Type monitors how different donor segments contribute over time. This analysis helps churches optimize their fundraising and stewardship strategies.
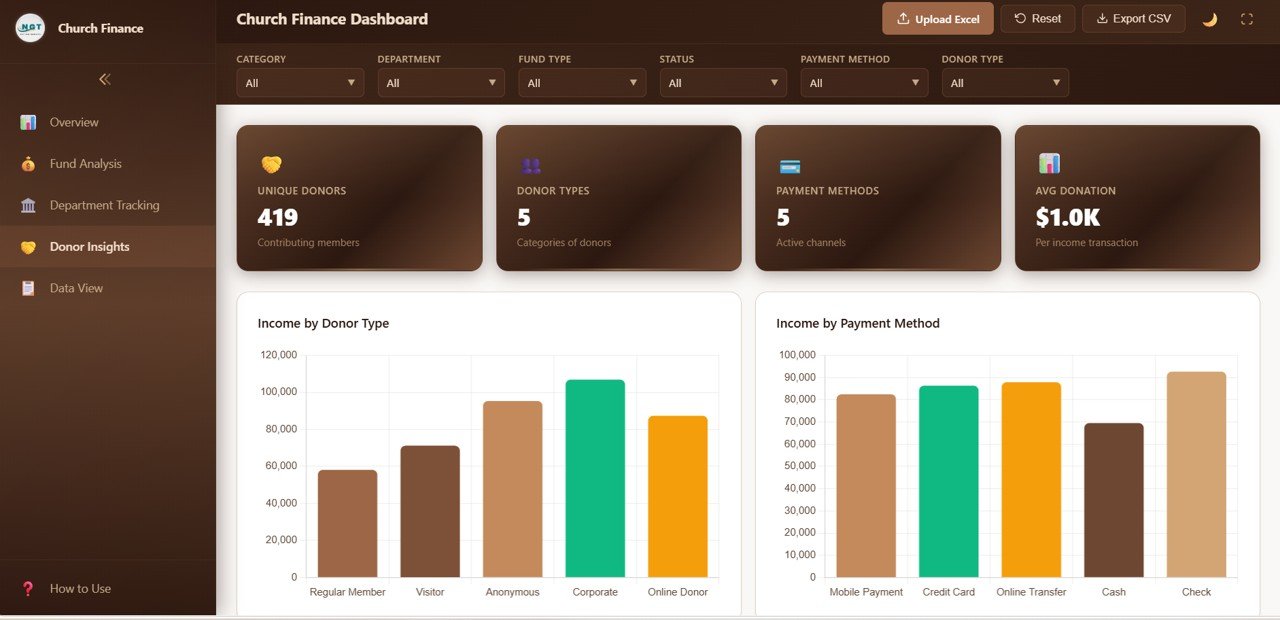
Donor Insights Page
Data View Page
The Data View page provides a detailed data table showing all financial records. You can search for specific transactions using the search bar, sort any column in ascending or descending order, navigate through records using pagination, and export the filtered data to CSV for further analysis in Excel or Google Sheets. This page gives you granular access to every transaction in your church financial database.

Data View Tab
Advantages of Church Finance Dashboard in HTML
The biggest advantage of this HTML dashboard is accessibility — it runs in any modern web browser without requiring Excel, Power BI, or any other desktop software. Church staff can simply open a file and start analyzing finances immediately. The responsive design works well on both desktop and tablet screens, making it easy to present during board meetings or committee sessions.
Unlike spreadsheet-based solutions, the HTML dashboard provides a polished, professional user interface that looks like a commercial SaaS application. The interactive filter controls make it easy for non-technical users to explore data, and the CSV export feature bridges the gap between browser-based viewing and traditional spreadsheet analysis. The dashboard is also lightweight, loads instantly, and requires no internet connection after download.
Opportunities for Improvement
While this dashboard provides comprehensive financial analytics, users who need to create custom calculated fields or build new chart types would need basic HTML/JavaScript knowledge. For churches that require real-time multi-user access, a cloud-based solution or Power BI Service deployment might be more suitable. The Church Finance Dashboard in Power BI offers scheduled refresh capabilities for teams that need automated data updates.
Best Practices
To get the most out of this dashboard, maintain a consistent data entry format with standardized department names, fund types, and donor categories. Update your data file monthly for the most accurate trend analysis. Use the filter controls on each page to create focused views for different stakeholders — for example, filter by department when presenting to department heads, or filter by fund type for finance committee meetings. Export filtered data to CSV periodically for backup and audit trail purposes.
Click here to Purchase Church Finance Dashboard in HTML
Explore Relevant Templates
If you are looking for church finance dashboards on other platforms, explore these related templates from NextGenTemplates:
- Church Finance Dashboard in Excel — Pivot-powered charts with slicer-based filtering in Microsoft Excel.
- Church Finance Dashboard in Power BI — Advanced analytics with DAX measures and dynamic Power BI visuals.
- Religious & Faith-Based Organizations KPI Dashboard in Power BI — KPI-focused tracking for attendance, donations, volunteers, and community engagement.
- Nonprofit Fundraising Dashboard in Excel — Track fundraising campaigns, donor contributions, and grant allocations.
Browse the full collection of HTML Dashboard Templates and Finance Dashboard Templates.
Frequently Asked Questions
What KPIs does the Church Finance Dashboard in HTML track?
The Church Finance Dashboard in HTML tracks 6 key performance indicators: Total Income, Total Expense, Net Amount, Budget Allocated, Received, and Pledged. These metrics are displayed on the Overview page and further analyzed across Fund Analysis, Department Tracking, Donor Insights, and Data View pages with 20+ interactive charts.
Do I need any software to use this dashboard?
No. Simply unzip the downloaded file and open index.html in any modern web browser such as Chrome, Edge, Firefox, or Safari. No Excel, Power BI, or coding knowledge is required.
Can I customize the data for my church?
Yes. The dashboard reads from a data file included in the package. Replace the sample data with your own church financial records in the same format, reload the browser page, and all charts and KPIs update automatically.
How is this different from the Excel and Power BI versions?
The HTML version runs entirely in a web browser with no software installation needed. It provides a modern, responsive interface with interactive charts and CSV export. The Excel version uses pivot tables and slicers, while the Power BI version offers DAX-powered calculations and scheduled refresh capabilities.
Can I export data from the dashboard?
Yes. The Data View page includes a CSV export feature that lets you download the filtered data table for further analysis in Excel or Google Sheets.
What is the best browser-based dashboard for church finances?
The Church Finance Dashboard in HTML from NextGenTemplates is one of the most comprehensive browser-based options available, covering 5 interactive pages with 20+ charts, 6 KPI cards, and a searchable data view with CSV export.
Conclusion
The Church Finance Dashboard in HTML is the ideal solution for churches and faith-based organizations that want professional financial analytics without installing any software. With 5 interactive pages, 20+ analytical charts, 6 KPI cards, interactive filters, and CSV export, it provides everything you need to track income, expenses, donors, departments, and fund types in one clean browser-based interface.
Click here to Purchase Church Finance Dashboard in HTML
Visit our YouTube channel for step-by-step video tutorials: Youtube.com/@NeoTechNavigators