Staffing Agency Dashboard in HTML is a powerful, browser-based analytics template built exclusively for recruitment and staffing agencies that need real-time visibility into their placement operations, recruiter performance, client relationships, and revenue streams. This ready-to-use HTML dashboard eliminates the need for expensive BI tools or complex software installations — simply open the file in any modern web browser and start analyzing your staffing data immediately.
Whether you run a boutique staffing firm or manage enterprise-level recruitment operations, this dashboard provides 5 interactive pages, 6 KPI cards, over 20 dynamic charts, and a full data table view with CSV export capability. With built-in slicers and filters, you can drill into the data by recruiter, industry, region, job type, candidate source, and time period — making it one of the most comprehensive HTML dashboard templates available for the staffing industry.
Click to buy Staffing Agency Dashboard in HTML
Key Features of Staffing Agency Dashboard in HTML
This dashboard stands apart from typical reporting tools because of its depth, interactivity, and zero-dependency architecture. Here are the features that make it a must-have for staffing professionals:
- 5 Interactive Dashboard Pages — Overview, Recruiter Performance, Client and Industry Analysis, Placement Pipeline, and Data View
- 6 KPI Summary Cards — Total Placements, Total Revenue, Average Bill Rate, Avg Satisfaction, Avg Time to Fill, and Placement Rate displayed prominently on the Overview page
- 20+ Dynamic Charts — Covering revenue breakdowns, placement analysis, recruiter comparisons, pipeline tracking, and monthly trends
- Advanced Filtering — Slicers for recruiter, industry, region, job type, candidate source, and time period
- Data View with CSV Export — Search, sort, paginate through all records and export filtered data
- 100% Browser-Based — No installation, no plugins, no internet required after download
- Modern SaaS-Style Design — Clean, professional layout with intuitive navigation
Dashboard Pages Explained
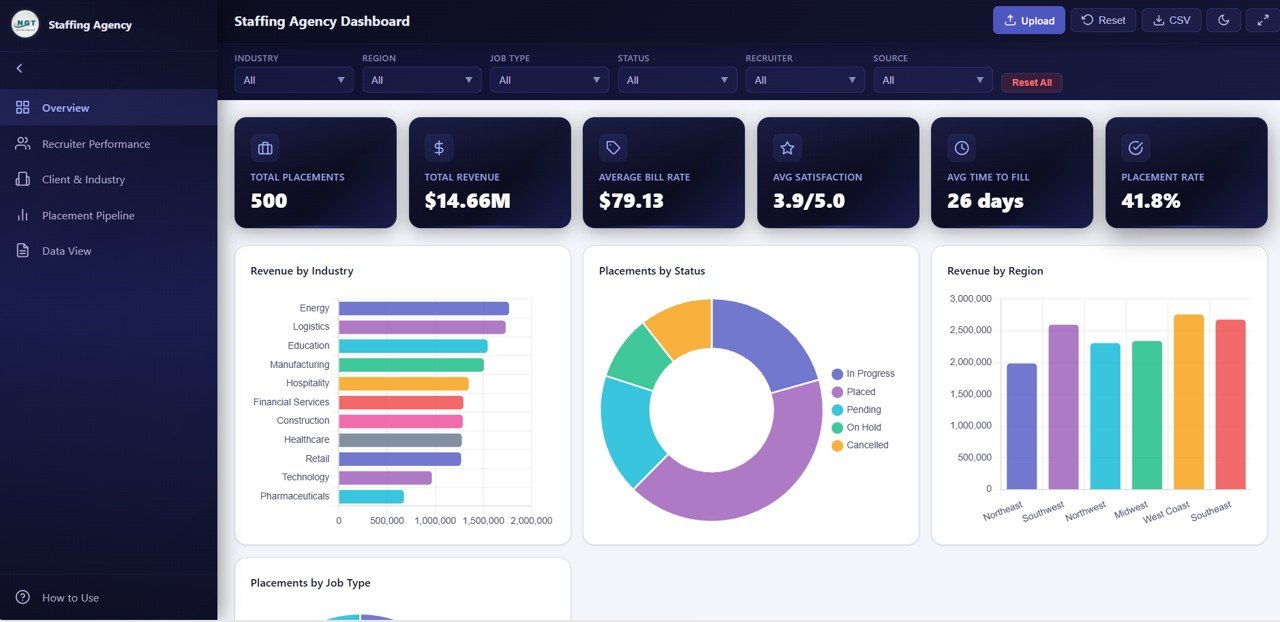
1. Overview Page
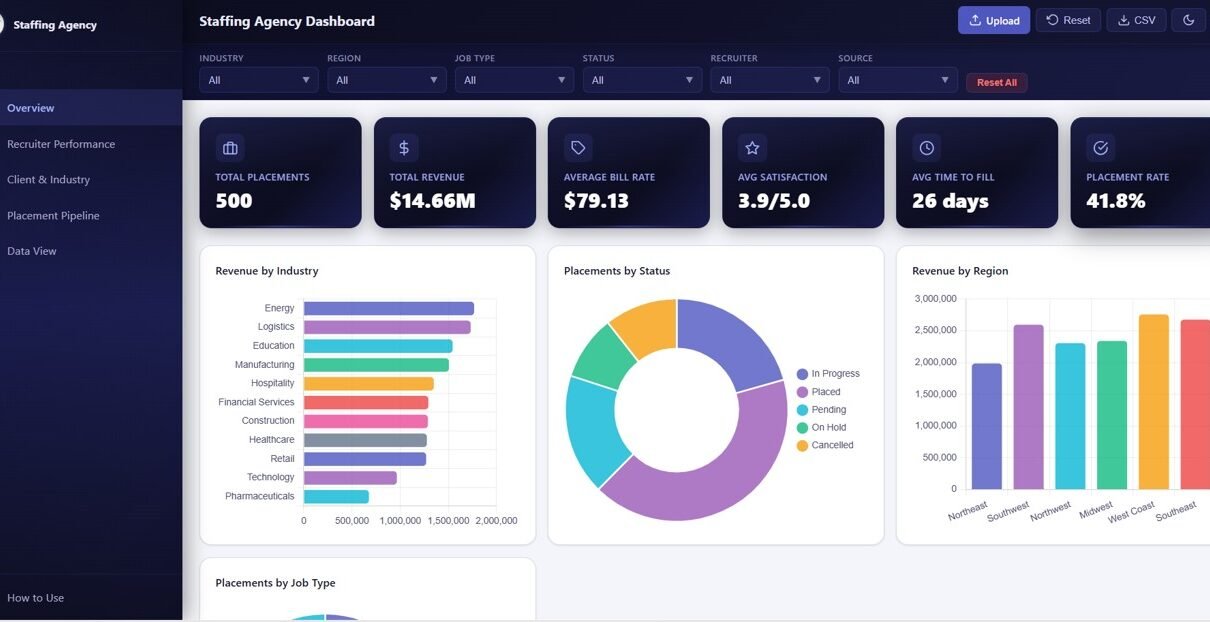
The Overview page serves as the central command center of the Staffing Agency Dashboard. At the top, you’ll find 6 KPI cards that provide a high-level snapshot of your agency’s performance: Total Placements, Total Revenue, Average Bill Rate, Avg Satisfaction, Avg Time to Fill, and Placement Rate.
Below the KPI cards, 5 dynamic charts visualize your key metrics: Revenue by Industry shows which sectors generate the most income, Placements by Status reveals the distribution of active, completed, and pending placements, Revenue by Region highlights geographical performance, Placements by Job Type breaks down hiring by contract, permanent, and temporary positions, and Monthly Revenue Trend tracks financial performance over time.
Multiple interactive slicers let you filter the entire page instantly, making it easy to analyze specific time periods, industries, or regions without switching pages.
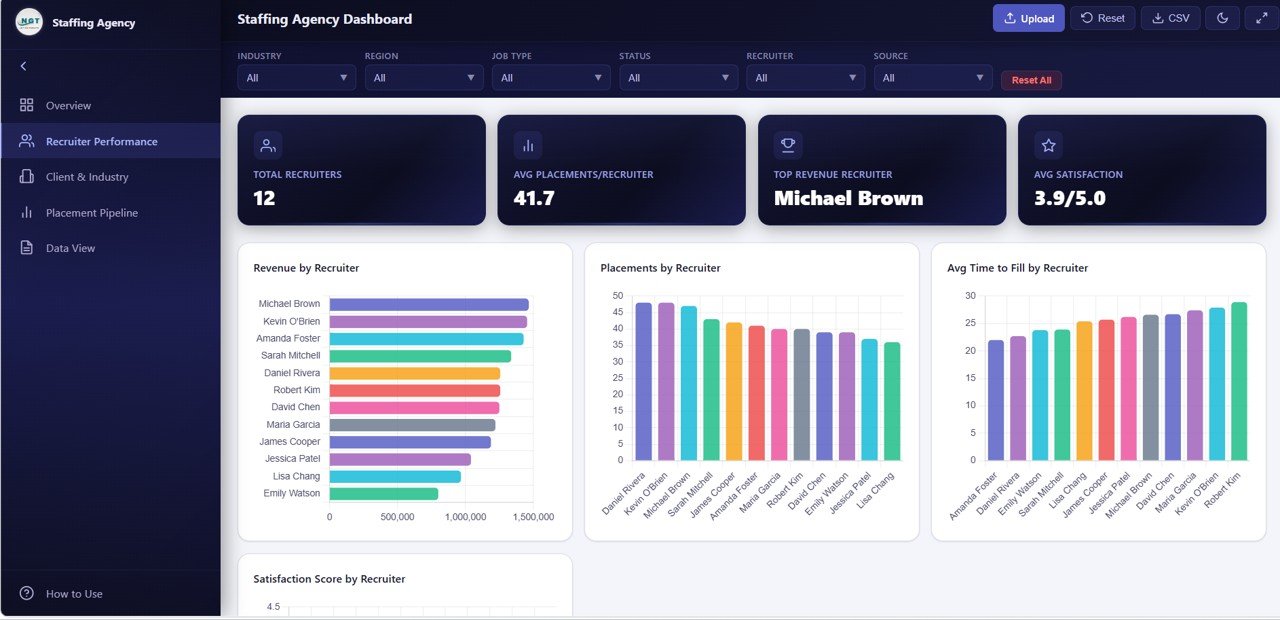
Overview2. Recruiter Performance
The Recruiter Performance page is dedicated to evaluating individual recruiter contributions across your agency. It features 4 targeted charts: Revenue by Recruiter compares how much billing each recruiter generates, Placements by Recruiter shows headcount productivity, Avg Time to Fill by Recruiter reveals hiring speed efficiency, and Satisfaction Score by Recruiter measures client happiness per recruiter.
This page is invaluable for agency managers who want to identify top performers, benchmark recruiter productivity, and make informed decisions about team structure, incentives, and training needs.
 Recruiter Performance
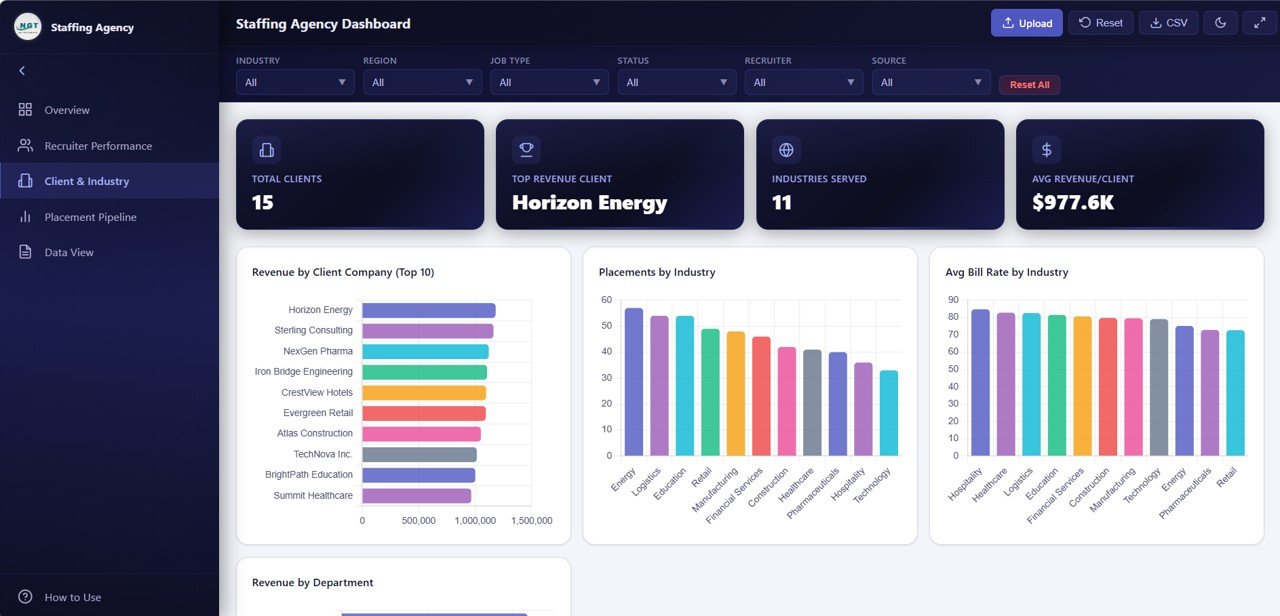
3. Client and Industry Analysis
Understanding your client base and industry exposure is critical for strategic planning. This page delivers 4 analytical charts: Revenue by Client Company identifies your most valuable accounts, Placements by Industry shows hiring volume across sectors, Avg Bill Rate by Industry reveals pricing patterns, and Revenue by Department highlights which functional areas drive the most business.
Staffing agencies can use this page to prioritize high-value client relationships, identify industries with growth potential, and optimize bill rate strategies across different sectors.
 Client and Industry Analysis
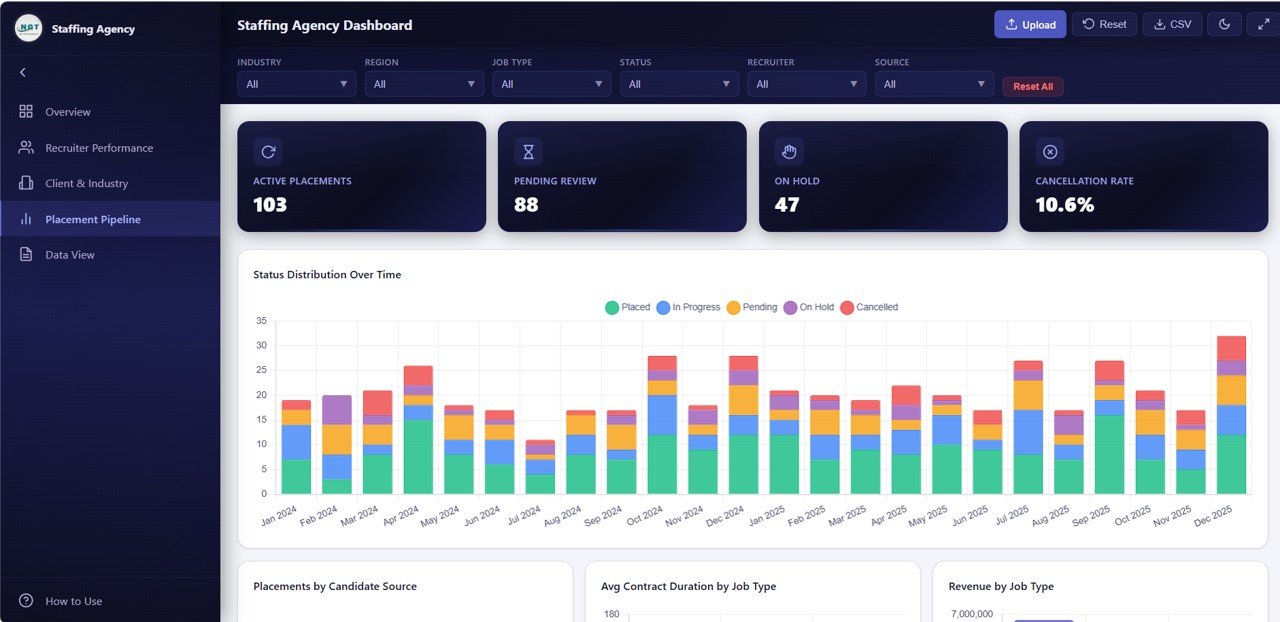
4. Placement Pipeline
The Placement Pipeline page tracks your hiring funnel from sourcing to completion. It includes 4 charts: Status Distribution Over Time shows how placements move through your pipeline stages, Placements by Candidate Source reveals which sourcing channels (job boards, referrals, LinkedIn, databases) deliver the best candidates, Avg Contract Duration by Job Type analyzes engagement lengths, and Revenue by Job Type breaks down income by placement category.
This page is essential for optimizing your recruitment funnel, investing in the most productive sourcing channels, and understanding which job types generate maximum return.
 Placement Pipeline
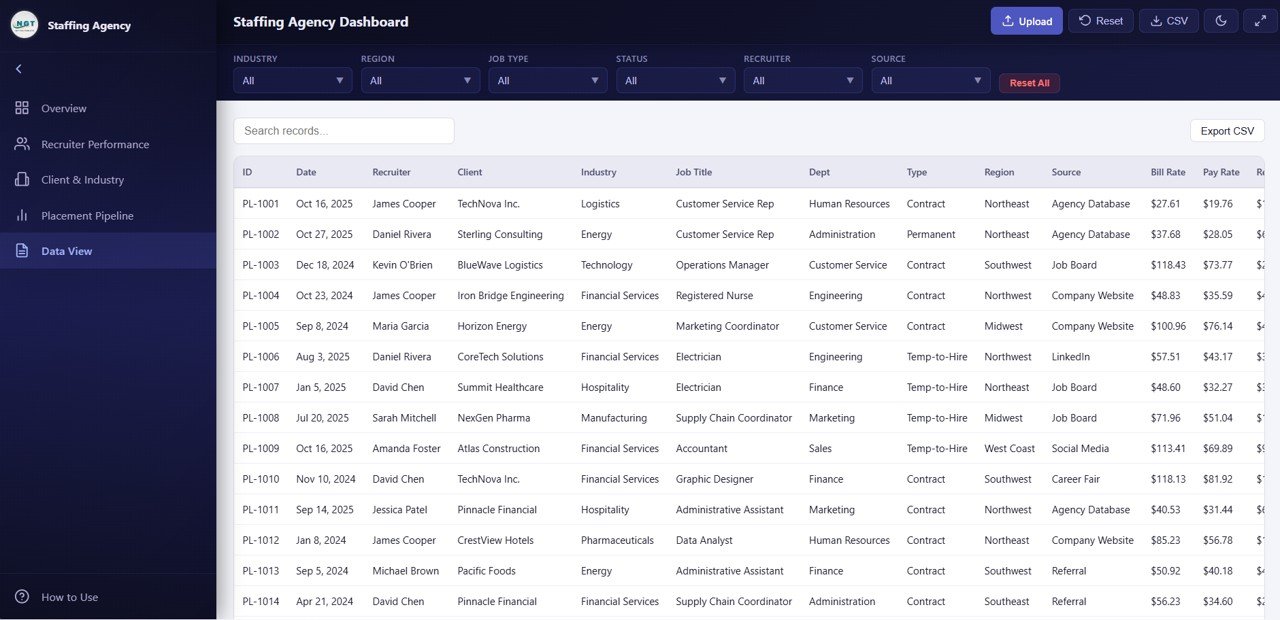
5. Data View
The Data View page provides complete transparency into every placement record in your dataset. This is a detailed data table with search, sort, and pagination features that let you quickly find specific records. You can also export the filtered data to CSV for further analysis in Excel, Google Sheets, or other tools.
For agencies that need to share raw data with clients, auditors, or internal teams, this page ensures every data point is accessible and exportable.
 Data View
Advantages of Staffing Agency Dashboard in HTML
- Zero Dependencies — No software installation, no database connections, no subscriptions. Just open the HTML file in your browser and start analyzing.
- Instant Insights — 6 KPI cards and 20+ charts update automatically when you modify the underlying data, giving you real-time visibility without manual report building.
- Comprehensive Coverage — From high-level revenue metrics to granular recruiter performance and pipeline analysis, every critical dimension of staffing operations is covered.
- Professional Presentation — The modern SaaS-style design makes it perfect for sharing with clients, investors, or internal leadership during review meetings.
- Full Data Portability — The CSV export feature ensures you can always extract and share data with stakeholders who prefer spreadsheets.
Opportunities for Improvement
- Adding a dedicated financial summary page with profit margin calculations and cost-per-hire metrics would enhance the financial analysis capabilities.
- Including a calendar or Gantt-style view for tracking placement timelines could help with project-based staffing operations.
- A comparison mode that lets you benchmark current period performance against previous quarters or years would add strategic depth.
- Email notification integration for KPI threshold alerts could make the dashboard more proactive for daily operations management.
Best Practices for Using This Dashboard
- Update Data Regularly — For the most accurate insights, refresh your placement data at least weekly. The more current your data, the more actionable your analytics.
- Use Slicers Strategically — Instead of looking at all data at once, use filters to focus on specific recruiters, time periods, or industries for targeted analysis.
- Share with Clients — The professional design makes this dashboard ideal for client reporting. Export key views as screenshots or share the HTML file directly.
- Track Trends Monthly — Use the Monthly Revenue Trend and Pipeline charts to identify seasonal patterns and plan staffing levels accordingly.
- Benchmark Recruiters — Use the Recruiter Performance page during team reviews to recognize top performers and identify coaching opportunities.
Explore Relevant Templates
- Recruitment Agencies Dashboard in Power BI — 5-page Power BI version with industry, region, and candidate source analysis
- Recruitment Agencies Dashboard in Excel — Excel version with pivot-based analysis and dynamic slicers
- Recruitment Agencies KPI Dashboard in Power BI — MTD and YTD KPI tracking with target vs actual comparison
- Recruitment Agencies KPI Dashboard in Excel — Excel-based KPI scorecard with trend analysis
- Executive Search & Staffing KPI Dashboard in Power BI — Advanced staffing analytics with drill-through definitions
Frequently Asked Questions
What is the Staffing Agency Dashboard in HTML?
The Staffing Agency Dashboard in HTML is a ready-to-use, browser-based analytics template designed for staffing and recruitment agencies. It includes 5 interactive dashboard pages, 6 KPI cards, over 20 dynamic charts, and a data table with CSV export — all running in any modern web browser without installation or software dependencies.
How do I use this HTML staffing dashboard?
Simply unzip the downloaded file and open the index.html file in Chrome, Edge, or Firefox. Replace the sample data in the included data file with your own staffing records, and the dashboard charts will update automatically when you refresh the page. No coding or technical skills are required.
What KPIs does this staffing agency dashboard track?
The dashboard tracks 6 primary KPIs: Total Placements, Total Revenue, Average Bill Rate, Average Satisfaction, Average Time to Fill, and Placement Rate. Additionally, it provides detailed analysis through charts covering revenue by industry, recruiter performance comparisons, client profitability, placement pipeline status, and monthly revenue trends.
Can I customize the data and charts in this dashboard?
Yes. The dashboard reads from an included data file where you can input your agency’s actual placement records including recruiter names, client companies, industries, bill rates, job types, candidate sources, and placement statuses. All charts and KPI cards update dynamically based on your data.
Is this template suitable for large staffing agencies?
Absolutely. The dashboard is designed to scale with your data volume. The Data View page includes pagination for handling large datasets, and the filtering system lets you drill into specific recruiters, industries, regions, or time periods regardless of how many records you have.
What makes this HTML dashboard better than Excel or Power BI alternatives?
The HTML version offers zero-dependency deployment — no Excel, no Power BI Desktop, no licenses needed. It runs instantly in any browser, can be shared as a single file, works offline, and has a modern SaaS-style interface. For agencies that want professional analytics without software overhead, this is the ideal solution.
Conclusion
The Staffing Agency Dashboard in HTML by NextGenTemplates is a complete analytics solution for modern staffing and recruitment agencies. With 5 interactive pages, 6 KPI cards, 20+ charts, recruiter performance tracking, client and industry analysis, pipeline monitoring, and full data export capability — all running in your browser with zero dependencies — this dashboard transforms raw placement data into actionable insights that drive growth, efficiency, and better hiring outcomes.
Click here to Purchase Staffing Agency Dashboard in HTML
Visit our YouTube channel for step-by-step tutorials: Youtube.com/@NeoTechNavigators
Click to buy Staffing Agency Dashboard in HTML