According to the Google Sheets documentation, conditional formatting and dropdown-driven filtering are among the most-used features for business reporting. The Climate Action KPI Scorecard in Google Sheets puts these features to work for sustainability teams — tracking climate KPIs across 4 purpose-built worksheets with MTD and YTD comparisons against targets and previous-year benchmarks. It includes conditional-formatting arrows for instant status checks, trend charts for every KPI, and built-in LTB/UTB logic.
👉 Click here to Purchase the Climate Action KPI Scorecard in Google Sheets
Whether you manage a corporate sustainability program, run an environmental NGO, or oversee facility-level emissions compliance, this scorecard converts raw climate data into clear monthly performance reports inside Google Sheets — no SaaS subscription, no add-ons, no coding.
Key Features of the Climate Action KPI Scorecard in Google Sheets
👉 Click here to Purchase the Climate Action KPI Scorecard in Google Sheets
The Climate Action KPI Scorecard in Google Sheets includes 4 integrated worksheets designed for end-to-end climate KPI tracking. Here are the features that make it useful for sustainability teams:
- 4-sheet scorecard architecture — A main Scorecard sheet, KPI Trend sheet with combo charts, Input Data sheet for actual/target/previous year numbers, and KPI Definition reference sheet driving all calculations.
- MTD and YTD comparison engine — Every climate KPI shows Actual vs Target and Actual vs Previous Year for both month-to-date and year-to-date periods.
- Conditional formatting status arrows — Green ▲ and red ▼ arrows flag whether performance beats or misses target. The dashboard applies LTB or UTB logic per KPI type.
- Interactive KPI trend charts — Select any KPI from a dropdown and see 12-month MTD and YTD line charts for Actual, Target, and Previous Year.
- Structured KPI definitions — Each metric stores its Group, Unit, Formula, Definition, and Type so every stakeholder interprets numbers identically.
Scorecard Sheets Explanation
1. Scorecard Sheet
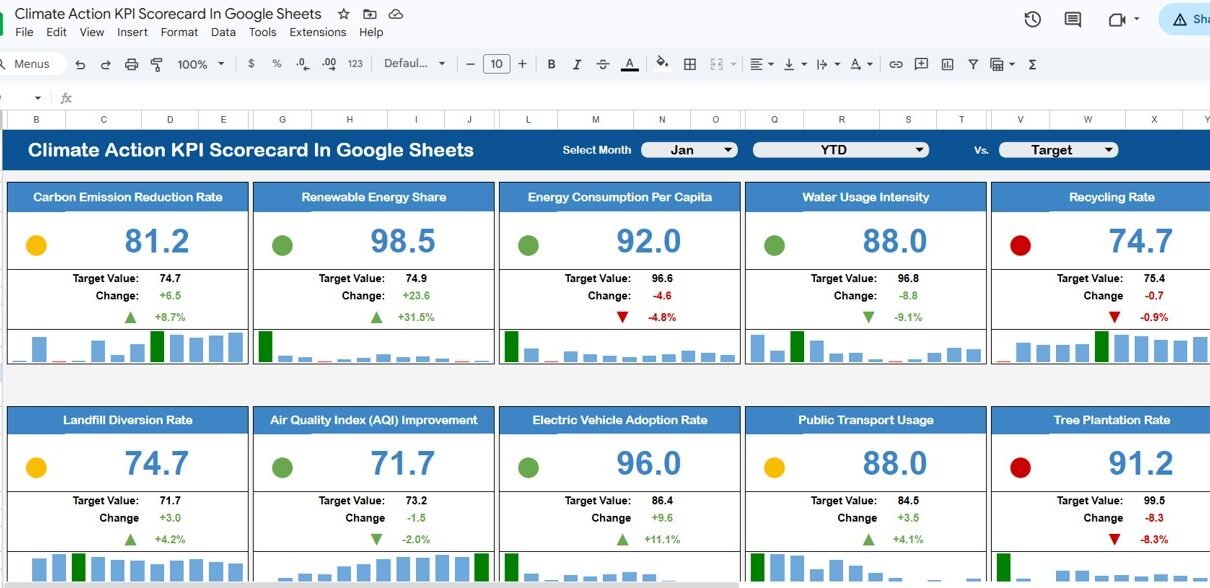
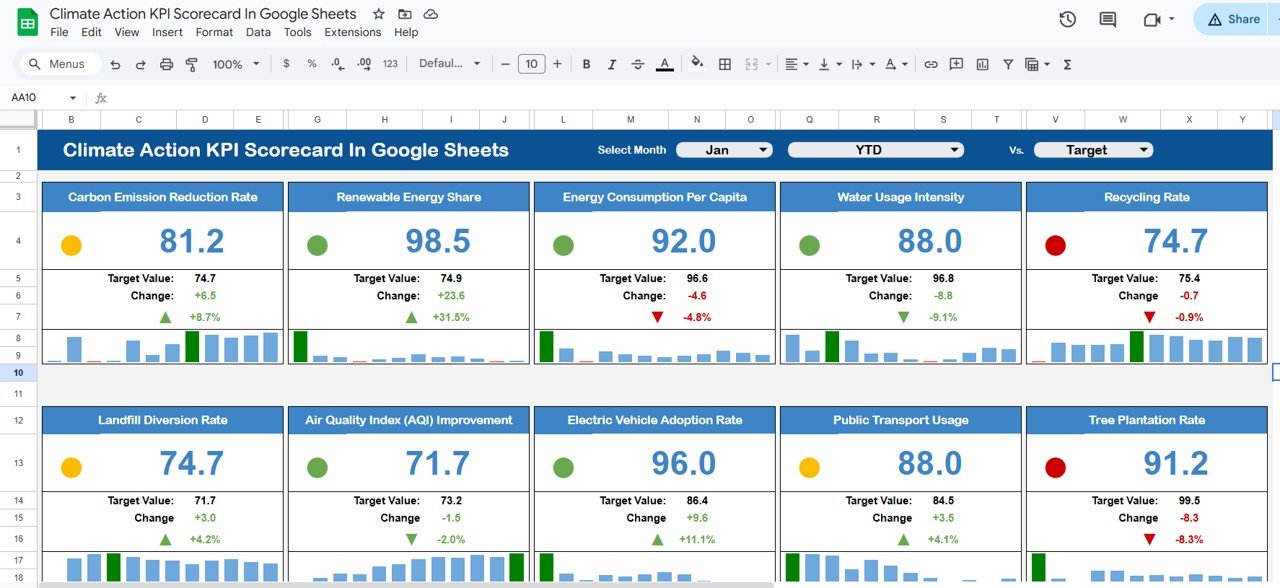
The Scorecard sheet is the main interface where you view KPI performance. Select the month, MTD (Month-to-Date), or YTD (Year-to-Date) using dropdown menus for performance analysis. Compare actual performance against targets for each KPI, and quickly see performance status using color-coded visuals and conditional formatting. The scorecard displays all relevant information about KPIs, including MTD and YTD comparisons.
Climate Action KPI Scorecard in Google Sheets
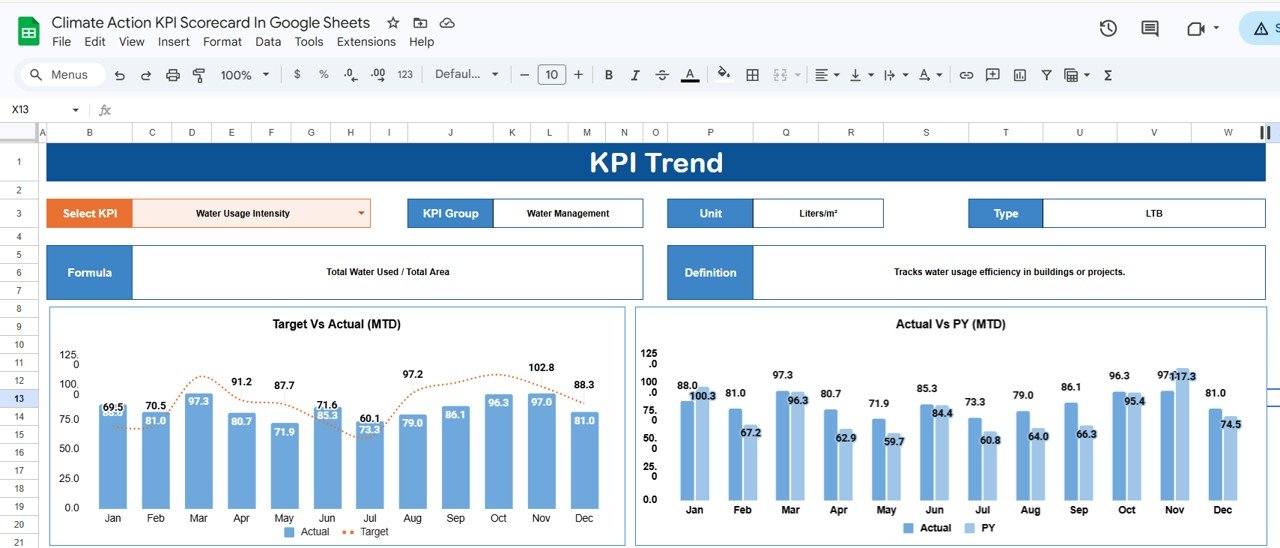
2. KPI Trend Sheet
Here you can select the KPI name from the dropdown available on range C3. The sheet displays the KPI Group, Unit of KPI, Type of KPI (Lower the Better or Upper the Better), Formula of the KPI, and Definition of the KPI. MTD and YTD trend charts show the Actual, Target, and Previous Year numbers across all 12 months.
KPI Trend Sheet
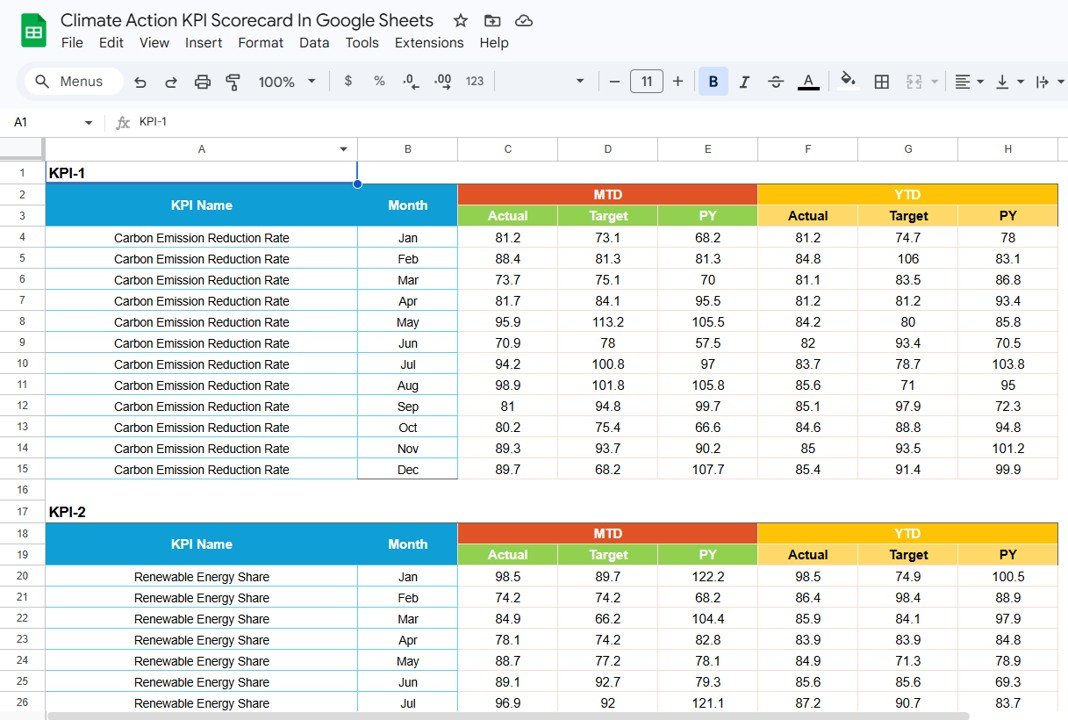
3. Input Data Sheet
The Input Data sheet is where you enter all KPI data. Record actual values, targets, and other metrics for each KPI. Easily update data as new results become available, ensuring the scorecard remains current.
Input Data Sheet
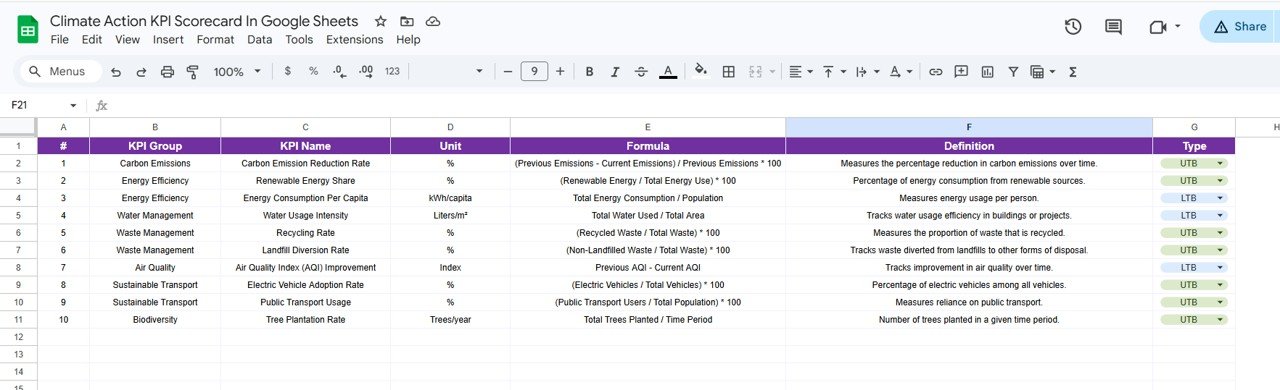
4. KPI Definition Sheet
In this sheet tab, you enter the KPI Name, KPI Group, Unit, Formula, and KPI Definition. This provides a single source of truth for what each metric means, how it is calculated, and whether lower or higher values are better.
KPI Definition Sheet
Climate Action KPI Scorecard vs. Microsoft Excel Scorecard vs. Paid ESG SaaS — Feature Comparison
| Feature | Climate Action KPI Scorecard (Google Sheets) | Microsoft Excel KPI Scorecard | Paid ESG SaaS (Watershed / Persefoni / Sphera) |
|---|---|---|---|
| Cost | $8.99 one-time ✅ | $12.99–$16.99 one-time | $500–$2,000 / month |
| Platform | Google Sheets (browser-based) ✅ | Microsoft Excel (desktop) | Cloud SaaS |
| Setup Time | Under 10 minutes ✅ | Under 10 minutes | 4–12 weeks onboarding |
| Real-Time Collaboration | ✅ Built-in | Limited | ✅ Yes |
| Mobile Access | ✅ Google Sheets app | Limited | ✅ Yes |
| Customizable KPIs | ✅ Add/edit any climate KPI | ✅ Manual formulas | Vendor-controlled |
| LTB / UTB Logic | ✅ Built-in per KPI | Manual IF formulas | ✅ Configurable |
| Year-1 Cost at 5 Users | $8.99 total ✅ | $12.99 + 5× licenses | $6,000–$24,000 |
| Share with Link | ✅ One-click share | ❌ Email attachment | ✅ Yes |
For sustainability teams that want climate KPI tracking without paying $6,000+ per year for ESG SaaS, the Climate Action KPI Scorecard in Google Sheets sits in the sweet spot.
Who Should Use This Template
👉 Click here to Purchase the Climate Action KPI Scorecard in Google Sheets
Perfect for:
- Sustainability managers at 10–500 person companies tracking carbon emissions, energy consumption, and waste reduction KPIs monthly
- ESG reporting leads preparing quarterly climate performance reports for stakeholders and investors
- NGOs and non-profits monitoring climate action program outcomes against annual targets
- Facility and operations managers tracking environmental compliance metrics across multiple sites
- Consultants delivering monthly climate performance scorecards to corporate clients
Not a fit if:
- You need SOC 2 compliance, automated data ingestion from IoT sensors, or GHG Protocol Scope 3 calculation engines
- Your organization requires regulatory-grade audit trails for CSRD or SEC climate reporting
- You need automated carbon accounting that pulls utility bills and invoices automatically
Real-World Use Cases
Arjun is a sustainability lead at a 200-person manufacturing company in Chennai. He uses the Climate Action KPI Scorecard in Google Sheets to track 12 climate KPIs including carbon intensity, energy consumption per unit, water usage, and waste diversion rate. The MTD vs Target comparison lets him flag underperforming metrics at weekly ESG standups — without paying $12,000/year for Watershed.
Maria runs environmental programs at a 60-person NGO in São Paulo. She tracks grant-funded climate targets across 8 KPIs using the scorecard and shares view-only links with funders. The KPI Trend sheet lets her show 12-month improvement trajectories during annual reporting — the visual proof donors need to approve next year’s funding.
Henrik is a facility manager at a logistics company in Stockholm. He uses the scorecard to compare energy and emissions metrics across 3 warehouse sites by creating separate copies for each location. The LTB/UTB logic means lower energy consumption per pallet correctly shows green arrows — something his previous Excel tracker got wrong for months.
Advantages of Climate Action KPI Scorecard in Google Sheets
👉 Click here to Purchase the Climate Action KPI Scorecard in Google Sheets
- Zero-cost platform — Google Sheets runs in any free Google account, so the $8.99 template price is the only cost. No Excel license needed.
- Real-time sharing — Share view-only or edit links with team members, leadership, or external auditors in one click. Everyone sees the same live data.
- Mobile-ready — Review climate KPIs from the Google Sheets app during site visits, board meetings, or field inspections.
- LTB/UTB automation — The scorecard automatically flips conditional formatting arrows based on whether a metric is Lower-the-Better (e.g., carbon emissions) or Upper-the-Better (e.g., renewable energy %). No manual formula edits.
- 12-month trend visibility — The KPI Trend sheet shows Actual, Target, and Previous Year on one chart per metric — useful for quarterly board reporting and grant progress reviews.
Opportunities for Improvement
- The scorecard does not include automated data ingestion — you need to enter or paste KPI values manually each month.
- Google Sheets has a practical limit of around 5–10 million cells. For organizations tracking 100+ KPIs across dozens of facilities, a database-backed tool would be more appropriate.
- There is no built-in GHG Protocol Scope 1/2/3 calculation engine — the scorecard tracks the final KPI numbers, not the underlying emissions calculations.
- Google Sheets edit history is not sufficient for regulatory audit trails required by CSRD, SEC climate rules, or TCFD reporting.
Best Practices
- Define all KPIs in the KPI Definition sheet before entering data — this ensures consistent naming and unit conventions across monthly updates.
- Set LTB/UTB type carefully for each metric so conditional formatting arrows display correctly (e.g., carbon emissions = LTB, renewable energy % = UTB).
- Update the Input Data sheet on the same day each month to maintain a clean 12-month trend line.
- Use the Google Sheets “Protected ranges” feature to lock the Scorecard and KPI Trend sheets from accidental edits by view-only users.
- Create separate copies for different business units or facilities if you need site-level tracking alongside a consolidated view.
Explore Relevant Templates
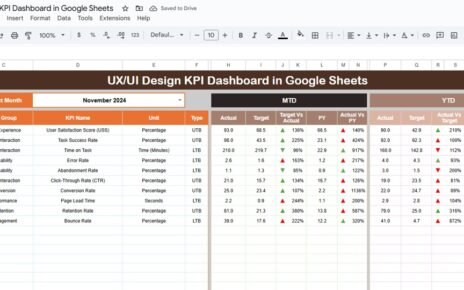
📌 Credit Card KPI Dashboard in Google Sheets – Same MTD/YTD comparison structure applied to financial metrics.
📌 Product Feedback and NPS Dashboard in Google Sheets – 7-page slicer-driven dashboard for customer feedback and NPS analysis.
📌 Fitness Performance and Revenue Dashboard in Google Sheets – Multi-page dashboard with KPI cards and slicer filtering.
📌 Browse all Google Sheets KPI Dashboard Templates on NextGenTemplates.
Frequently Asked Questions
👉 Click here to Purchase the Climate Action KPI Scorecard in Google Sheets
What KPIs does the Climate Action KPI Scorecard in Google Sheets track?
The Climate Action KPI Scorecard in Google Sheets tracks any climate-related KPIs you define — carbon emissions, energy consumption, water usage, waste diversion rate, renewable energy percentage, and more. Configure them in the KPI Definition sheet with group, unit, formula, and LTB/UTB type.
How long does setup take?
Setup of the Climate Action KPI Scorecard takes under 10 minutes. Open the Google Sheets copy link, enter KPI definitions, paste your actual and target numbers, and every sheet updates automatically. No formulas or coding needed.
Can I add more climate KPIs beyond what’s included?
Yes. Add new rows in the KPI Definition sheet and corresponding rows in the Input Data sheet. The Climate Action KPI Scorecard in Google Sheets picks up new KPIs automatically without any structural changes needed.
How does this compare to paid ESG platforms like Watershed or Persefoni?
ESG SaaS platforms typically cost $500 to $2,000 per month with 4 to 12 weeks of onboarding. The Climate Action KPI Scorecard in Google Sheets is $8.99 one-time with no recurring fees and full ownership of your data. It lacks automated carbon accounting but delivers the same monthly KPI tracking most teams need.
Does this work on mobile devices?
Yes. The Climate Action KPI Scorecard works on any device that runs Google Sheets — desktop browsers, tablets, and phones via the Google Sheets app. Multiple users can view and edit simultaneously.
Can I customize the conditional formatting thresholds?
Yes. Edit the arrow symbols, colors, and thresholds using standard Google Sheets conditional formatting settings. The LTB/UTB logic in the KPI Definition sheet controls which direction is considered a positive result for each metric.
Is the Climate Action KPI Scorecard a one-time purchase?
Yes. The Climate Action KPI Scorecard in Google Sheets is $8.99 one-time, instant download, no subscription, no per-user fees, and lifetime access. Free updates are included whenever the template is revised.
About the Author
Built by PK — Microsoft Certified Professional with 15+ years of Excel, Google Sheets, and Power BI experience. Founder of NextGenTemplates, reaching 300K+ subscribers across YouTube channels. Every template is hand-built and tested before release.
Conclusion
The Climate Action KPI Scorecard in Google Sheets gives sustainability managers, ESG leads, NGOs, and facility teams a 4-sheet, MTD/YTD-ready scorecard that tracks any climate metric with conditional formatting, trend charts, and LTB/UTB logic — all inside a free Google Sheets account.
👉 Click here to Purchase the Climate Action KPI Scorecard in Google Sheets
✅ Instant download · One-time payment · No subscription
🎥 Visit our YouTube channel for step-by-step tutorials: Youtube.com/@NeoTechNavigators