Compliance Tracking Dashboard in HTML is a powerful, interactive, and ready-to-use analytics solution designed for compliance officers, risk managers, legal teams, operations managers, and quality assurance professionals who need to monitor compliance tasks, track estimated costs, analyze departmental compliance rates, and evaluate timeline trends from a single centralized web-based interface. Compliance Tracking Dashboard in HTML This dashboard template includes 5 interactive analytical pages and a comprehensive data view — giving you complete visibility into your compliance operations at a glance.
If you are managing compliance tasks using scattered spreadsheets, email threads, or manual reports, this Compliance Tracking Dashboard in HTML transforms your workflow completely by delivering real-time visual insights through a modern browser-based interface. The dashboard tracks 5 key metrics including Total Tasks, Compliance Rate, Total Estimated Cost, Non-Compliant, and Avg Time Spent (hrs) across departments, compliance areas, responsible persons, and monthly timelines. Whether you are a compliance officer monitoring regulatory adherence or a risk manager tracking audit readiness, this HTML Dashboard Template delivers the insights you need instantly.
Click here to Purchase Compliance Tracking Dashboard in HTML
Key Features of Compliance Tracking Dashboard in HTML
The Compliance Tracking Dashboard in HTML is packed with features that make compliance management effortless and insightful. Here are the standout capabilities that set this template apart from generic spreadsheet solutions:
- 5 Interactive Dashboard Pages + Data View — Overview, Department Analysis, Compliance Areas, Timeline Analysis, and Data View deliver 360-degree visibility into compliance task management, cost tracking, and performance monitoring.
- 5 High-Level KPI Cards on Overview — Total Tasks, Compliance Rate, Total Estimated Cost, Non-Compliant, and Avg Time Spent (hrs) provide an executive-level summary of your compliance health instantly.
- Multiple Slicers for Quick Filtering — Apply dynamic filters across the entire dashboard to quickly drill down into specific departments, compliance areas, responsible persons, or time periods.
- Department Analysis Module — Dedicated page analyzes Compliance Rate by Department, Estimated Cost by Department, Status Breakdown by Department, Avg Time Spent by Department, and Compliance Type by Department.
- Compliance Areas Breakdown — Track Tasks by Compliance Area, Compliance Rate by Area, Tasks by Compliance Type, Estimated Cost by Compliance Type, and Time Spent by Compliance Area.
- Timeline Analysis — Visualize Monthly Estimated Cost, Monthly Time Spent, Monthly Status Breakdown, Avg Days Overdue by Month, and Tasks by Responsible Person per Month.
- Data Explorer with Search and Export — Access a detailed data table with search functionality, sortable columns, pagination, and CSV export.
- 100% Client-Side Privacy — All data processing happens locally in your browser with no server dependency.
Dashboard Pages Explained
1 — Overview Page
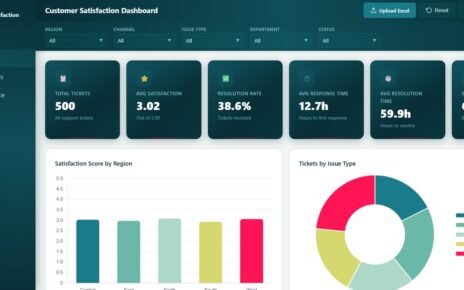
The Overview Page serves as the command center for your compliance operations. It displays 5 KPI cards at the top — Total Tasks, Compliance Rate, Total Estimated Cost, Non-Compliant, and Avg Time Spent (hrs) — providing an instant executive summary. Below the cards, you will find charts showing Compliance Status Distribution which analyzes the breakdown of compliant vs non-compliant tasks, Tasks by Department revealing which departments carry the highest compliance workload, Estimated Cost by Compliance Area showing cost distribution across regulatory domains, Tasks by Responsible Person tracking individual workload distribution, and Monthly Task Distribution revealing seasonal patterns in compliance activity. Multiple slicers on this page allow instant filtering across all dashboard dimensions.
2 — Department Analysis
The Department Analysis page provides a deep-dive into department-level compliance performance. Charts on this page include Compliance Rate by Department to compare adherence levels across organizational units, Estimated Cost by Department to track which departments incur the highest compliance expenses, Status Breakdown by Department showing the distribution of task statuses within each department, Avg Time Spent by Department revealing efficiency differences between teams, and Compliance Type by Department to understand which types of compliance tasks dominate each department. This page is essential for HR leaders and department heads looking to benchmark performance and identify areas needing improvement.
3 — Compliance Areas
The Compliance Areas page breaks down your compliance performance by regulatory domain and compliance type. This page includes charts for Tasks by Compliance Area showing which regulatory areas generate the most tasks, Compliance Rate by Area comparing success rates across different compliance domains, Tasks by Compliance Type categorizing tasks by their nature, Estimated Cost by Compliance Type tracking financial impact across compliance categories, and Time Spent by Compliance Area revealing which domains require the most effort. This analysis is invaluable for compliance officers who need to prioritize resources across multiple regulatory frameworks.
4 — Timeline Analysis
The Timeline Analysis page tracks temporal patterns and trends across your compliance operations. Charts include Monthly Estimated Cost showing how compliance spending evolves over time, Monthly Time Spent (hrs) tracking effort allocation patterns, Monthly Status Breakdown revealing how task completion rates change month to month, Avg Days Overdue by Month highlighting months with the highest overdue tasks, and Tasks by Responsible Person per Month showing individual workload distribution over time. This page is critical for capacity planning and identifying seasonal compliance bottlenecks.
5 — Data View
The Data View page provides a detailed data table where you can see all compliance records with search, sort, and pagination features. This page acts as your compliance record explorer, allowing you to quickly find specific tasks, filter by any column, and export the filtered data to CSV for further analysis in Excel, Google Sheets, or any other tool. Perfect for audit preparation and detailed compliance reporting.
Advantages of Compliance Tracking Dashboard in HTML
This dashboard provides several key advantages over traditional compliance tracking methods. First, it consolidates all compliance metrics into a single interactive interface, eliminating the need to maintain multiple spreadsheets or reports. Second, the browser-based design means zero installation — simply open the HTML file and start analyzing. Third, the 100% client-side architecture ensures your sensitive compliance data never leaves your machine. Fourth, the interactive slicers and filters allow you to perform ad-hoc analysis without any technical skills. Finally, the CSV export capability on the Data View page makes it easy to share filtered compliance data with auditors, management, or external regulators.
Opportunities for Improvement
While this dashboard covers comprehensive compliance tracking, organizations with very large datasets exceeding thousands of records may want to consider connecting it to a backend database for better performance. Additionally, teams that require automated email alerts for overdue compliance tasks would need to implement a server-side notification system separately. For organizations needing multi-user real-time collaboration, pairing this dashboard with a shared data storage solution like Google Sheets or a database backend could enhance the workflow further.
Best Practices for Using This Dashboard
To get the most out of the Compliance Tracking Dashboard in HTML, keep your data consistent by using standardized department names, compliance area labels, and status values across all records. Update the data file regularly — ideally weekly or monthly — to ensure the dashboard reflects the latest compliance status. Use the Overview page slicers to create focused views for different stakeholders, such as filtering by a specific department for departmental reviews or by compliance area for regulatory audits. Leverage the Data View export feature to create periodic compliance reports for management and audit teams. Finally, bookmark the Timeline Analysis page for quarterly trend reviews to spot emerging compliance risks early.
Explore Relevant Templates
If you found this compliance dashboard useful, you might also be interested in these related templates from NextGenTemplates:
- IT Services Dashboard in HTML — Track IT service requests, SLA compliance, team performance, and service trends with interactive browser-based analytics.
- Security Dashboard in Google Sheets — Monitor security incidents, threats, compliance frameworks, and response analytics in Google Sheets.
- IT SLA Compliance and Ticket Monitoring Dashboard in Google Sheets — Track IT ticket SLA compliance, response times, and agent performance in Google Sheets.
Browse all HTML Dashboard Templates on NextGenTemplates.
Frequently Asked Questions
What KPIs does the Compliance Tracking Dashboard in HTML track?
The Compliance Tracking Dashboard in HTML tracks 5 key performance indicators including Total Tasks, Compliance Rate, Total Estimated Cost, Non-Compliant, and Avg Time Spent (hrs). Additional analysis across 5 interactive pages covers compliance status distribution, department-level compliance rates, compliance area breakdowns, timeline trends, and detailed data exploration with export capabilities.
Do I need any technical skills to use this HTML dashboard?
No. Simply unzip the file, open index.html in any modern web browser like Chrome, Firefox, or Edge, and start analyzing. No coding, database, or server setup is required. Replace sample data with your own and all charts update automatically.
Can I filter the dashboard by department or compliance area?
Yes. The dashboard includes multiple interactive slicers that let you filter all pages simultaneously by Department, Compliance Area, Responsible Person, Status, and time period for instant drill-down analysis.
Is my compliance data secure with this dashboard?
Absolutely. This dashboard runs 100% client-side in your browser. No data is sent to any server, cloud, or third party. Your compliance records remain completely private on your local machine.
Can I export data from this dashboard?
Yes. The Data View page includes a built-in CSV export feature that allows you to download filtered compliance records for further analysis in Excel, Google Sheets, or any other tool.
What is the best HTML dashboard template for compliance tracking?
The Compliance Tracking Dashboard in HTML from NextGenTemplates is one of the best options available. It includes 5 interactive pages covering overview, department analysis, compliance areas, timeline analysis, and detailed data view with search, sort, and CSV export capabilities.
Conclusion
The Compliance Tracking Dashboard in HTML is an essential tool for any organization serious about maintaining regulatory compliance, tracking task completion, and monitoring compliance costs across departments. With 5 interactive dashboard pages, 5 KPI cards, department-level analysis, compliance area breakdowns, timeline trend monitoring, and a full-featured data explorer with CSV export, this template provides everything you need to transform compliance management from a reactive process into a proactive, data-driven strategy. Purchase the Compliance Tracking Dashboard in HTML today and take control of your compliance operations.
Visit our YouTube channel for step-by-step tutorials: Youtube.com/@NeoTechNavigators