Tracking performance and engagement on an e-learning platform is critical to measure the effectiveness of courses, instructors, and learner engagement. A KPI dashboard consolidates all essential metrics into a single, interactive view, allowing course managers, administrators, and learning strategists to make data-driven decisions.E-learning Platform KPI Dashboard in Google Sheets
Our E-learning Platform KPI Dashboard in Google Sheets is a ready-to-use template that provides comprehensive insights into your e-learning operations.E-learning Platform KPI Dashboard in Google Sheets
What is an E-learning Platform E-learning Platform KPI Dashboard in Google Sheets?
An E-learning Platform KPI Dashboard is a digital tool that tracks and visualizes key performance indicators (KPIs) for an online learning environment. It allows organizations to:
-
Monitor Learning Metrics: Track course completions, active users, engagement rates, and assessments.
-
Measure Progress: Compare MTD (Month-to-Date) and YTD (Year-to-Date) performance against targets and previous year results.
-
Identify Trends: Analyze learner behavior and course effectiveness over time.
-
Optimize Strategy: Make informed decisions to improve learner engagement, content quality, and platform performance.
Using Google Sheets ensures the dashboard is cloud-based, shareable, and easily accessible, making it perfect for collaborative use among instructors, coordinators, and administrators.E-learning Platform KPI Dashboard in Google Sheets
Key Features of the Dashboard
Click to Buy E-learning Platform KPI Dashboard in Google Sheets
This template includes 6 worksheets, each designed to provide detailed insights and easy management of e-learning KPIs:
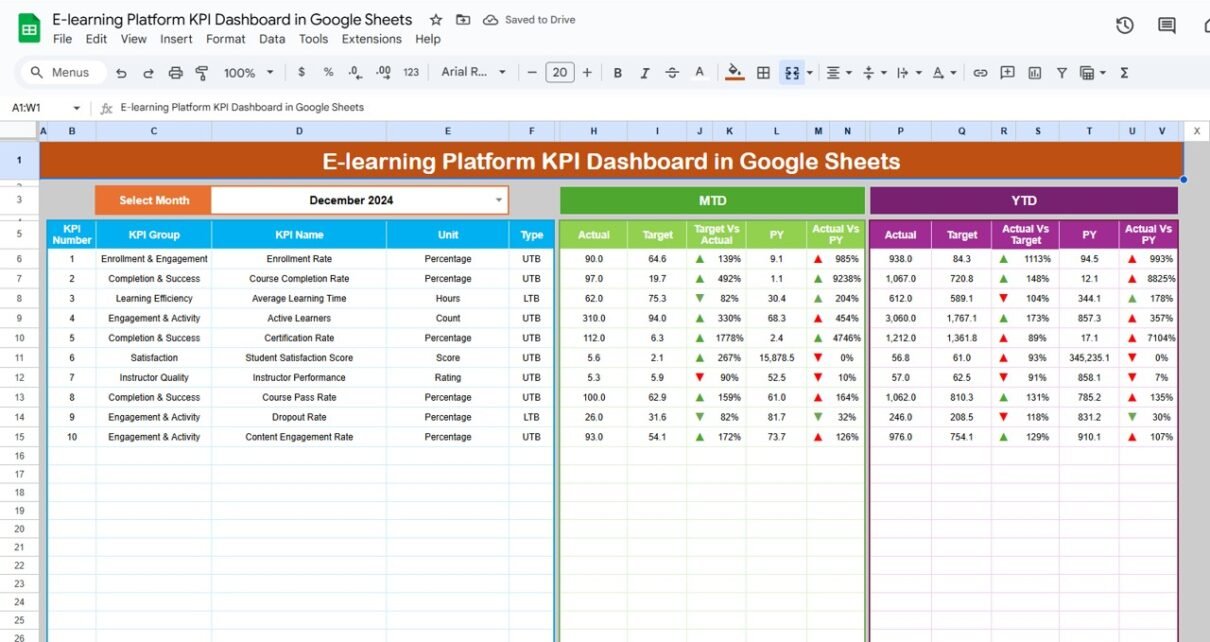
1. Dashboard Sheet Tab
The Dashboard sheet is the main interface for viewing all KPI metrics.
Features include:
-
Month Selection: Use the drop-down at range D3 to change the month; all MTD and YTD numbers update automatically.
-
Performance Cards: Display MTD Actual, Target, Previous Year, Target vs Actual, and PY vs Actual.
-
Conditional Formatting: Up/down arrows indicate performance against targets.
-
YTD Metrics: Track cumulative performance with the same conditional formatting.
This sheet provides a high-level view of your platform performance and is ideal for management reporting.

Click to Buy E-learning Platform KPI Dashboard in Google Sheets
2. KPI Trend Sheet Tab
The KPI Trend sheet allows detailed analysis of each KPI:
-
Select KPI from the drop-down at range C3.
-
View KPI Group, Unit, Type (Lower the Better or Upper the Better).
-
See the formula and definition of each KPI.
-
Analyze trends to identify areas needing improvement or optimization.

3. Actual Numbers Sheet Tab
Here, you enter the actual performance numbers for MTD and YTD:
-
Update the first month of the year at range E1.
-
Enter monthly actuals for all KPIs.
-
The dashboard automatically reflects updated data.
This sheet ensures accurate and timely reporting of actual platform performance.

Click to Buy E-learning Platform KPI Dashboard in Google Sheets
4. Target Sheet Tab
Enter your MTD and YTD target numbers for each KPI:
-
Set monthly targets for each KPI to monitor performance against goals.
-
Easily adjust targets if strategy changes.
This helps in tracking progress and identifying performance gaps.

5. Previous Year Numbers Sheet Tab
Enter previous year metrics for comparison:
-
Helps in year-over-year performance analysis.
-
Track improvements or declines in key e-learning KPIs.

Click to Buy E-learning Platform KPI Dashboard in Google Sheets
6. KPI Definition Sheet Tab
Define and document all KPI details:
-
Include KPI Name, KPI Group, Unit, Formula, and Definition.
-
Specify whether a KPI is Lower the Better (LTB) or Upper the Better (UTB).
-
Ensures consistency and clarity in KPI measurement and reporting.

Benefits of Using this Dashboard
Click to Buy E-learning Platform KPI Dashboard in Google Sheets
-
Centralized Monitoring: View all key e-learning KPIs in one place.
-
Data-Driven Decisions: Quickly identify areas for improvement.
-
Trend Analysis: Track monthly and yearly performance.
-
Goal Tracking: Compare actuals with targets and previous year results.
-
Collaboration Ready: Share with instructors and coordinators for real-time insights.
Opportunities for Improvement
-
Integration with LMS: Pull data automatically from Learning Management Systems.
-
Advanced Charts: Include heatmaps, progress trend lines, or learner engagement curves.
-
Alerts & Notifications: Highlight underperforming KPIs automatically.
-
Custom Metrics: Add course-specific KPIs like completion rate by module or assessment scores.
Best Practices
Click to Buy E-learning Platform KPI Dashboard in Google Sheets
-
Update Monthly: Ensure actual numbers are entered regularly for accurate tracking.
-
Maintain KPI Definitions: Keep formulas and definitions consistent to avoid discrepancies.
-
Set Realistic Targets: Use historical data to set achievable monthly and annual targets.
-
Use Conditional Formatting: Quickly identify KPIs performing above or below expectations.
-
Share Dashboard Access: Collaborate with instructors and coordinators for better decision-making.
Conclusion
The E-learning Platform KPI Dashboard in Google Sheets is a comprehensive, ready-to-use solution for monitoring online learning performance. By using this template, organizations can:
-
Track learner engagement, course completions, and platform metrics
-
Compare current performance with targets and previous year
-
Identify trends and optimize course delivery
-
Improve overall e-learning effectiveness and learner satisfaction
Visit our YouTube channel to learn step-by-step video tutorials
Youtube.com/@NeotechNavigators
Watch the step-by-step video Demo:
Click to Buy E-learning Platform KPI Dashboard in Google Sheets