Tracking performance and engagement on an e-learning platform is critical to measure the effectiveness of courses, instructors, and learner engagement. A KPI dashboard consolidates all essential metrics into a single, interactive view, allowing course managers, administrators, and learning strategists to make data-driven decisions.E-learning Platform KPI Dashboard in Google Sheets
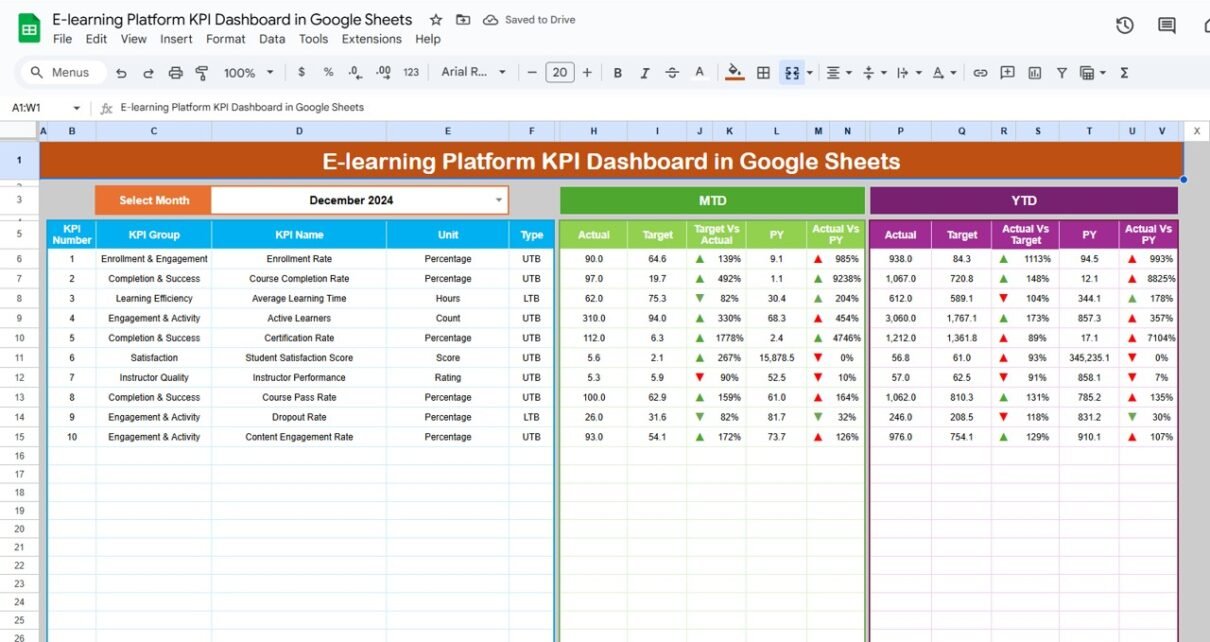
Our E-learning Platform KPI Dashboard in Google Sheets is a ready-to-use template that provides comprehensive insights into your e-learning operations.E-learning Platform KPI Dashboard in Google Sheets
Get the E-learning Platform KPI Dashboard in Google Sheets
What is an E-learning Platform E-learning Platform KPI Dashboard in Google Sheets?
An E-learning Platform KPI Dashboard is a digital tool that tracks and visualizes key performance indicators (KPIs) for an online learning environment. It allows organizations to:
-
Monitor Learning Metrics: Track course completions, active users, engagement rates, and assessments.
-
Measure Progress: Compare MTD (Month-to-Date) and YTD (Year-to-Date) performance against targets and previous year results.
-
Identify Trends: Analyze learner behavior and course effectiveness over time.
-
Optimize Strategy: Make informed decisions to improve learner engagement, content quality, and platform performance.
Using Google Sheets ensures the dashboard is cloud-based, shareable, and easily accessible, making it perfect for collaborative use among instructors, coordinators, and administrators.E-learning Platform KPI Dashboard in Google Sheets
Key Features of the Dashboard
This template includes 6 worksheets, each designed to provide detailed insights and easy management of e-learning KPIs:
1. Dashboard Sheet Tab
The Dashboard sheet is the main interface for viewing all KPI metrics.
Features include:
-
Month Selection: Use the drop-down at range D3 to change the month; all MTD and YTD numbers update automatically.
-
Performance Cards: Display MTD Actual, Target, Previous Year, Target vs Actual, and PY vs Actual.
-
Conditional Formatting: Up/down arrows indicate performance against targets.
-
YTD Metrics: Track cumulative performance with the same conditional formatting.
This sheet provides a high-level view of your platform performance and is ideal for management reporting.

2. KPI Trend Sheet Tab
The KPI Trend sheet allows detailed analysis of each KPI:
-
Select KPI from the drop-down at range C3.
-
View KPI Group, Unit, Type (Lower the Better or Upper the Better).
-
See the formula and definition of each KPI.
-
Analyze trends to identify areas needing improvement or optimization.

3. Actual Numbers Sheet Tab
Here, you enter the actual performance numbers for MTD and YTD:
-
Update the first month of the year at range E1.
-
Enter monthly actuals for all KPIs.
-
The dashboard automatically reflects updated data.
This sheet ensures accurate and timely reporting of actual platform performance.

4. Target Sheet Tab
Enter your MTD and YTD target numbers for each KPI:
-
Set monthly targets for each KPI to monitor performance against goals.
-
Easily adjust targets if strategy changes.
This helps in tracking progress and identifying performance gaps.

5. Previous Year Numbers Sheet Tab
Enter previous year metrics for comparison:
-
Helps in year-over-year performance analysis.
-
Track improvements or declines in key e-learning KPIs.

6. KPI Definition Sheet Tab
Define and document all KPI details:
-
Include KPI Name, KPI Group, Unit, Formula, and Definition.
-
Specify whether a KPI is Lower the Better (LTB) or Upper the Better (UTB).
-
Ensures consistency and clarity in KPI measurement and reporting.

Benefits of Using this Dashboard
-
Centralized Monitoring: View all key e-learning KPIs in one place.
-
Data-Driven Decisions: Quickly identify areas for improvement.
-
Trend Analysis: Track monthly and yearly performance.
-
Goal Tracking: Compare actuals with targets and previous year results.
-
Collaboration Ready: Share with instructors and coordinators for real-time insights.
Opportunities for Improvement
-
Integration with LMS: Pull data automatically from Learning Management Systems.
-
Advanced Charts: Include heatmaps, progress trend lines, or learner engagement curves.
-
Alerts & Notifications: Highlight underperforming KPIs automatically.
-
Custom Metrics: Add course-specific KPIs like completion rate by module or assessment scores.
Best Practices
-
Update Monthly: Ensure actual numbers are entered regularly for accurate tracking.
-
Maintain KPI Definitions: Keep formulas and definitions consistent to avoid discrepancies.
-
Set Realistic Targets: Use historical data to set achievable monthly and annual targets.
-
Use Conditional Formatting: Quickly identify KPIs performing above or below expectations.
-
Share Dashboard Access: Collaborate with instructors and coordinators for better decision-making.
Get the E-learning Platform KPI Dashboard in Google Sheets
Conclusion
The E-learning Platform KPI Dashboard in Google Sheets is a comprehensive, ready-to-use solution for monitoring online learning performance. By using this template, organizations can:
-
Track learner engagement, course completions, and platform metrics
-
Compare current performance with targets and previous year
-
Identify trends and optimize course delivery
-
Improve overall e-learning effectiveness and learner satisfaction
If you would like to learn how dashboards like this are built, the Excel Pivot Tables & Dashboards course on NextGenTemplates Academy walks through it with practice files.