Etsy Seller Analytics Dashboard in HTML is a powerful, browser-based interactive analytics template designed for Etsy shop owners, e-commerce sellers, and digital product creators who need a comprehensive view of their shop performance without installing any software. This ready-to-use HTML dashboard covers 5 interactive pages — Overview, Sales Analysis, Traffic and Engagement, Cost and Profitability, and Data View — giving you instant visibility into every aspect of your Etsy business from revenue and orders to traffic sources and profit margins.Etsy Seller Analytics Dashboard in HTML
Whether you run a small handmade shop or a large-scale vintage store on Etsy, tracking your sales performance, understanding traffic patterns, and monitoring costs is critical for sustainable growth. This Etsy Seller Analytics Dashboard in HTML provides all the analytics you need in a single browser window — no Excel, no Power BI, no installations. Just open the file and start analyzing. You can also explore the Etsy Seller Analytics Dashboard in Power BI or Etsy Seller Analytics Dashboard in Excel if you prefer working in those platforms.Etsy Seller Analytics Dashboard in HTML
Click to buy Etsy Seller Analytics Dashboard in HTML
Key Features of Etsy Seller Analytics Dashboard in HTML
This Etsy Seller Analytics Dashboard in HTML includes 5 interactive dashboard pages with 6 KPI cards and over 15 charts and visualizations. The dashboard supports dynamic slicers and filters allowing you to drill down by time period, channel, product category, and country. It works in all modern browsers including Chrome, Edge, Firefox, and Safari with zero software installation. The Data View page includes search, sort, pagination, and CSV export capabilities for detailed data analysis.
- 5 Interactive Dashboard Pages — Overview, Sales Analysis, Traffic and Engagement, Cost and Profitability, Data View
- 6 KPI Cards — Total Revenue, Total Orders, Avg Order Value, Total Views, Conversion Rate, Total Favorites
- 15+ Charts and Visualizations — covering revenue trends, channel analysis, geographic breakdown, device analytics, and profitability
- Dynamic Slicers and Filters — filter the entire dashboard by time, channel, category, country
- CSV Data Export — export filtered data from the Data View page
- Browser-Based — no installation needed, works on desktop and mobile
- Plug-and-Play — replace sample data with your own Etsy data and everything auto-updates
Dashboard Pages Explanation
1. Overview Page
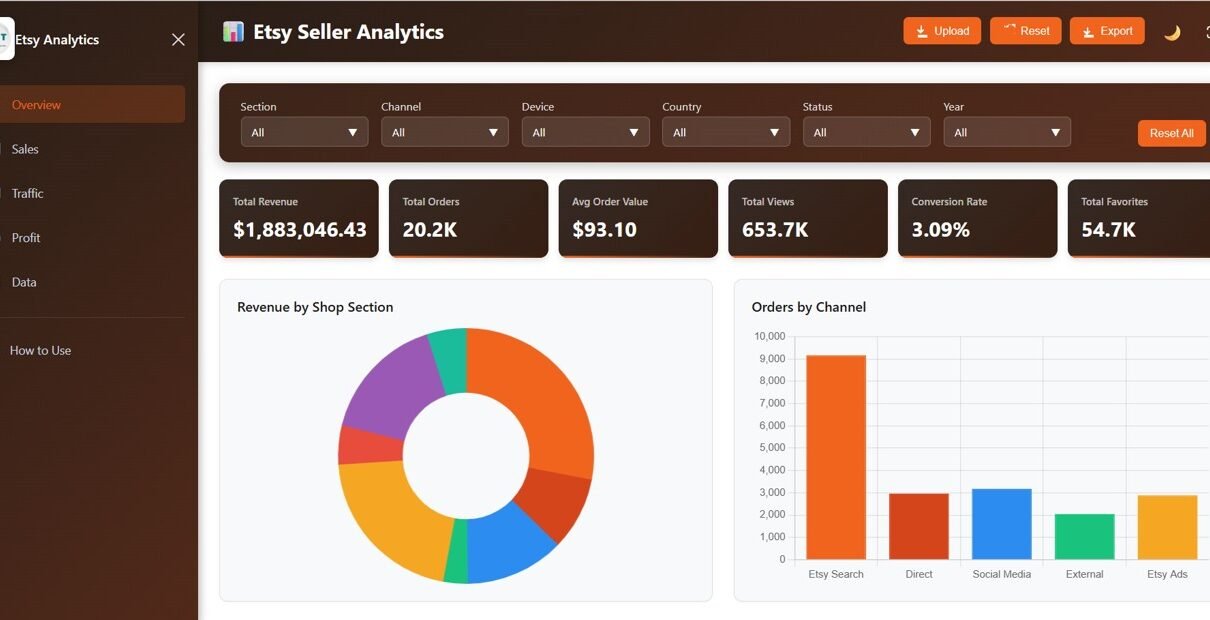
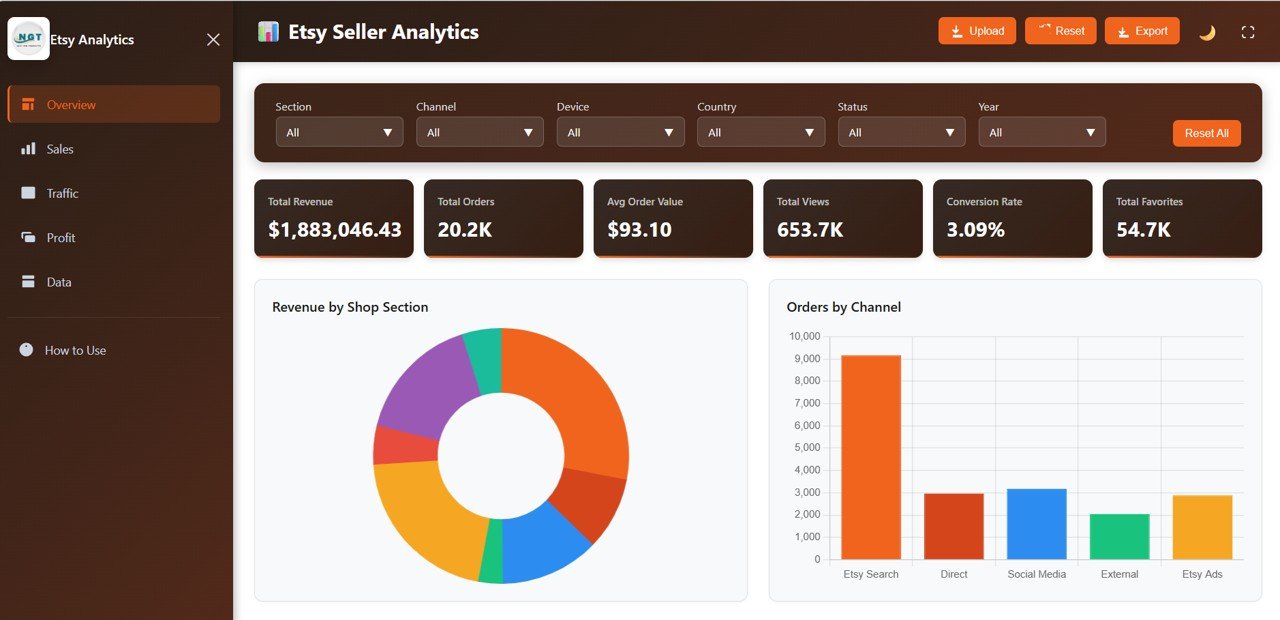
The Overview page is the central hub of the Etsy Seller Analytics Dashboard in HTML. At the top, you will find 6 KPI cards displaying high-level metrics: Total Revenue, Total Orders, Avg Order Value, Total Views, Conversion Rate, and Total Favorites. These cards give you an instant snapshot of your Etsy shop’s health at a glance.Etsy Seller Analytics Dashboard in HTML
Below the KPI cards, the Overview page features several analytical charts. Revenue by Shop Section helps you identify which categories in your store generate the most income. Orders by Channel reveals whether your sales are coming from Etsy search, direct traffic, social media, or other channels. Revenue by Country shows the geographic distribution of your earnings, while Listing Status Distribution breaks down your listings by active, inactive, and sold-out status. The Monthly Revenue Trend chart tracks your income trajectory over time so you can spot seasonal patterns and growth trends. Multiple slicers are available to filter the entire dashboard by different dimensions quickly.
Etsy Seller Analytics Dashboard Overview
2. Sales Analysis Page
The Sales Analysis page provides a deep dive into your Etsy sales data. Revenue by Product Category breaks down your earnings by different product types so you can see which categories are performing best. Orders by Device shows whether your customers are buying from desktop, mobile, or tablet devices — a critical insight for optimizing your listings. Revenue by Channel identifies the most profitable traffic sources. The Top 10 Products by Revenue chart highlights your best-selling items, helping you focus your marketing efforts on your winners.
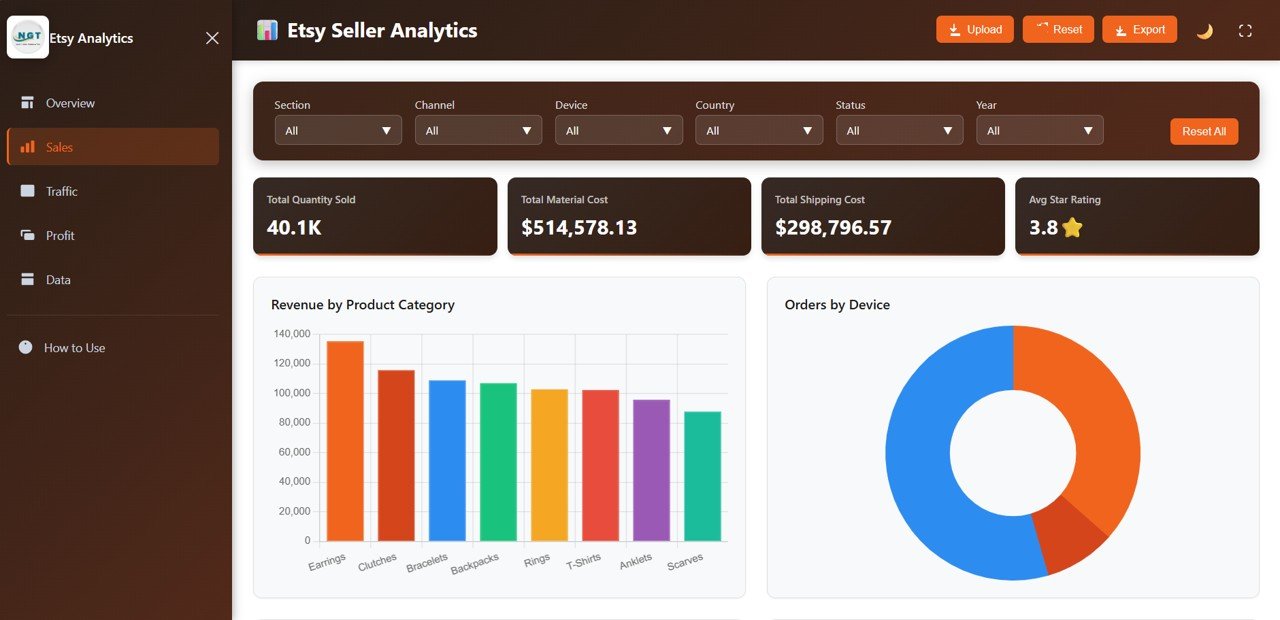
Sales Analysis
3. Traffic Page
Understanding where your traffic comes from and how visitors engage with your listings is essential for growing your Etsy shop. The Traffic and Engagement page includes Views by Channel to show which platforms drive the most visitors. Favorites by Shop Section reveals which product categories attract the most customer interest. Views by Country provides geographic insights into your audience, while Views by Device helps you understand the browsing habits of your potential customers.
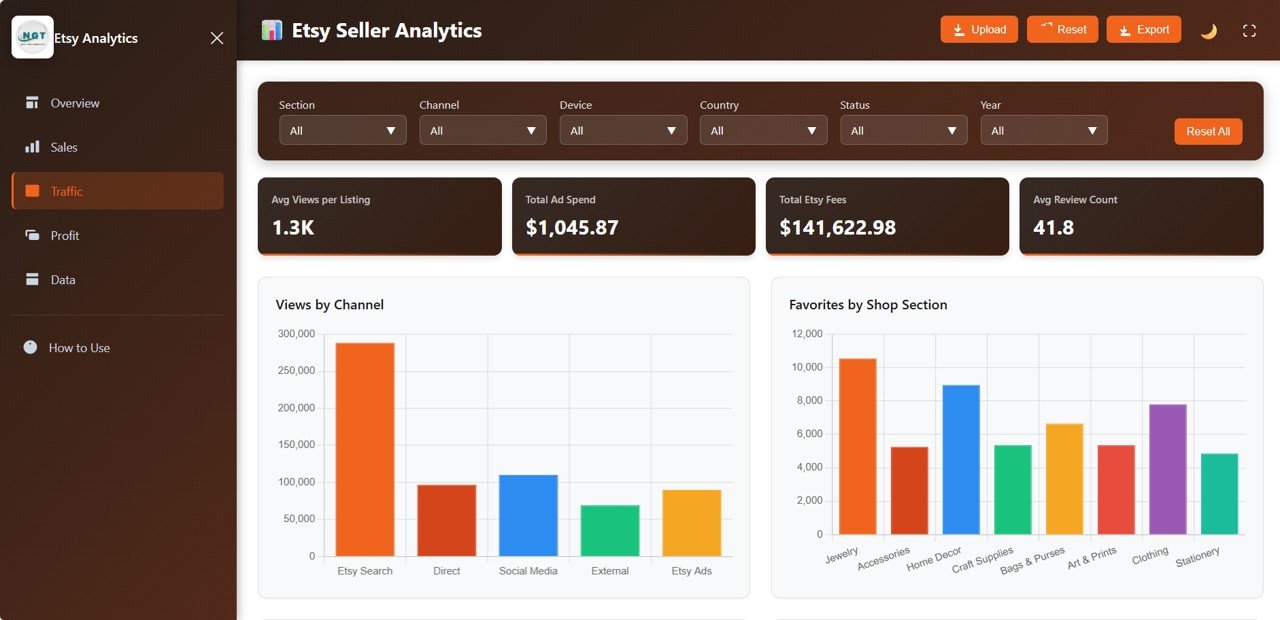
Traffic and Engagement
4. Profitability Page
Profitability is the true measure of business success, and the Cost and Profitability page gives you full transparency into your Etsy expenses. Cost Breakdown by Type categorizes your costs into Etsy fees, shipping, materials, and advertising. Profit by Shop Section shows which product categories deliver the highest margins. Fees by Channel breaks down platform fees across different sales channels. The Monthly Profit Trend chart tracks your net earnings over time so you can measure the real financial impact of your business decisions.
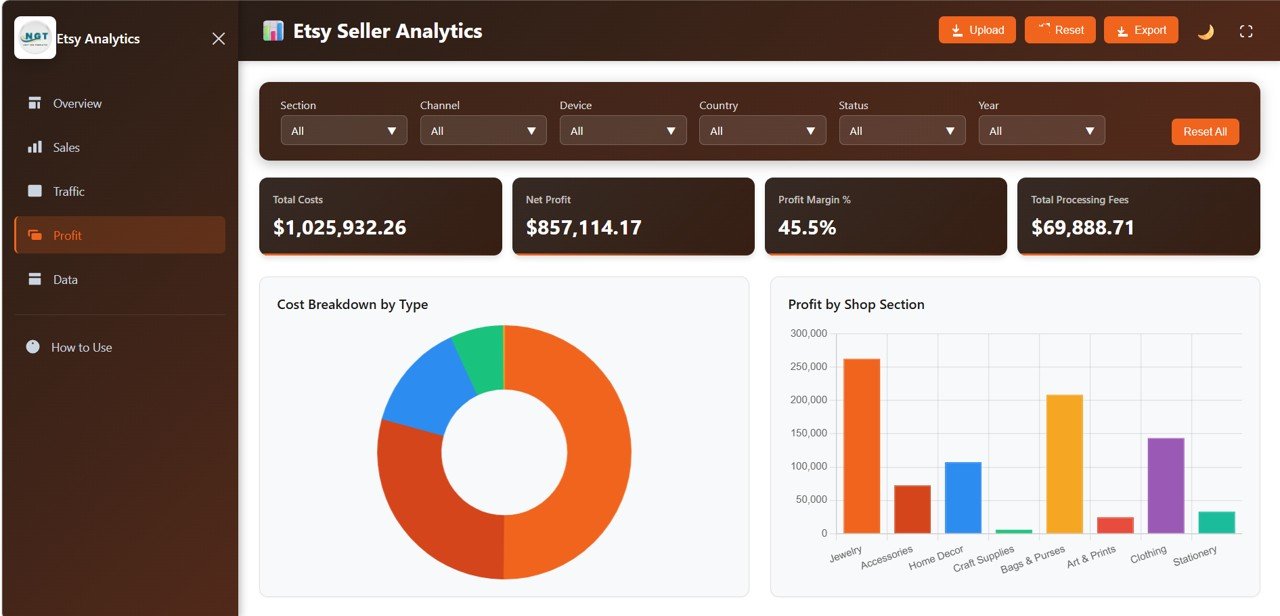
Cost and Profitability
5. Data View Page
The Data View page is a detailed data table showing all records with full search, sort, and pagination capabilities. You can filter data by any column, sort ascending or descending, and navigate through pages of records. The CSV export feature lets you download filtered data for further analysis in Excel or Google Sheets. This page is perfect for detailed investigations or when you need to share raw data with partners or accountants.
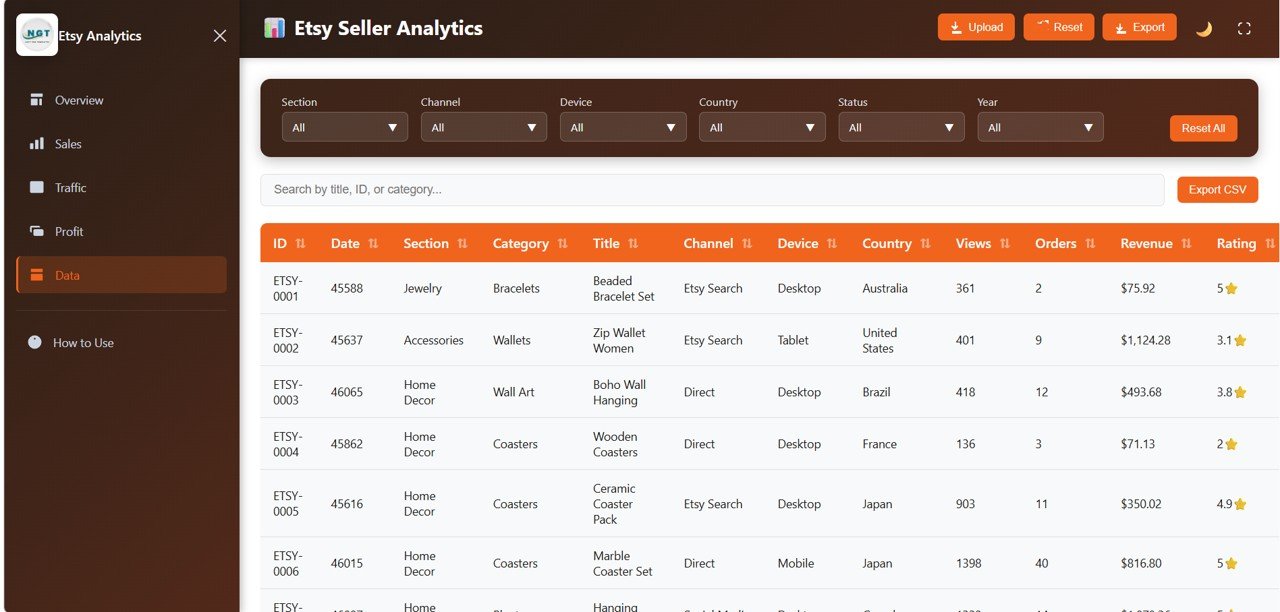
Data View
Advantages of Etsy Seller Analytics Dashboard in HTML
- Zero Installation Required — Unlike Excel or Power BI dashboards, this HTML template works directly in your browser with no software to download or configure.
- Complete Business Visibility — 5 dedicated pages cover every angle of your Etsy shop from high-level KPIs to granular data records.
- Cross-Platform Compatibility — Works on any operating system (Windows, Mac, Linux) and any modern browser.
- Mobile Responsive — Access your Etsy analytics from your phone or tablet while on the go.
- Data Export Ready — Export filtered data to CSV for accounting, tax filing, or deeper analysis.
- Privacy-Focused — All data stays on your local machine. Nothing is uploaded to the cloud unless you choose to.
Opportunities for Improvement
- Adding a date range picker for custom time period comparisons would enhance the filtering capabilities.
- Integration with the Etsy API for automatic data refresh would eliminate manual data entry.
- A customer demographics breakdown could add deeper audience insights beyond geographic data.
- Adding year-over-year comparison charts would help sellers track long-term growth trends.
Best Practices
- Update your data regularly — Import fresh data weekly or monthly to keep your dashboard current and actionable.
- Use filters strategically — Narrow down to specific channels, categories, or time periods to uncover hidden patterns in your sales data.
- Monitor conversion rate closely — A high views count with low conversion suggests your listings need optimization (better photos, descriptions, or pricing).
- Track profitability, not just revenue — The Cost and Profitability page is your most important analytical tool for making smart business decisions.
- Export data for tax season — Use the CSV export to share clean financial data with your accountant or bookkeeper.
Explore Relevant Templates
If you are looking for Etsy seller analytics in other platforms or broader e-commerce tracking solutions, check out these related templates from NextGenTemplates:
- Etsy Seller Analytics Dashboard in Power BI — Advanced Power BI version with drill-through capabilities and interactive filters for enterprise-level Etsy analytics.
- Etsy Seller Analytics Dashboard in Excel — Excel-based Etsy analytics with pivot tables, dynamic charts, and VBA automation features.
- Amazon FBA Seller Dashboard in Power BI — Comprehensive Amazon seller analytics covering FBA fees, inventory, and sales performance.
- Online Marketplaces Dashboard in Excel — Multi-platform e-commerce analytics covering Etsy, Amazon, eBay, and Shopify in a single dashboard.
- SaaS Metrics Dashboard in HTML — Browser-based analytics for SaaS businesses tracking MRR, churn, and customer metrics.
Click here to Purchase Etsy Seller Analytics Dashboard in HTML
Frequently Asked Questions
What is the best HTML dashboard template for tracking Etsy sales?
The Etsy Seller Analytics Dashboard in HTML by NextGenTemplates is one of the most comprehensive browser-based Etsy analytics templates available. It includes 5 interactive pages, 6 KPI cards, and over 15 charts covering revenue, orders, traffic, engagement, costs, and profitability — all without requiring any software installation.
How do I use the Etsy Seller Analytics Dashboard in HTML?
Simply download and unzip the template file, then open index.html in any modern browser like Chrome, Edge, Firefox, or Safari. Replace the sample data with your own Etsy shop data and all charts, KPI cards, and filters will update automatically. No coding or technical skills required.
Can I track Etsy fees and profitability with this dashboard?
Yes. The Cost and Profitability page provides detailed analysis including Cost Breakdown by Type, Profit by Shop Section, Fees by Channel, and Monthly Profit Trend. You can see exactly where your money goes and which product categories deliver the highest margins.
Does this Etsy HTML dashboard work on mobile devices?
Yes. The Etsy Seller Analytics Dashboard in HTML is mobile responsive and works on smartphones, tablets, and desktops across all modern browsers including Chrome, Edge, Firefox, and Safari.
Can I export my Etsy data from this dashboard?
Yes. The Data View page includes a CSV export feature that lets you download filtered and sorted data for further analysis in Excel, Google Sheets, or any other spreadsheet application.
Is there a Power BI or Excel version of this Etsy dashboard?
Yes. NextGenTemplates offers the same Etsy seller analytics in three formats: HTML (browser-based), Power BI (advanced interactive), and Excel (spreadsheet-based with pivot tables).
Conclusion
The Etsy Seller Analytics Dashboard in HTML is the perfect solution for Etsy shop owners who want powerful analytics without the complexity of desktop software. With 5 interactive pages, 6 KPI cards, and 15+ charts, this dashboard gives you complete visibility into your revenue, orders, traffic, engagement, costs, and profitability — all from your web browser. Replace the sample data with your own Etsy shop data and start making data-driven decisions today.
Click here to Purchase Etsy Seller Analytics Dashboard in HTML
For step-by-step tutorials and dashboard walkthroughs, visit our YouTube channel:
👉 Youtube.com/@NeoTechNavigators