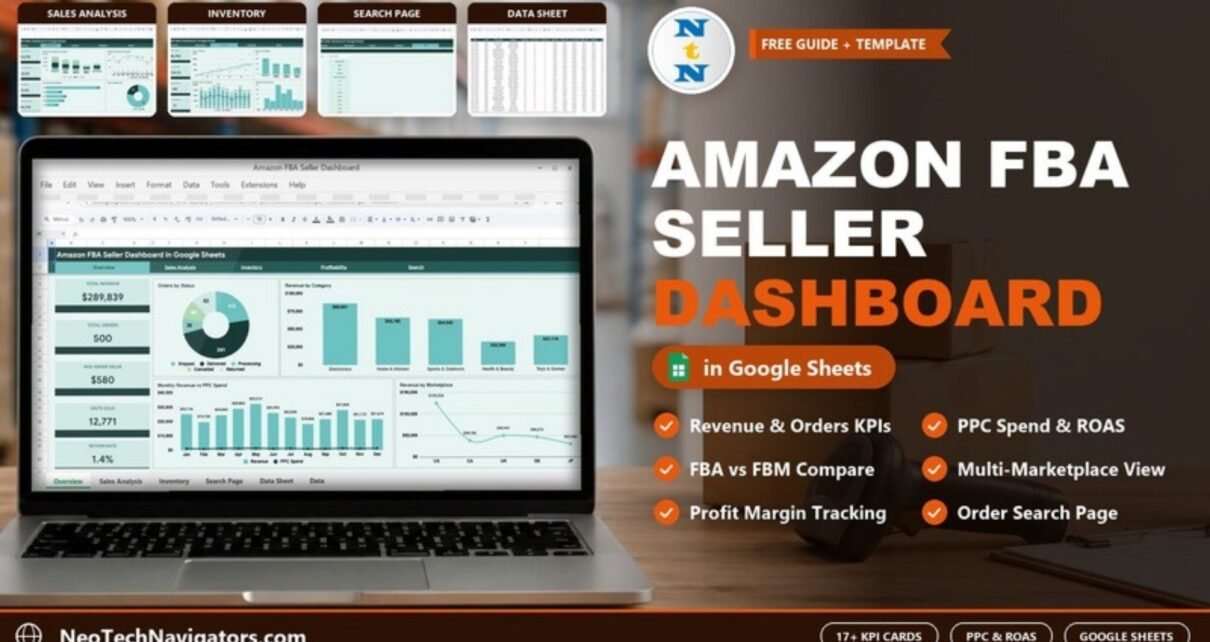
Track Amazon revenue, returns, PPC spend, fees and real profit by category and marketplace with this six-tab Google Sheets dashboard. See every page, how the KPIs are calculated and how to load your own Seller Central data.
Online Tutorial for Data Analysis and Automation
Track Amazon revenue, returns, PPC spend, fees and real profit by category and marketplace with this six-tab Google Sheets dashboard. See every page, how the KPIs are calculated and how to load your own Seller Central data.
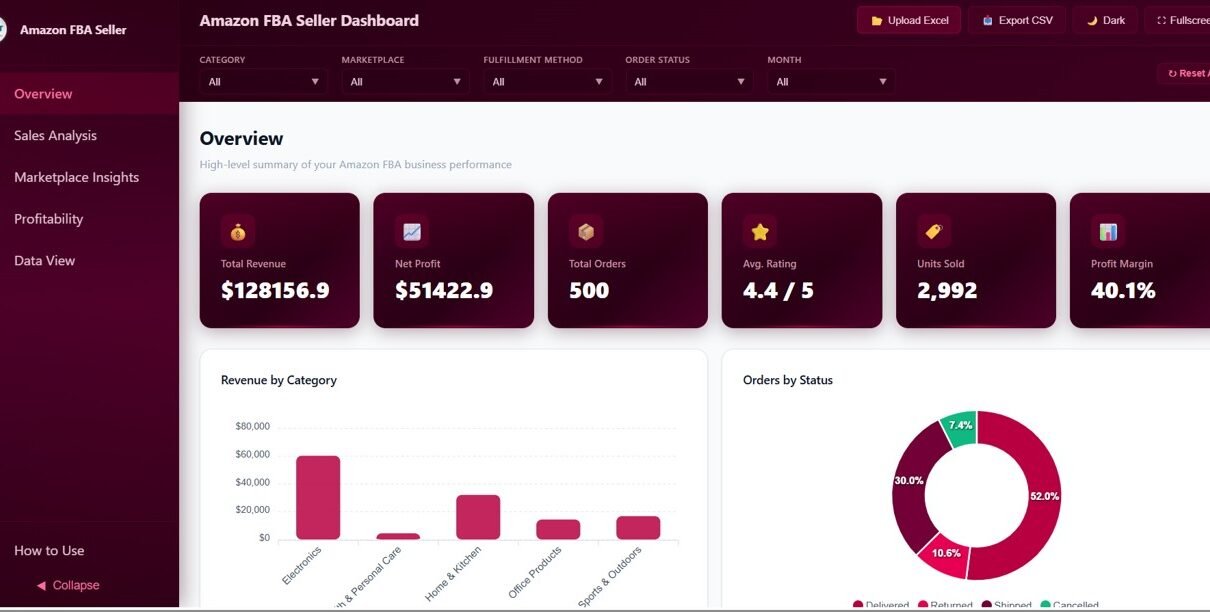
Explore the Amazon FBA Seller Dashboard in HTML — a browser-based interactive dashboard with 5 pages, 6 KPIs, and 12+ charts to track revenue, orders, profitability, marketplace performance, and customer ratings for your Amazon FBA business.
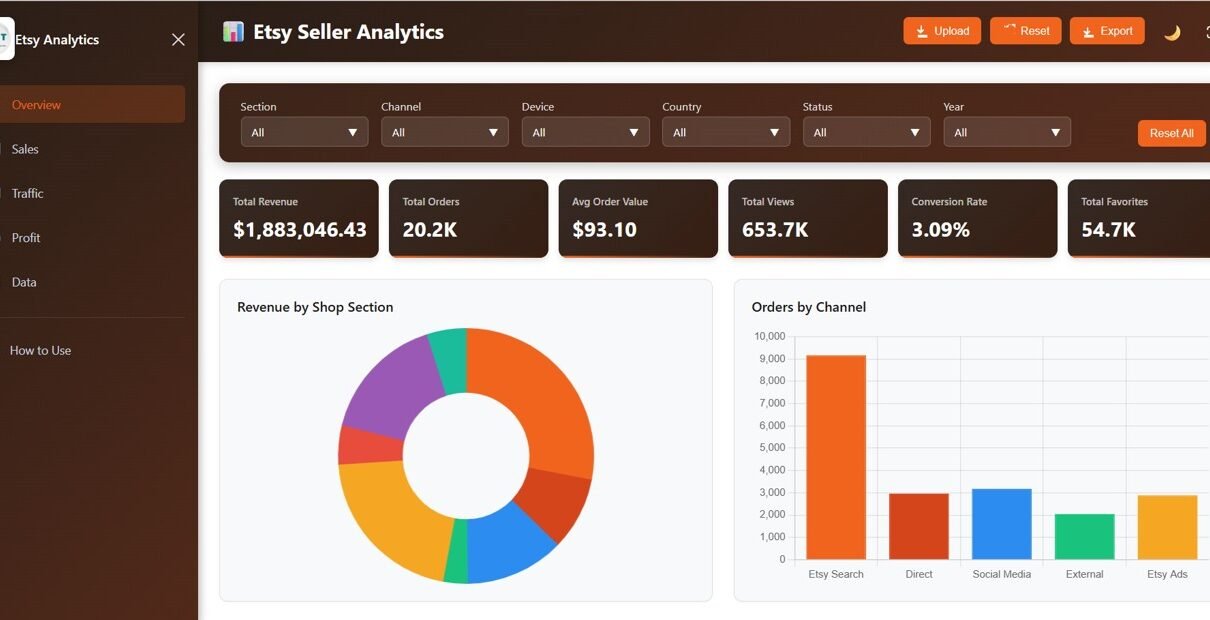
Explore the Etsy Seller Analytics Dashboard in HTML — a browser-based interactive dashboard with 5 pages, 6 KPIs, and 15+ charts to track revenue, orders, traffic, engagement, costs, and profitability for your Etsy shop.
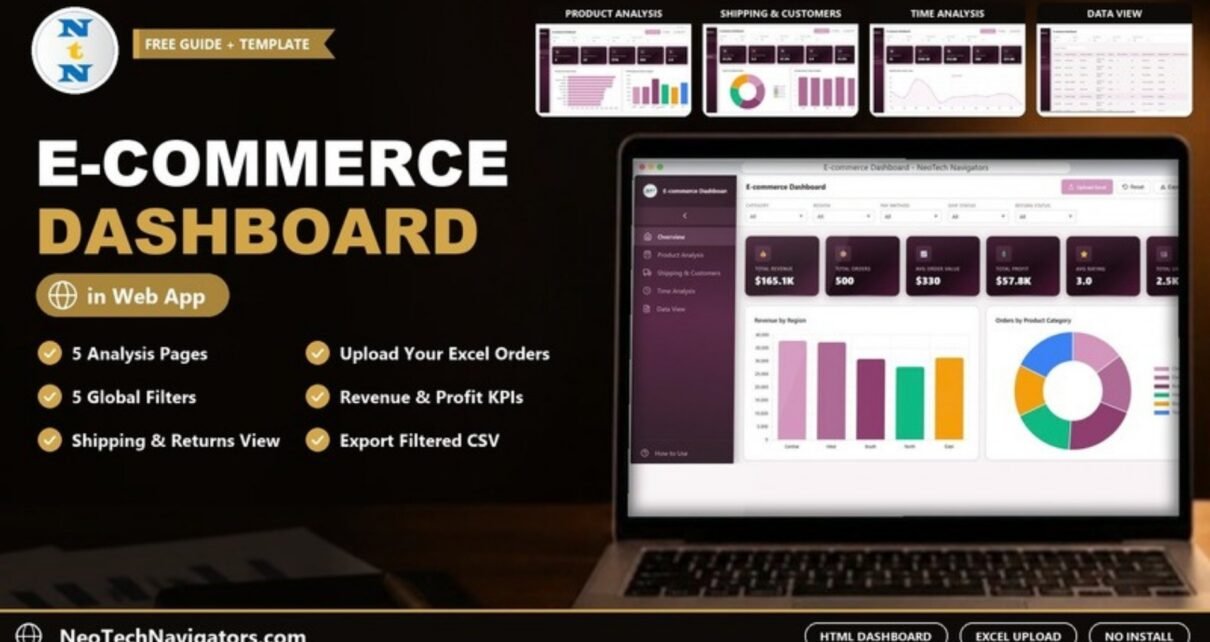
A browser-based E-commerce Dashboard in HTML with five pages, global filters, Excel upload and CSV export to track revenue, products, shipping, returns and monthly trends.

Product returns directly affect profitability, customer satisfaction, inventory planning, and brand reputation. Therefore, businesses must track return patterns carefully and act quickly on insights. However, when return data stays scattered across reports or systems, teams struggle to identify root causes and trends.Product Return Rate KPI Dashboard in Google Sheets That is exactly why a Product […]
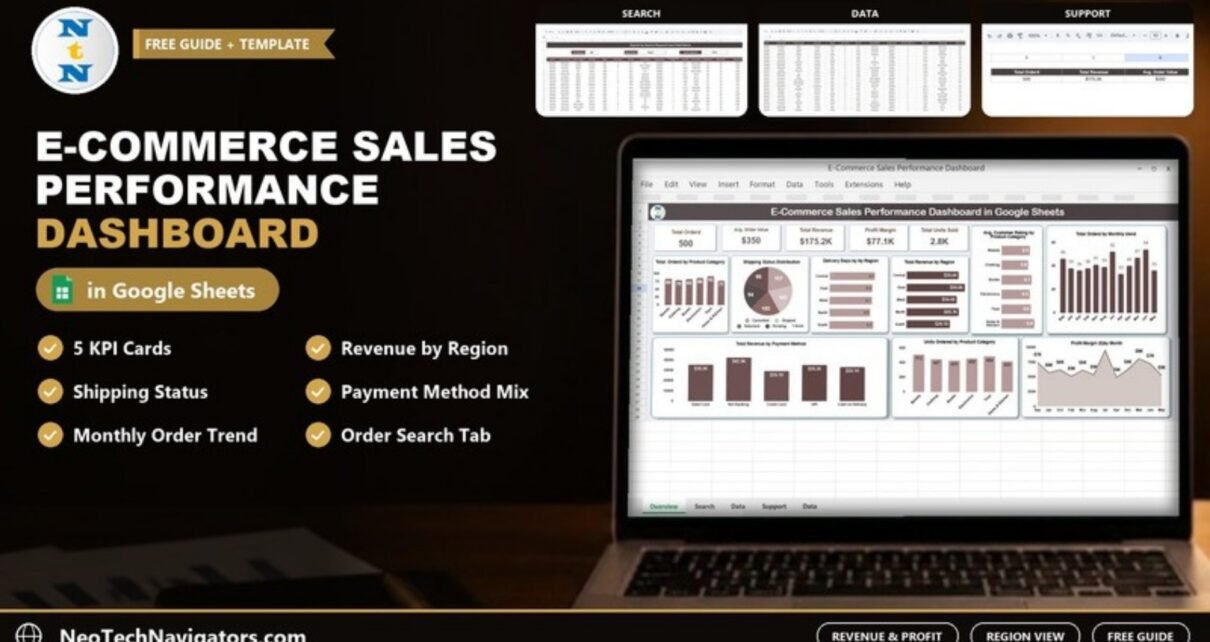
A practical guide to the E-Commerce Sales Performance Dashboard in Google Sheets: five KPI cards, nine charts, a Search tab and a Data sheet for tracking orders, revenue, delivery days, ratings and profit.