Managing financial transactions is one of the most critical responsibilities for any organization. Businesses handle hundreds or even thousands of financial transactions every month, including revenue entries, expense payments, departmental spending, and approval processes. However, when companies rely on scattered spreadsheets or manual reports, they often struggle to monitor financial activity effectively.Financial Transactions Dashboard in Google Sheets
As a result, finance managers may find it difficult to track revenue trends, analyze departmental expenses, monitor approvals, and identify financial patterns.Financial Transactions Dashboard in Google Sheets
Therefore, organizations increasingly use financial dashboards to visualize transaction data and gain meaningful insights.
One powerful solution is the Financial Transactions Dashboard in Google Sheets. This ready-to-use dashboard allows finance teams to monitor revenue, expenses, transaction approvals, departmental spending, and financial trends in a centralized visual reporting system.
In this article, you will learn everything about the Financial Transactions Dashboard in Google Sheets, including its structure, features, advantages, best practices, and frequently asked questions.
What Is a Financial Transactions Dashboard in Google Sheets?
A Financial Transactions Dashboard in Google Sheets is an interactive analytics tool that tracks and visualizes financial transaction data.
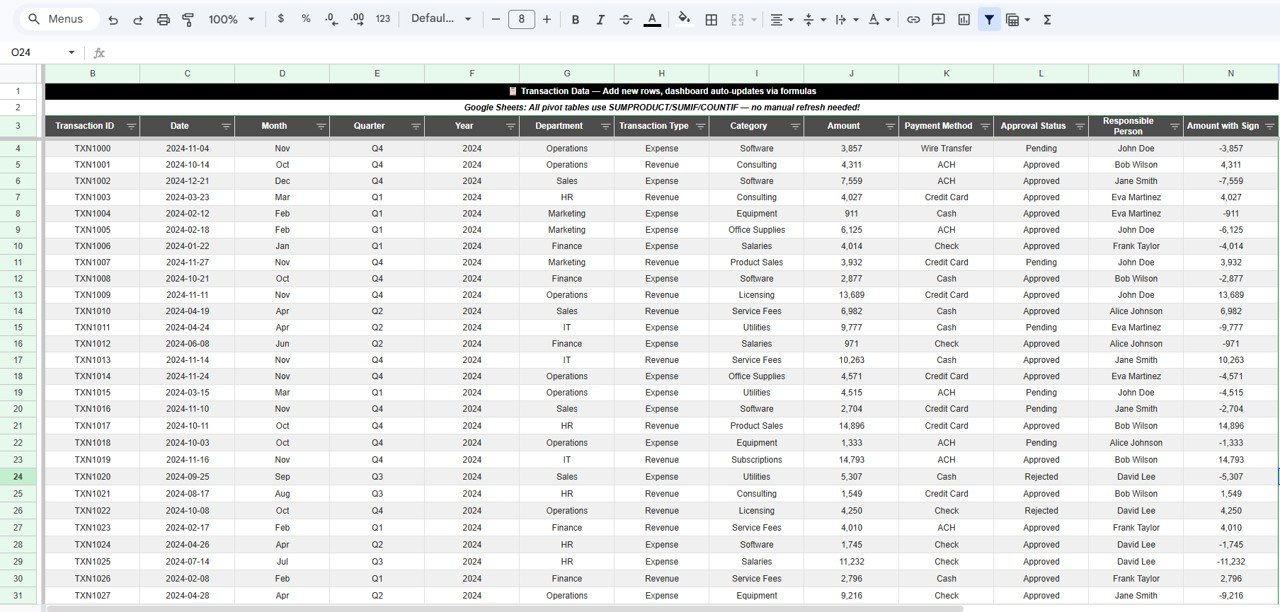
The dashboard collects transaction information such as:
- Transaction ID
- Transaction date
- Department
- Category
- Payment method
- Transaction type (Revenue or Expense)
- Approval status
- Responsible person
- Transaction amount
Then, it converts this raw financial data into meaningful visual reports using charts, KPIs, and dynamic filters.
Because the dashboard runs in Google Sheets, finance teams can update data easily and collaborate with colleagues in real time.
Moreover, the dashboard automatically updates charts and metrics using formulas such as:
As a result, finance managers always see the most recent financial insights.
Why Do Businesses Need a Financial Transactions Dashboard?
Click to Buy Financial Transactions Dashboard in Google Sheets
Every organization must monitor financial activity carefully. However, when financial data spreads across multiple spreadsheets, analyzing it becomes difficult.
For example:
- Finance teams cannot easily track department expenses
- Managers struggle to analyze monthly revenue trends
- Leadership lacks visibility into approval status
- Analysts spend too much time preparing reports
However, a financial transactions dashboard solves these problems.
When organizations implement a dashboard, they can:
- Track financial performance instantly
- Identify expense trends
- Monitor transaction approvals
- Improve financial decision-making
Therefore, a Financial Transactions Dashboard becomes a powerful tool for financial management.
Key Features of the Financial Transactions Dashboard in Google Sheets
This dashboard contains multiple analytical sections that provide detailed financial insights.
The template includes five main analytical dashboard pages, along with transaction data and search functionality.
1. Financial Transactions Overview Dashboard
Click to Buy Financial Transactions Dashboard in Google Sheets
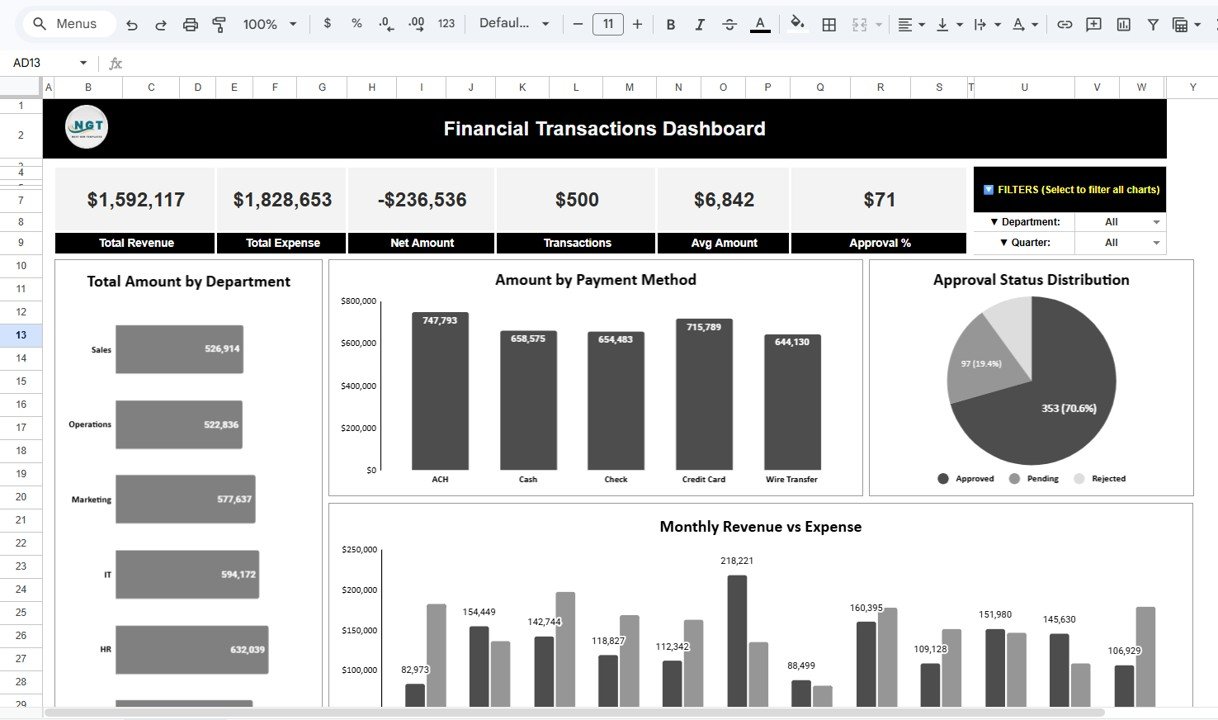
The Financial Transactions Dashboard provides a high-level overview of financial performance.
Key Performance Indicators (KPIs)
At the top of the dashboard, several KPI cards summarize key financial metrics:
- Total Revenue
- Total Expense
- Net Amount
- Total Transactions
- Average Transaction Amount
- Approval Percentage
These KPIs allow finance managers to understand the organization’s financial status instantly.
Total Amount by Department
This chart displays the total transaction amount for each department.
Departments may include:
- Sales
- Operations
- Marketing
- IT
- HR
- Finance
Because this chart compares departmental spending, managers can identify which departments generate or consume the most financial resources.
Amount by Payment Method
The dashboard also analyzes transaction amounts by payment method, such as:
- ACH
- Cash
- Check
- Credit Card
- Wire Transfer
This insight helps organizations understand how financial transactions occur across different payment channels.
Approval Status Distribution
The dashboard visualizes the distribution of approval statuses.
Transactions are categorized as:
- Approved
- Pending
- Rejected
This chart helps finance teams monitor approval workflows and identify delays.
Click to Buy Financial Transactions Dashboard in Google Sheets
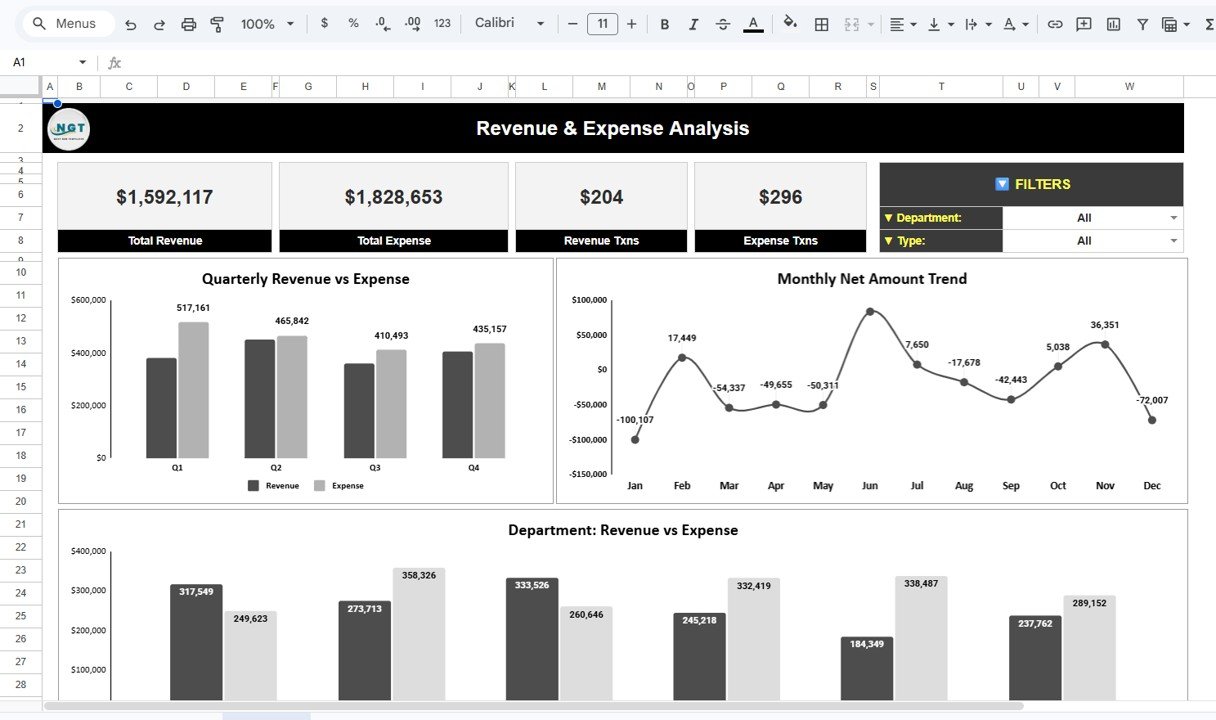
2. Revenue & Expense Analysis Dashboard
The Revenue & Expense Analysis Dashboard focuses on financial performance.
Revenue vs Expense KPIs
This section includes KPI cards such as:
- Total Revenue
- Total Expense
- Revenue Transactions
- Expense Transactions
These metrics provide a quick financial snapshot.
Quarterly Revenue vs Expense
Finance managers can analyze seasonal financial trends and compare performance across quarters.
Monthly Net Amount Trend
The monthly net amount trend chart displays the difference between revenue and expenses for each month.
This insight helps organizations understand profit or loss trends throughout the year.
Department Revenue vs Expense
This chart compares revenue and expenses for each department.
It helps finance leaders identify departments that generate profit and those that consume financial resources.
Click to Buy Financial Transactions Dashboard in Google Sheets
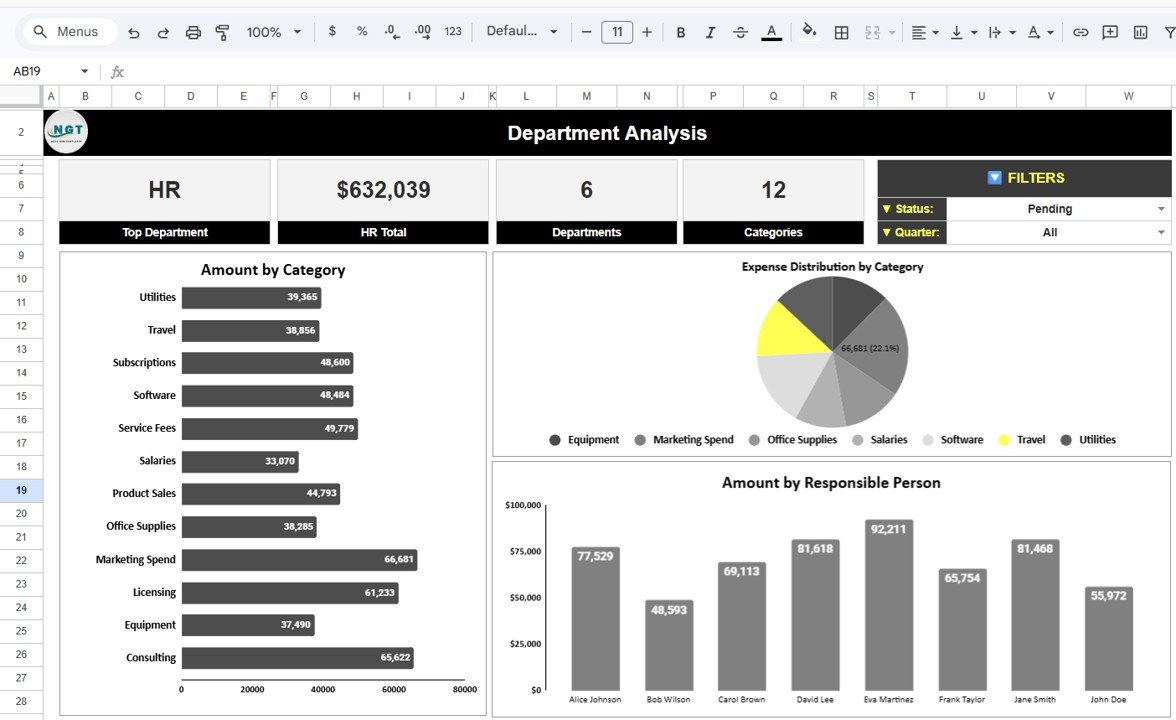
3. Department Analysis Dashboard
The Department Analysis Dashboard provides detailed insights into departmental financial performance.
Top Department KPI
The dashboard highlights the department with the highest transaction amount.
For example, HR may appear as the top department based on financial activity.
Department KPIs
Additional KPI cards include:
-
These KPIs help summarize departmental activity.
Amount by Category
This bar chart displays spending across various categories such as:
Because organizations track spending categories, managers can control operational costs more effectively.
Expense Distribution by Category
This pie chart shows how expenses distribute across categories.
As a result, finance managers can identify the largest expense areas quickly.
Amount by Responsible Person
This chart displays transaction amounts handled by different employees.
It helps organizations monitor financial responsibilities and accountability.
Click to Buy Financial Transactions Dashboard in Google Sheets
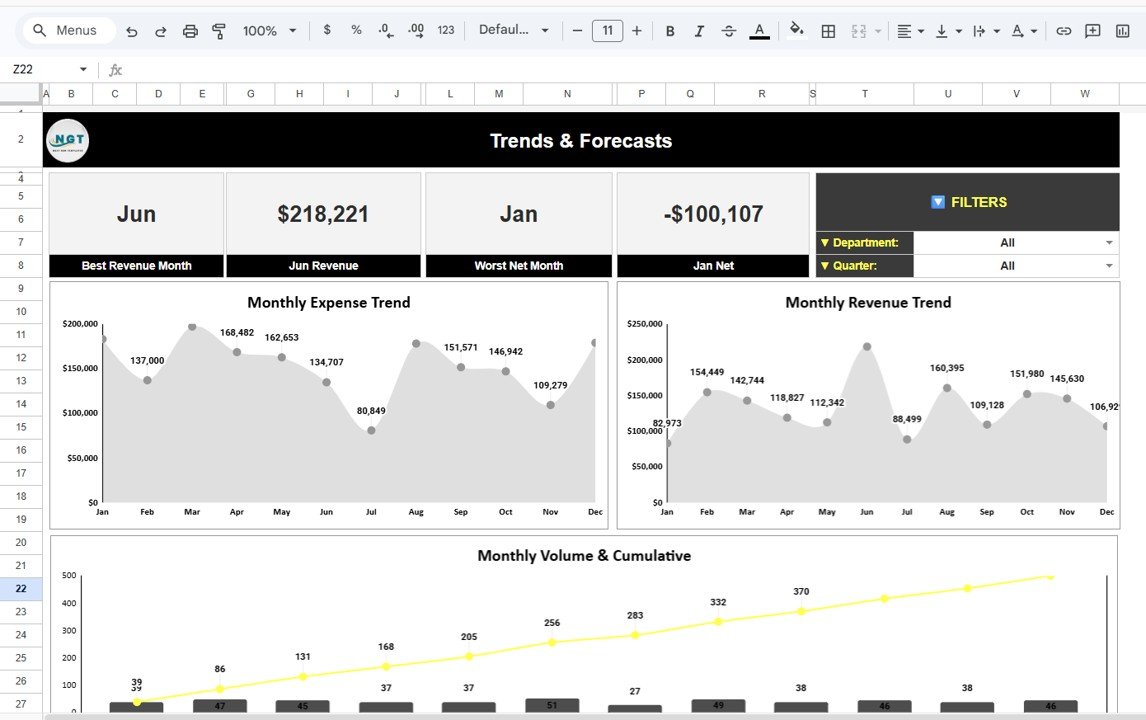
4. Trends & Forecasts Dashboard
The Trends & Forecasts Dashboard analyzes long-term financial patterns.
Best Revenue Month
The dashboard highlights the month with the highest revenue.
Worst Net Month
This KPI identifies the month with the lowest net financial performance.
Monthly Expense Trend
This line chart shows how expenses change across months.
Managers can detect unusual spending patterns easily.
Monthly Revenue Trend
This chart visualizes monthly revenue growth or decline.
It helps organizations monitor financial performance over time.
Monthly Volume and Cumulative Trend
This chart tracks the number of transactions and cumulative financial activity across months.
Therefore, organizations can analyze financial growth patterns.
Click to Buy Financial Transactions Dashboard in Google Sheets
5. Transaction Data Sheet
The Transaction Data Sheet contains the raw financial data used by the dashboard.
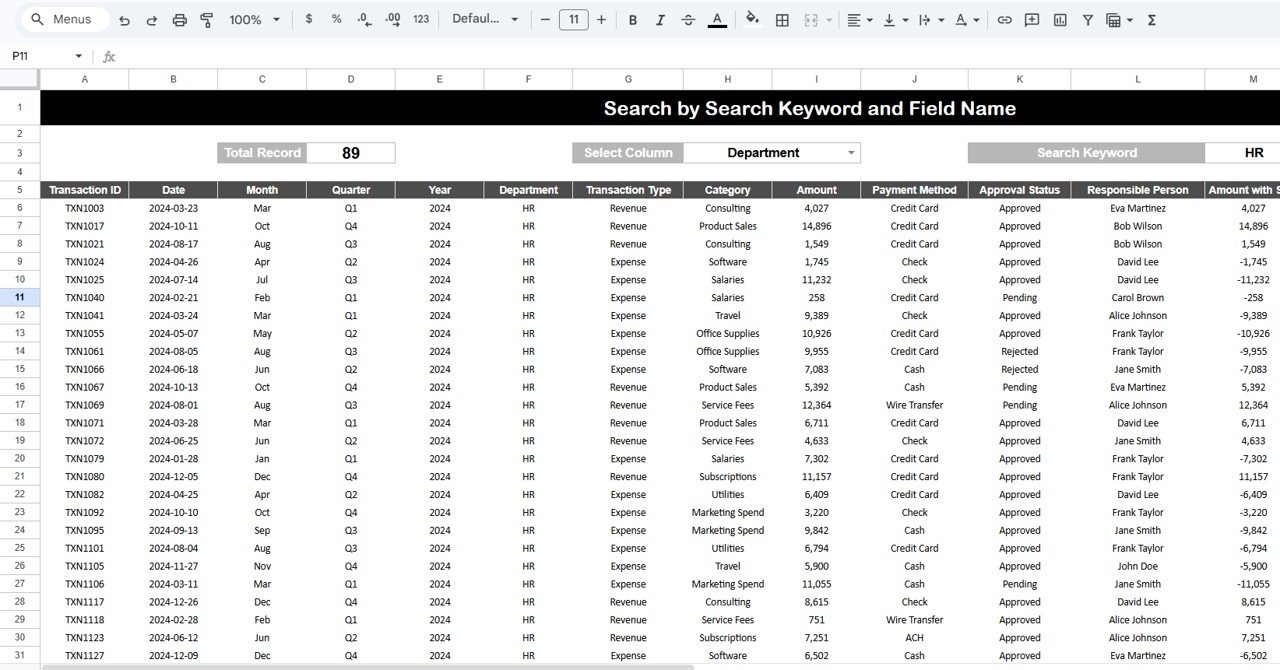
6. Search Functionality Dashboard
The template also includes a Search by Keyword and Field Name feature.
This functionality allows users to filter transactions quickly.
Users can:
- Select a column (such as Department or Category)
- Enter a search keyword
- Instantly view filtered transaction records
Therefore, finance teams can locate specific transactions without manually scanning large datasets.
Click to Buy Financial Transactions Dashboard in Google Sheets
Advantages of Financial Transactions Dashboard in Google Sheets
Using this dashboard provides many benefits for organizations.
Improved Financial Visibility
Managers can view financial performance in one centralized dashboard.
Faster Financial Reporting
The dashboard automatically updates reports using formulas.
Better Expense Monitoring
Finance teams can track departmental expenses and category spending.
Data-Driven Decision Making
Managers rely on data instead of assumptions when making financial decisions.
Real-Time Collaboration
Because the dashboard runs in Google Sheets, multiple users can work simultaneously.
Best Practices for Using the Financial Transactions Dashboard
To maximize the effectiveness of the dashboard, organizations should follow best practices.
Maintain Accurate Data Entry
Always enter accurate transaction data in the transaction sheet.
Update Data Regularly
Update financial transactions frequently to maintain accurate analytics.
Monitor KPIs Monthly
Review financial KPIs regularly to identify performance changes.
Analyze Department Spending
Track departmental spending trends to control operational costs.
Set Financial Benchmarks
Define targets for revenue growth and expense management.
Click to Buy Financial Transactions Dashboard in Google Sheets
Conclusion
The Financial Transactions Dashboard in Google Sheets provides a powerful solution for managing and analyzing financial data.
Because the dashboard includes multiple analytical pages such as Financial Overview, Revenue & Expense Analysis, Department Analysis, Trends & Forecasts, and Transaction Search, organizations gain complete visibility into financial activity.
Moreover, the dashboard uses interactive charts, KPI cards, and dynamic filters to transform raw transaction data into actionable insights.
As a result, finance teams can track revenue, control expenses, monitor approvals, and make smarter financial decisions.
Organizations that implement financial dashboards gain better financial transparency and stronger control over their financial operations.
Visit our YouTube channel to learn step-by-step video tutorials
Youtube.com/@NeotechNavigators
Watch the step-by-step video tutorial:
Click to Buy Financial Transactions Dashboard in Google Sheets