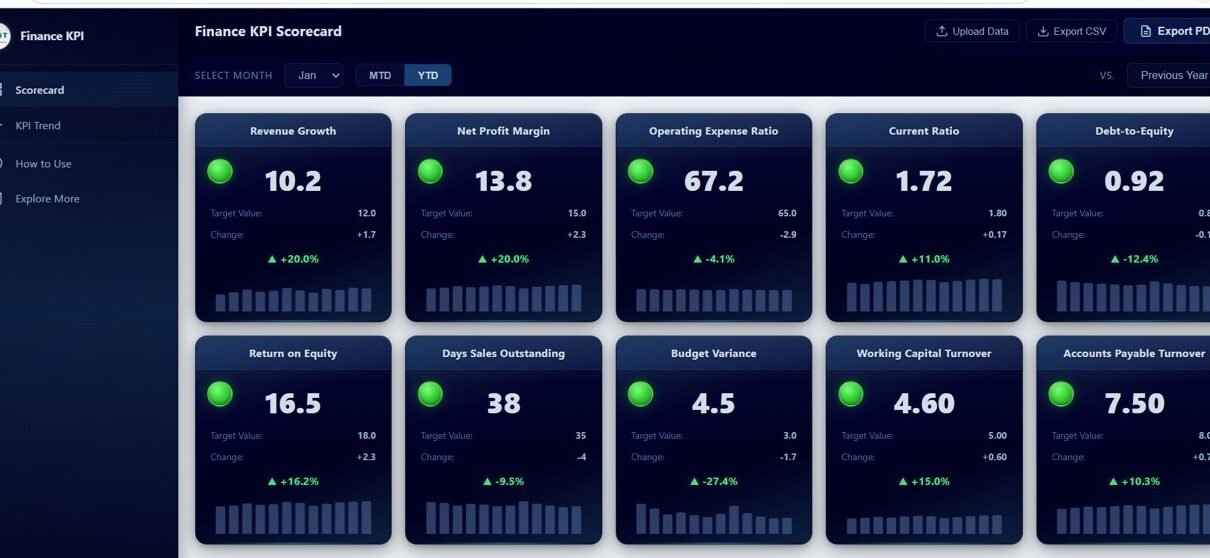
Finance KPI Scorecard in HTML — a premium interactive dashboard template with 10 finance KPIs, traffic light indicators, sparkline trends, MTD/YTD comparison toggle, and detailed trend analysis charts for CFOs and finance teams.
Online Tutorial for Data Analysis and Automation
Finance KPI Scorecard in HTML — a premium interactive dashboard template with 10 finance KPIs, traffic light indicators, sparkline trends, MTD/YTD comparison toggle, and detailed trend analysis charts for CFOs and finance teams.
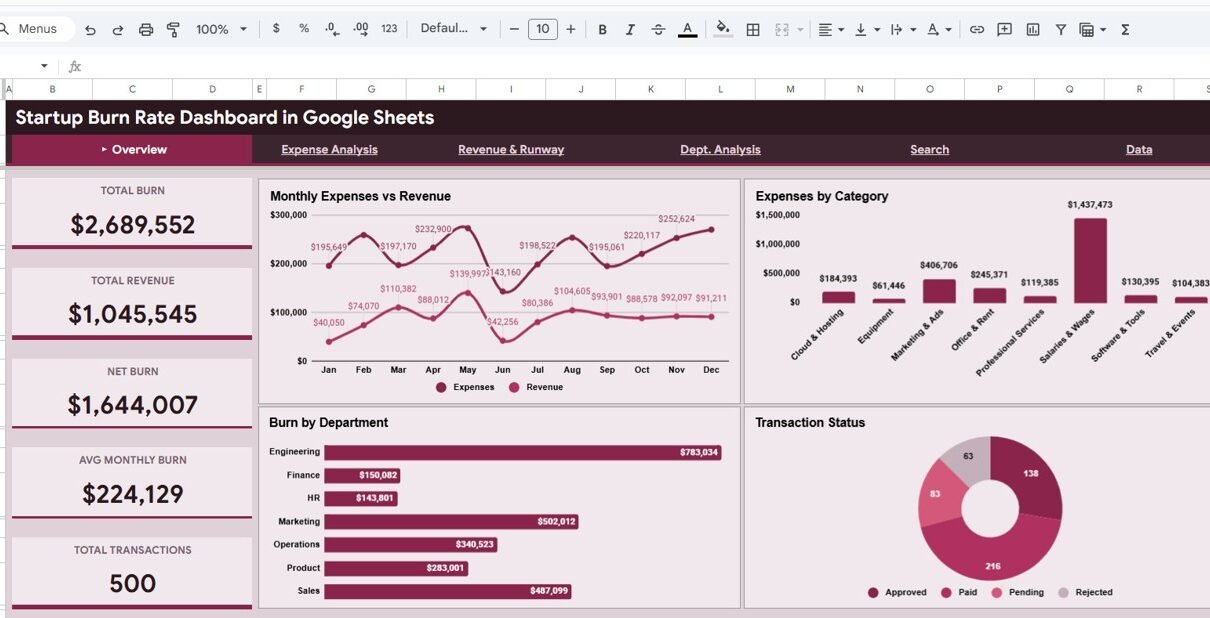
Track your startup’s burn rate, expenses, revenue, and financial runway with this interactive Google Sheets dashboard featuring 5 pages, 5 KPI cards, dynamic charts, and smart search functionality.
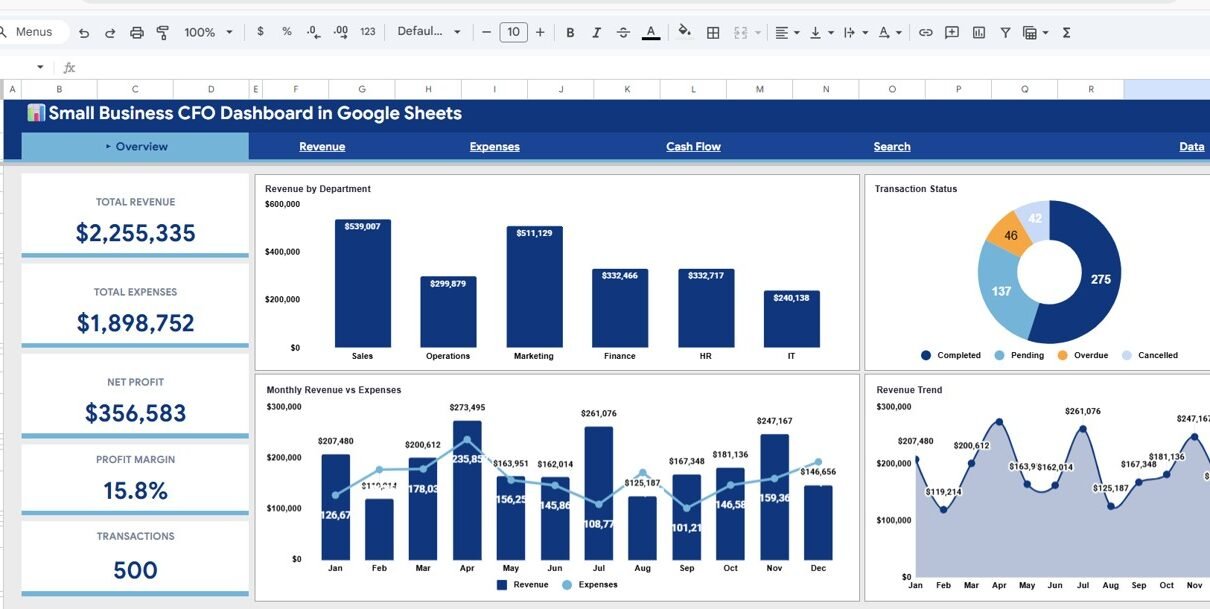
Track revenue, expenses, cash flow, and profit with this Small Business CFO Dashboard in Google Sheets. Includes 6 interactive pages, 5 KPI cards, and auto-updating charts.
Managing financial transactions is one of the most critical responsibilities for any organization. Businesses handle hundreds or even thousands of financial transactions every month, including revenue entries, expense payments, departmental spending, and approval processes. However, when companies rely on scattered spreadsheets or manual reports, they often struggle to monitor financial activity effectively.Financial Transactions Dashboard in […]
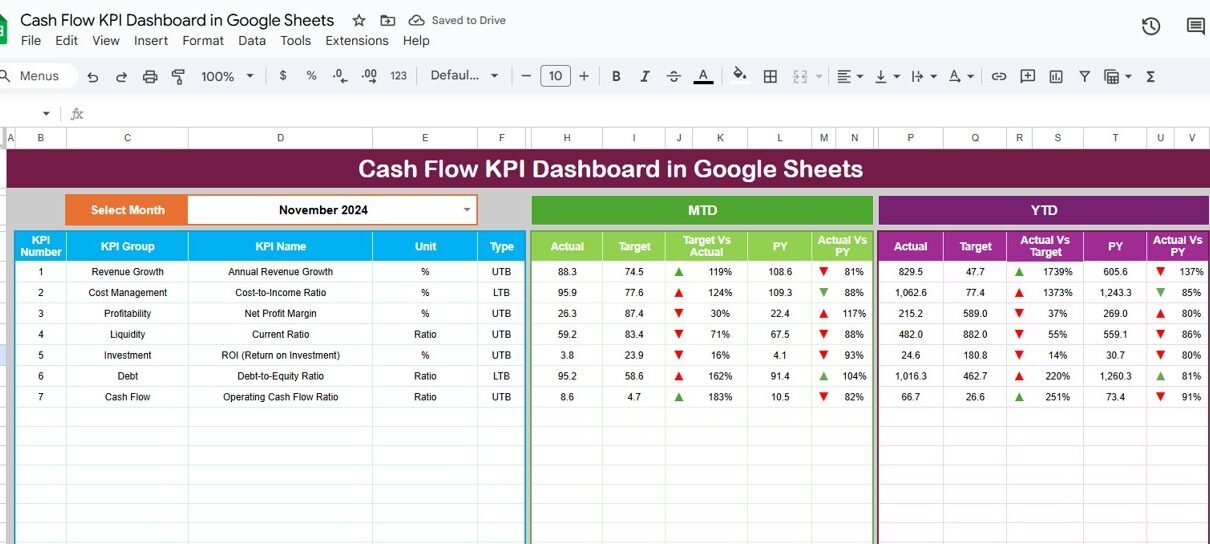
Cash flow drives every business. When your cash inflow stays smooth and predictable, you can plan growth, invest confidently, and avoid financial stress. However, many organizations still track cash flow manually in scattered spreadsheets. As a result, they miss early warning signs and cannot measure performance accurately. A Cash Flow KPI Dashboard in Google Sheets […]