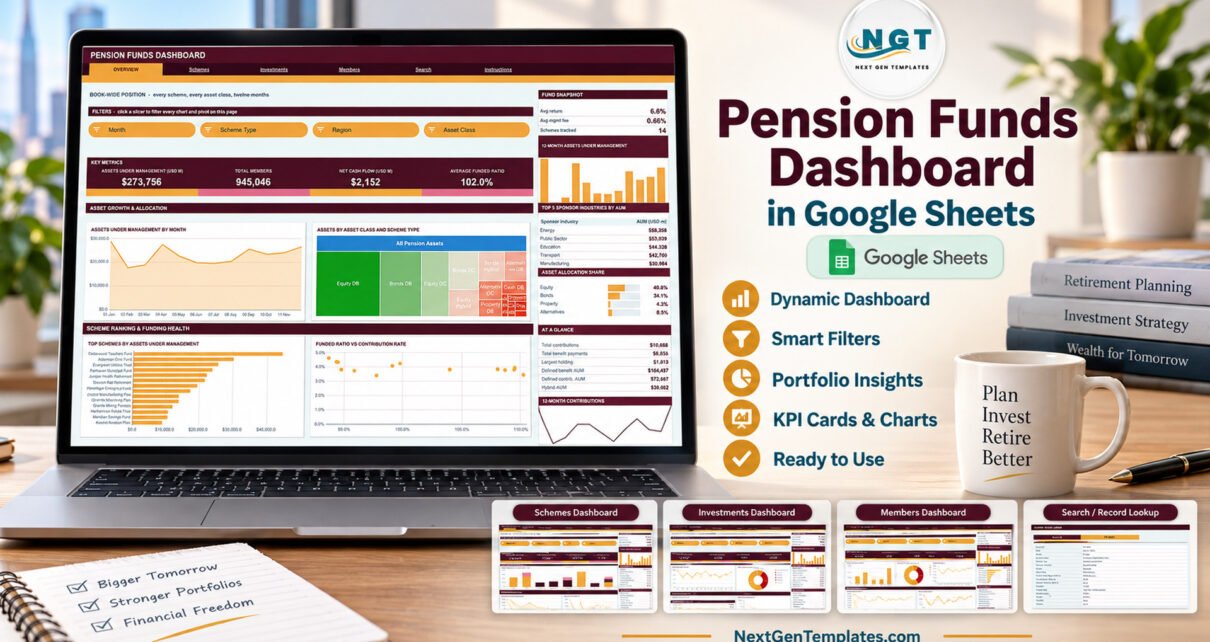
A six-page Google Sheets dashboard for pension scheme reporting: 500 fictional sample records, 16 KPI cards, 18 charts and 15 slicers covering assets, members, contributions, benefit payments, returns and fees – with a clear note on what it is not.
Online Tutorial for Data Analysis and Automation
A six-page Google Sheets dashboard for pension scheme reporting: 500 fictional sample records, 16 KPI cards, 18 charts and 15 slicers covering assets, members, contributions, benefit payments, returns and fees – with a clear note on what it is not.
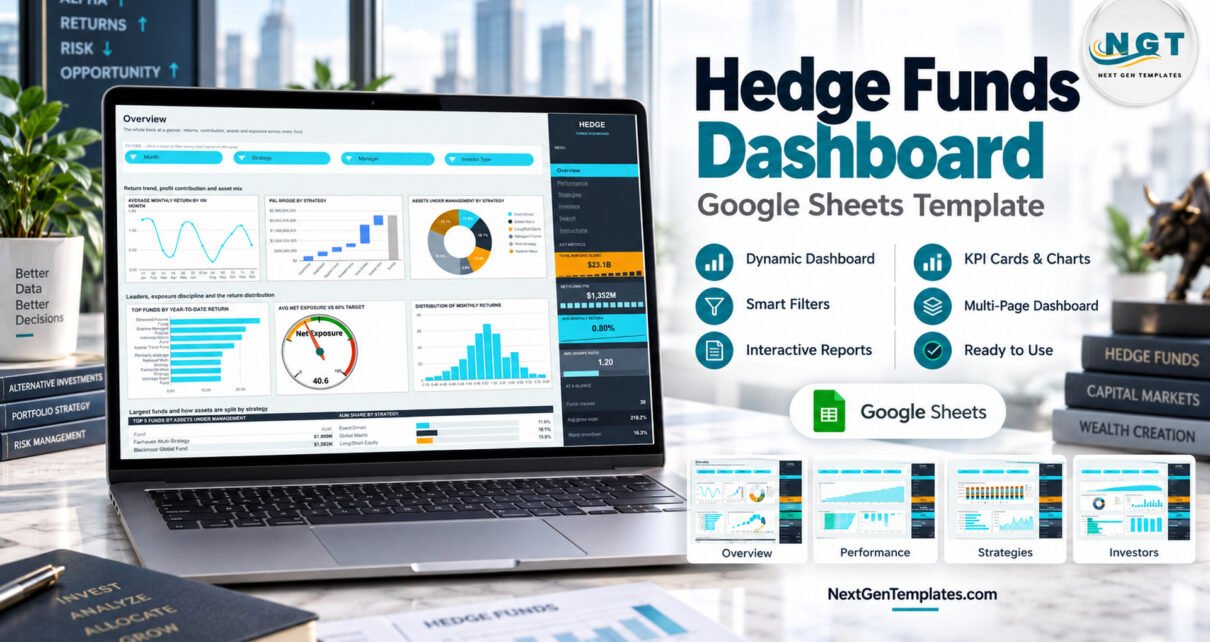
A six-page Google Sheets dashboard for fund-month records: 360 fictional sample records for 30 funds, 18 charts and 15 slicers covering AUM, net flows, returns, Sharpe ratio, drawdown, fees and exposure – a reporting template, not trading or fund-administration software.
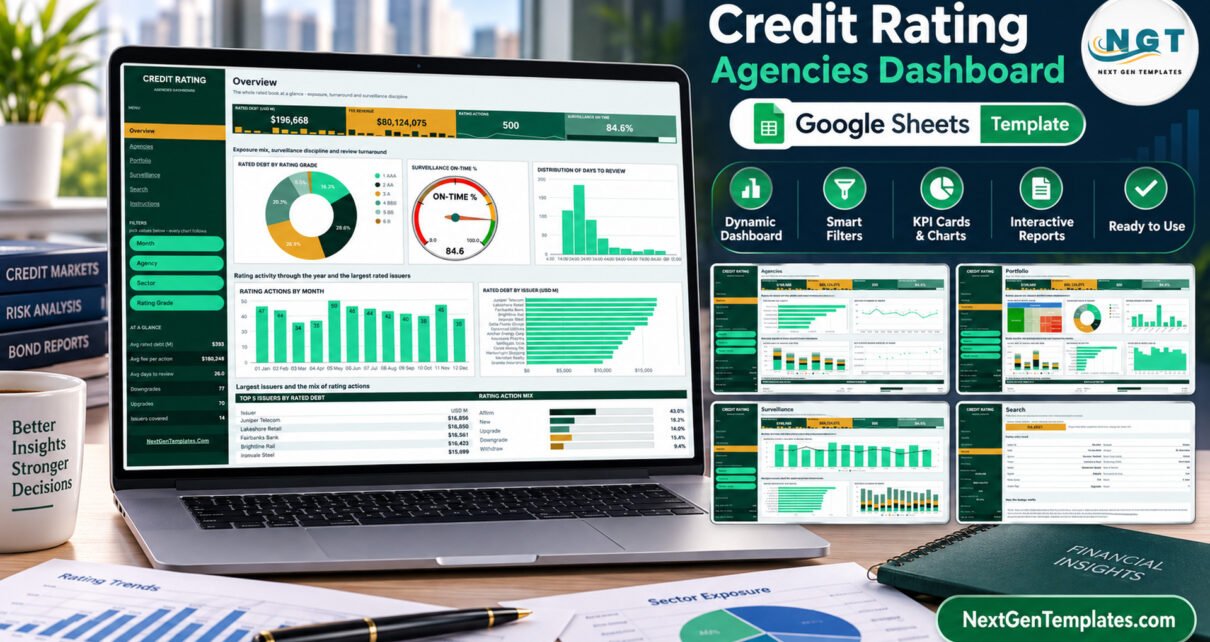
A six-page Google Sheets dashboard for rating-action logs: 500 fictional sample actions, 4 headline tiles, 18 charts and 15 slicers covering rated debt, fees, grades, outlooks and review turnaround – with a clear note on what it is not.
Review transaction value, fee revenue, success rate, product mix, platforms, revenue, risk, search, and transaction data with this Google Sheets fintech dashboard.
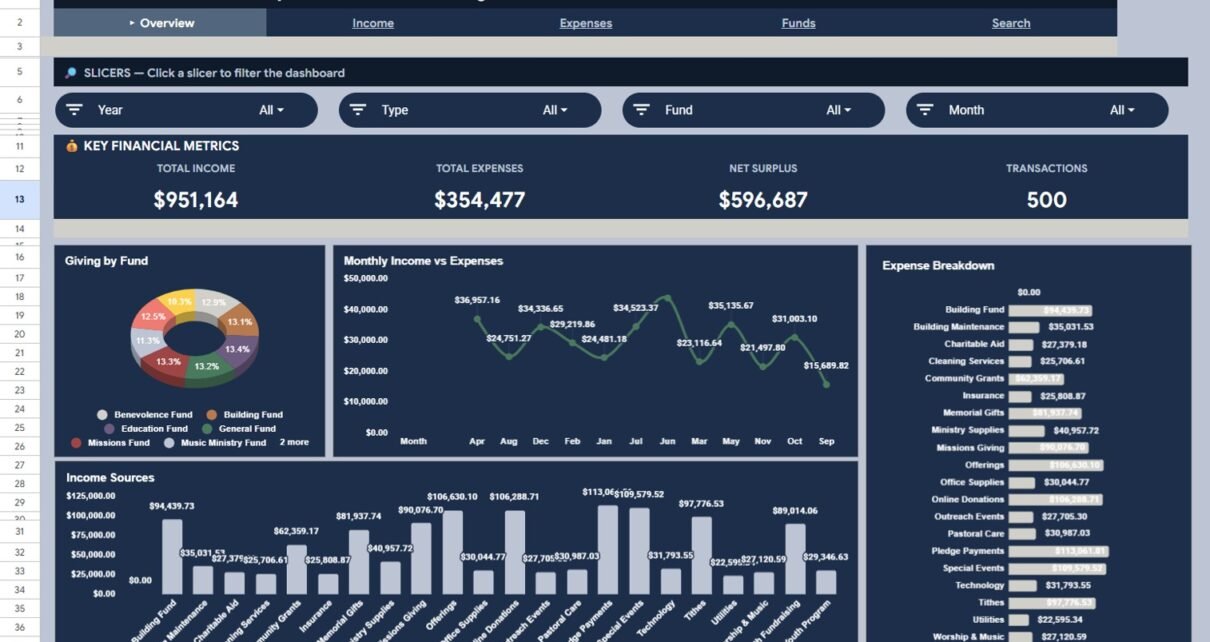
Review church income, expenses, funds, payment methods and individual transactions in one Google Sheets dashboard with KPI cards, slicers, a Transaction ID search and a User Guide.
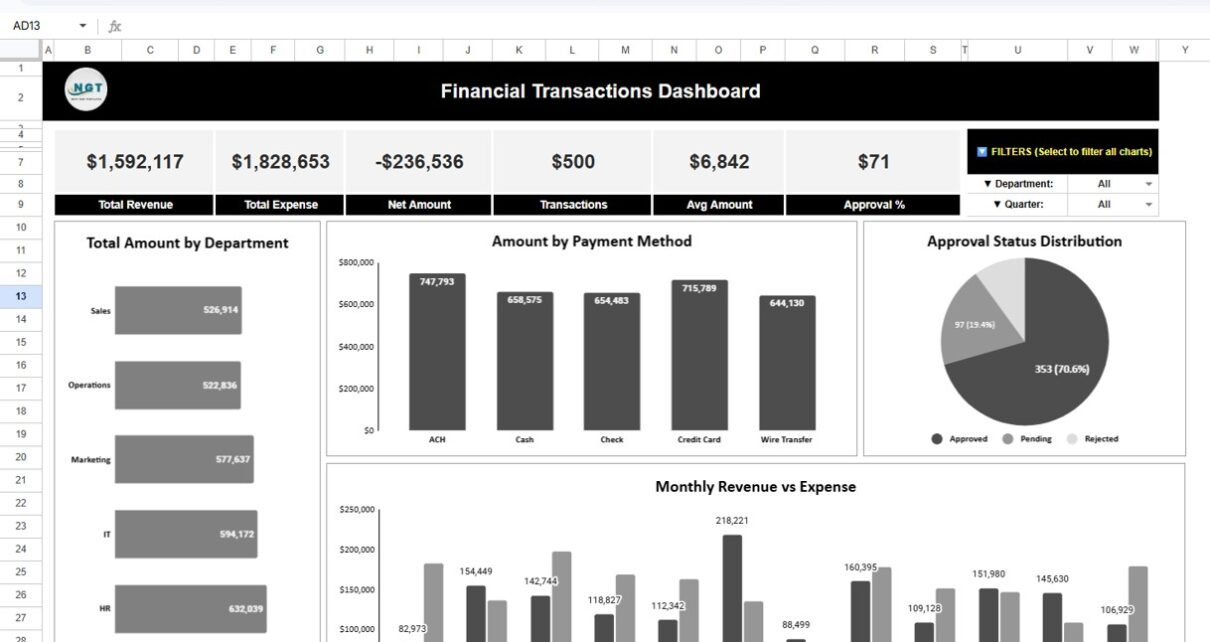
Managing financial transactions is one of the most critical responsibilities for any organization. Businesses handle hundreds or even thousands of financial transactions every month, including revenue entries, expense payments, departmental spending, and approval processes. However, when companies rely on scattered spreadsheets or manual reports, they often struggle to monitor financial activity effectively.Financial Transactions Dashboard in […]