A six-page Google Sheets dashboard for fund-month records: 360 fictional sample records for 30 funds, 18 charts and 15 slicers covering AUM, net flows, returns, Sharpe ratio, drawdown, fees and exposure – a reporting template, not trading or fund-administration software.

Tag: financial dashboard
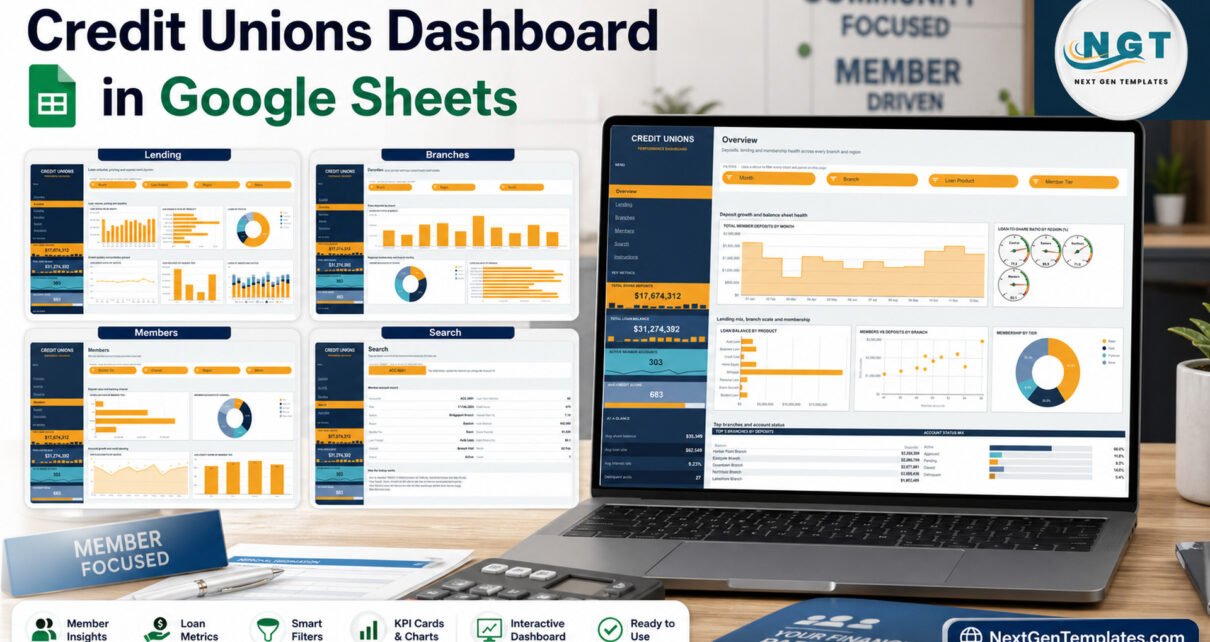
Credit Unions Dashboard in Google Sheets
A six-tab Google Sheets credit union dashboard with 18 chart panels, 15 slicers, loan-to-share gauges by region and an Account ID lookup, built on fictional sample data.
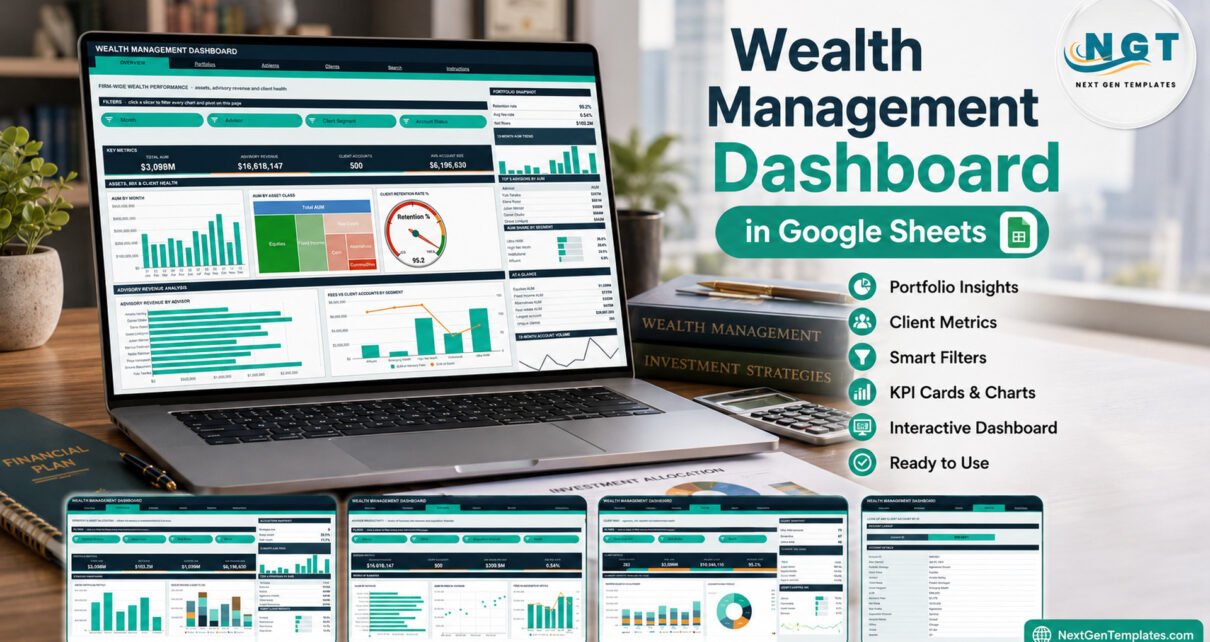
Wealth Management Dashboard in Google Sheets
A six-page Google Sheets dashboard for small wealth and advisory firms: 500 fictional sample accounts, 16 KPI cards, 18 chart panels and 15 slicers covering AUM, advisory fees, net flows and client retention – a reporting template, not advisory software.
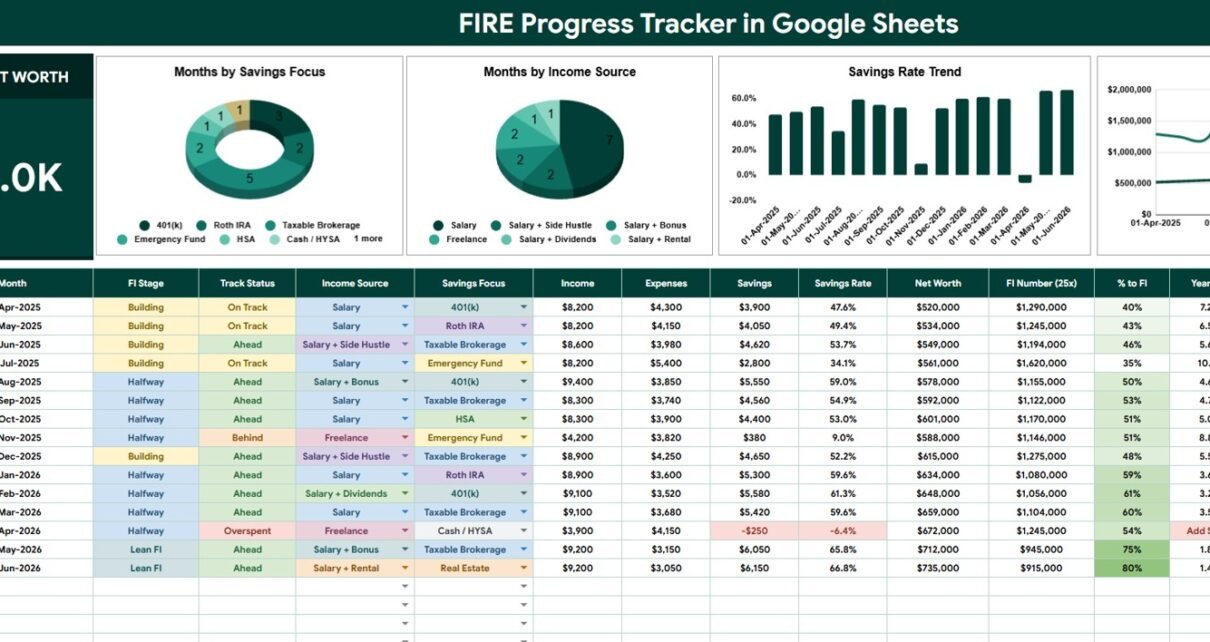
FIRE Progress Tracker in Google Sheets Template
Track net worth, savings rate, FI Number, % to FI, years to FI, runway, income sources, and savings focus with this FIRE Progress Tracker in Google Sheets.
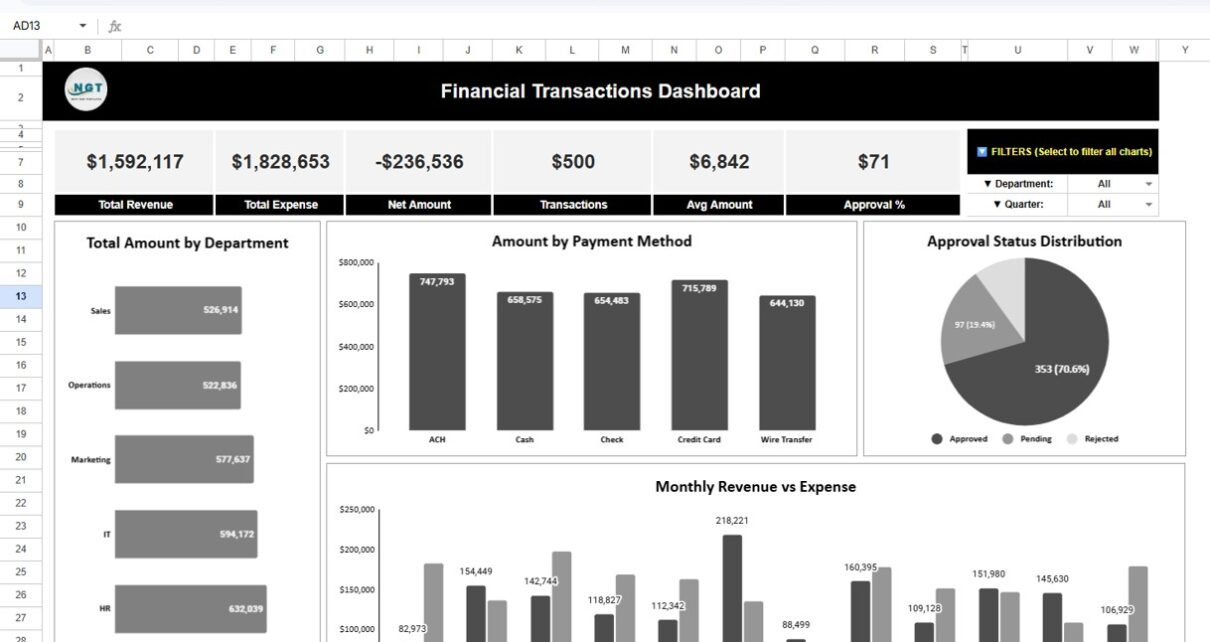
Financial Transactions Dashboard in Google Sheets
Managing financial transactions is one of the most critical responsibilities for any organization. Businesses handle hundreds or even thousands of financial transactions every month, including revenue entries, expense payments, departmental spending, and approval processes. However, when companies rely on scattered spreadsheets or manual reports, they often struggle to monitor financial activity effectively.Financial Transactions Dashboard in […]
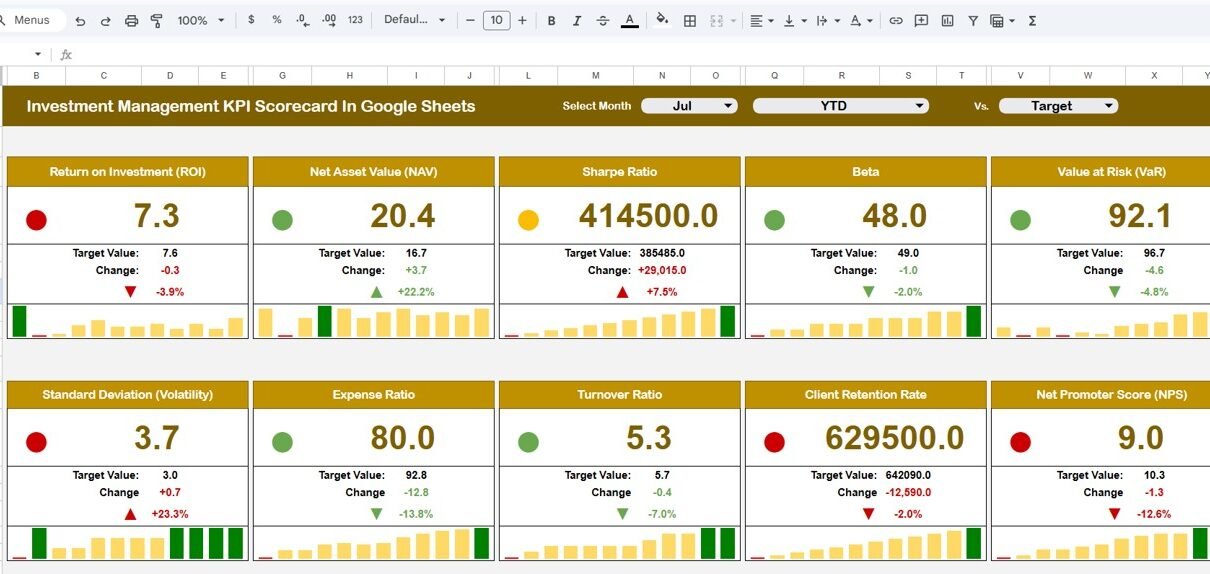
Investment Management KPI Scorecard In Google Sheets
Investment management requires continuous monitoring, accurate performance measurement, and data-driven decision-making. Investment firms, portfolio managers, and financial analysts must evaluate multiple performance indicators regularly to ensure portfolios achieve expected returns while managing risks effectively. However, many organizations still rely on manual spreadsheets that make analysis slow and inconsistent. Therefore, professionals increasingly use automated KPI scorecards […]
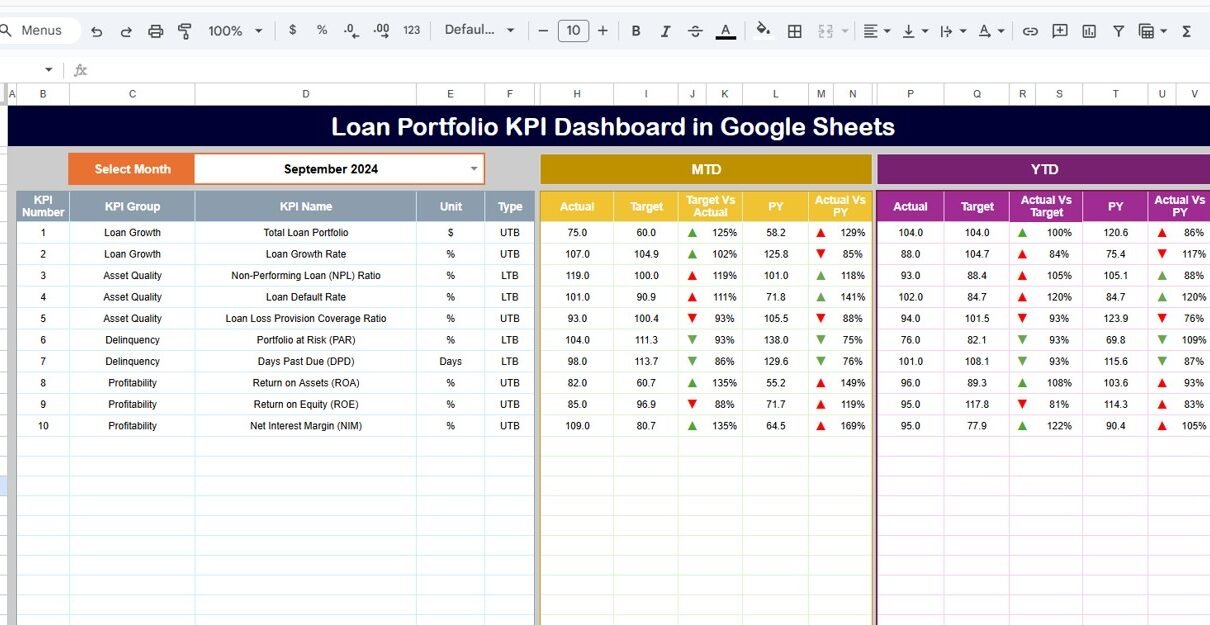
Loan Portfolio KPI Dashboard in Google Sheets
Managing a loan portfolio requires accuracy, visibility, and continuous monitoring. Banks, NBFCs, credit unions, and financial institutions must track loan performance, risk exposure, delinquency, recovery, and profitability on a regular basis. However, when teams rely on scattered reports or manual spreadsheets, decision-making becomes slow and error-prone. That is exactly why a Loan Portfolio KPI Dashboard […]
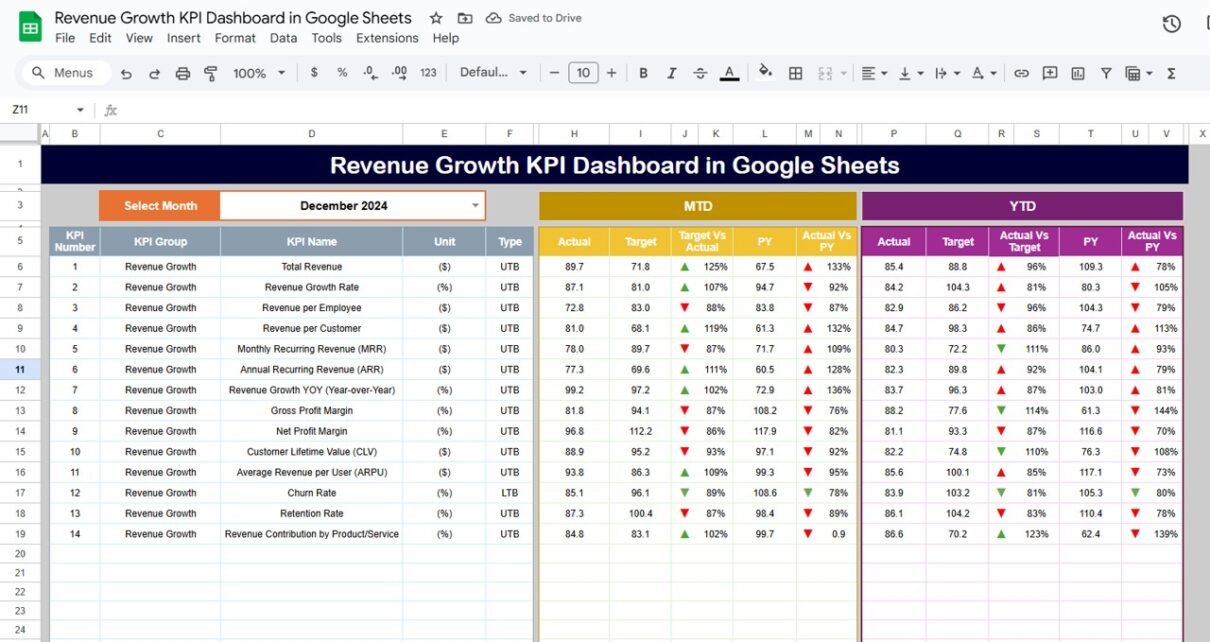
Revenue Growth KPI Dashboard in Google Sheets
Every business wants to grow consistently, improve revenue quality, and understand what drives performance. Because markets shift fast and customer behavior changes often, leaders need real-time insights that support quick and confident decisions. A Revenue Growth KPI Dashboard in Google Sheets does exactly that. It turns raw financial numbers into simple visuals, clear comparisons, and […]
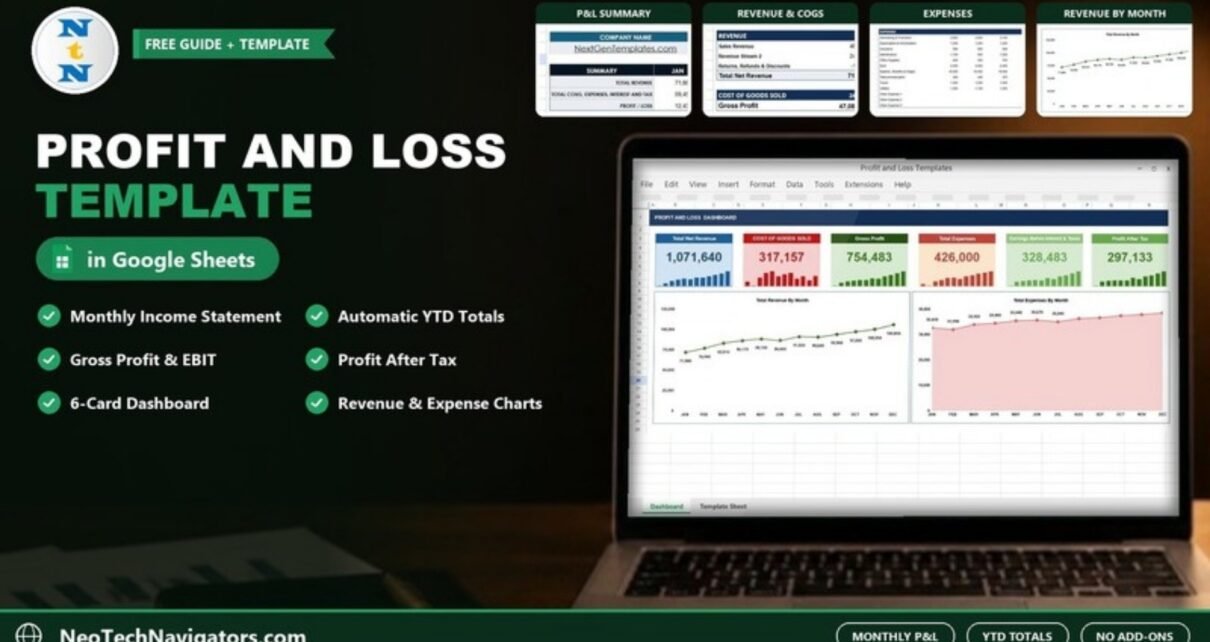
Profit and Loss Templates in Google Sheets
Every business needs a clear view of revenue, expenses, profits, and losses. However, many companies still rely on scattered spreadsheets, manual calculations, or outdated formats. This slows down decision-making and increases the risk of mistakes. Because of this, Profit and Loss Templates in Google Sheets have become extremely popular among small businesses, startups, freelancers, and […]
Income and Expenses Monthly and Yearly View in Google Sheets
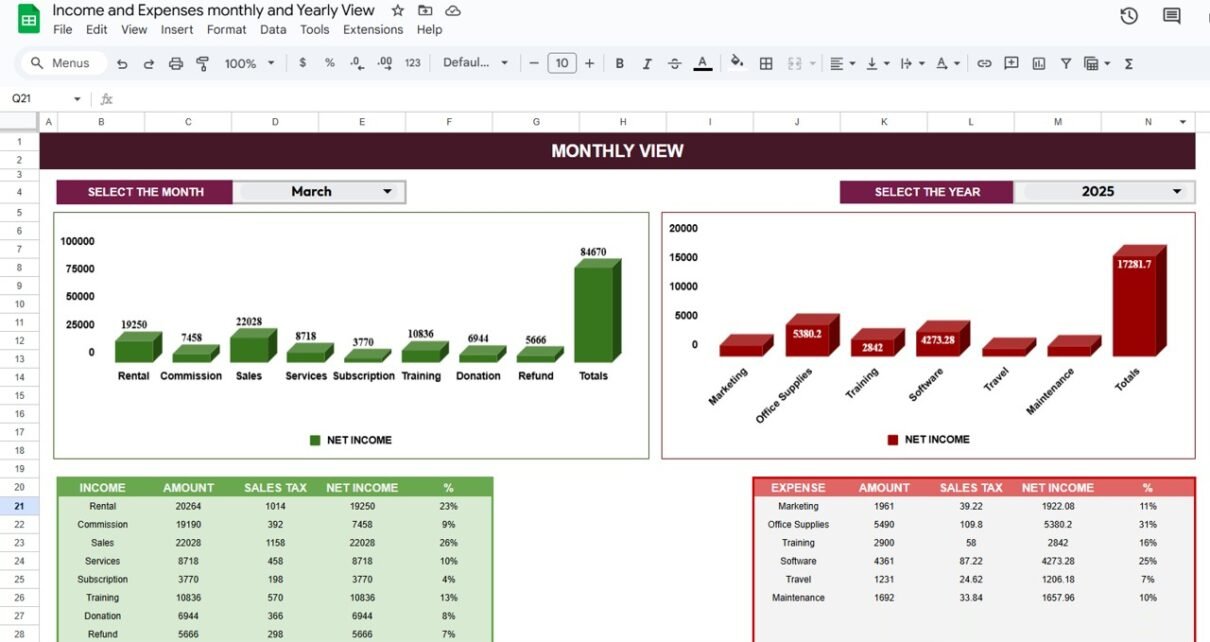
Managing income and expenses is vital for every business and household. The Income and Expenses Monthly and Yearly View in Google Sheets template provides a simple yet powerful way to record, analyze, and visualize financial performance. With monthly and annual breakdowns, it offers instant insights into your financial health.Income and Expenses Monthly and Yearly View […]