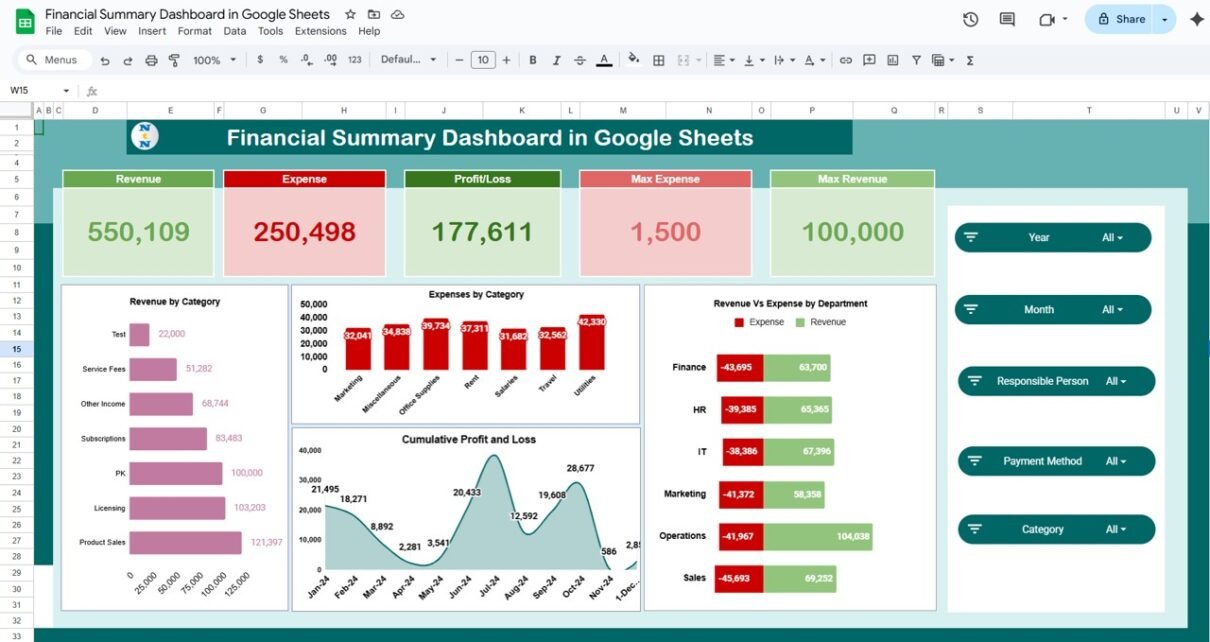
Effective financial management is critical for any organization. The Financial Summary Dashboard in Google Sheets provides a ready-to-use solution for tracking revenue, expenses, and profit in one centralized tool. With interactive charts and cards, this dashboard allows finance teams, managers, and executives to analyze financial performance and make data-driven decisions efficiently. In this article, we […]
Tag: financial dashboard
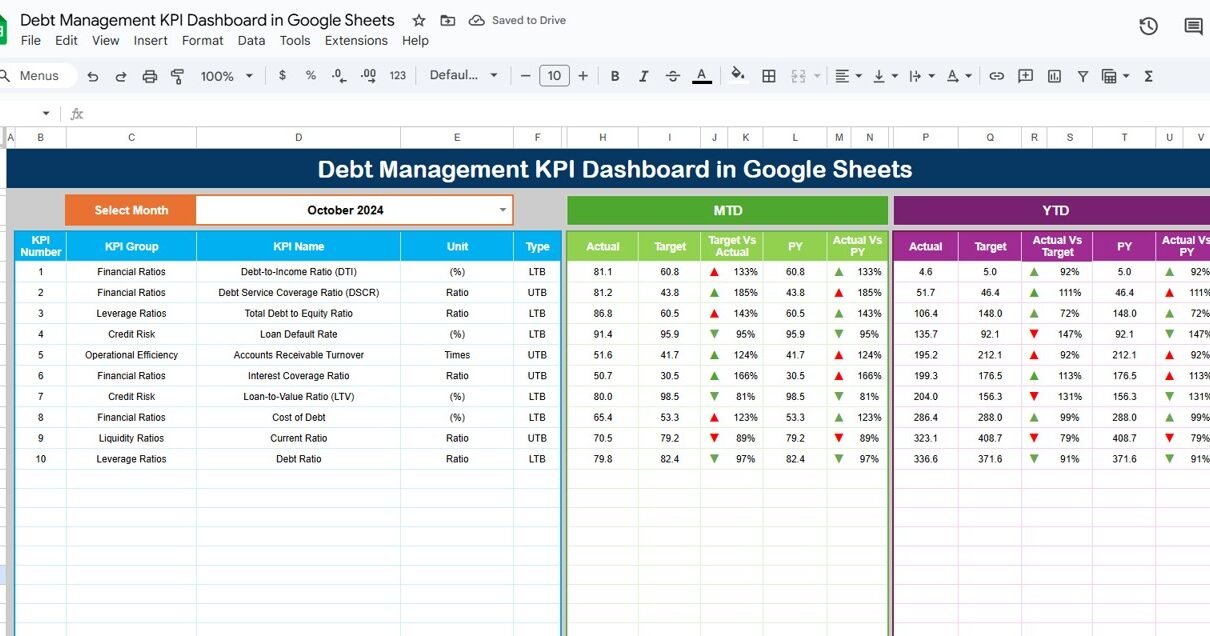
Debt Management KPI Dashboard in Google Sheets
Managing debt effectively is crucial for maintaining financial stability. Whether you’re tracking personal debt or managing a corporate debt portfolio, having a comprehensive overview of key performance indicators (KPIs) can provide valuable insights into your financial health. The Debt Management KPI Dashboard in Google Sheets is a powerful tool designed to help you monitor and […]
Insurance KPI Dashboard in Google Sheets
In the insurance industry, tracking key performance indicators (KPIs) is vital for evaluating business performance, identifying areas for improvement, and making informed decisions. The Insurance KPI Dashboard in Google Sheets is a powerful tool designed to help insurance companies monitor and track essential metrics for better decision-making. In this article, we will explore the Insurance […]
Income Expense Dashboard in Google Sheets
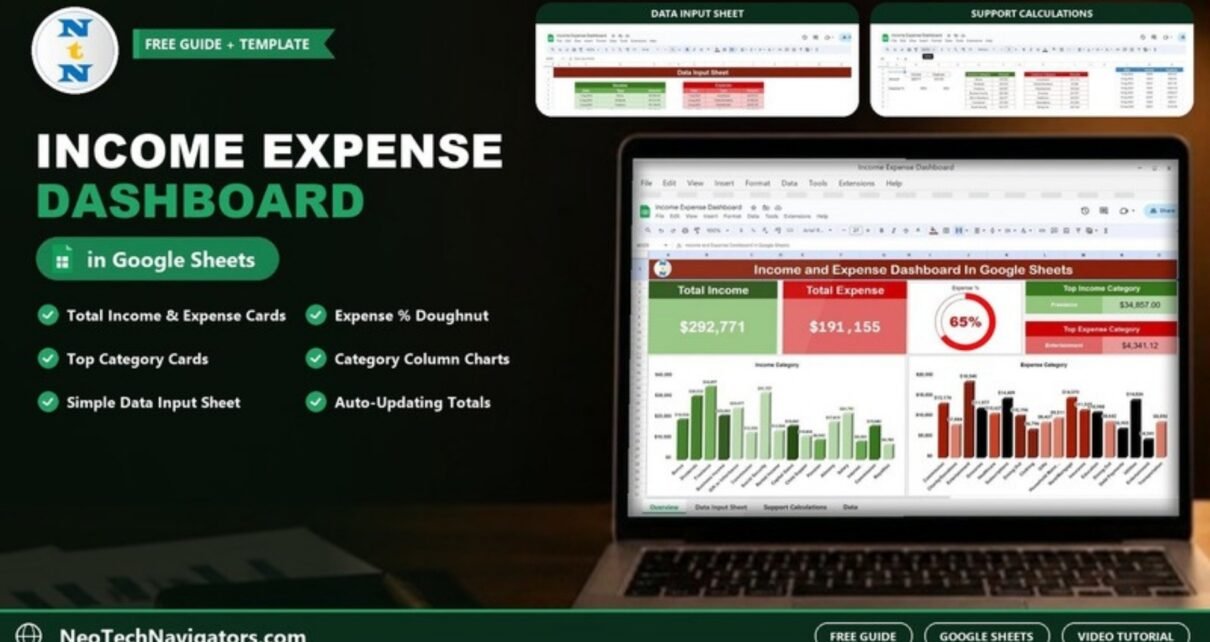
A ready-made Income Expense Dashboard in Google Sheets with total income and expense cards, an expense percentage doughnut and category charts. See what each tab does and how to load your own data.