Hotel and Hospitality Revenue Dashboard in HTML is a powerful, interactive, browser-based dashboard template designed for hotel managers, revenue analysts, and hospitality professionals who want to monitor property performance, track bookings, analyze revenue streams, and measure guest satisfaction — all from a single self-contained HTML file. This template includes 5 professionally designed dashboard pages covering Overview, Revenue Breakdown, Guest Analysis, Property Performance, and a detailed Data View page with search, sort, pagination, and CSV export. Simply unzip the file, open index.html in any modern browser like Chrome, Firefox, or Edge, and start analyzing your hotel data instantly.
Download the Hotel and Hospitality Revenue Dashboard in HTML
If you manage a single boutique hotel, a chain of properties, or a resort business, the Hotel and Hospitality Revenue Dashboard in HTML gives you a complete analytics solution without installing any software. Replace the sample data with your own booking records and every chart, KPI card, and filter updates automatically — making it one of the most versatile HTML Dashboard Templates available today.
Key Features of Hotel and Hospitality Revenue Dashboard in HTML
- 5 Interactive Dashboard Pages – Overview, Revenue Breakdown, Guest Analysis, Property Performance, and Data View give you complete visibility into your hotel operations.
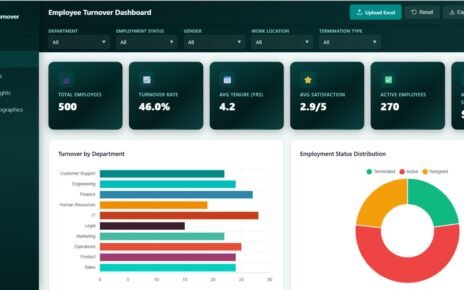
- 6 Real-Time KPI Cards – Track Total Revenue, Total Bookings, Average Room Rate, Average Nights Stayed, Average Satisfaction, and Occupancy Rate at a glance.
- Dynamic Slicers and Filters – Filter data by property, room type, booking channel, guest type, and more across all pages.
- Revenue Composition Analysis – Break down revenue into Room, F&B, Spa, and Other categories by property, room type, season, and guest type.
- Guest Satisfaction Monitoring – Analyze satisfaction scores, loyalty tiers, and guest type distribution to improve guest experience.
- Property Performance Comparison – Compare revenue, nights stayed, booking channels, cancellation rates, and monthly trends across multiple properties.
- Data Explorer with CSV Export – Search, sort, paginate, and export your booking data to CSV from the Data View page.
- Browser-Based – No software installation required. Runs in Chrome, Firefox, Edge, or Safari.
Dashboard Pages Explained
1. Overview Page
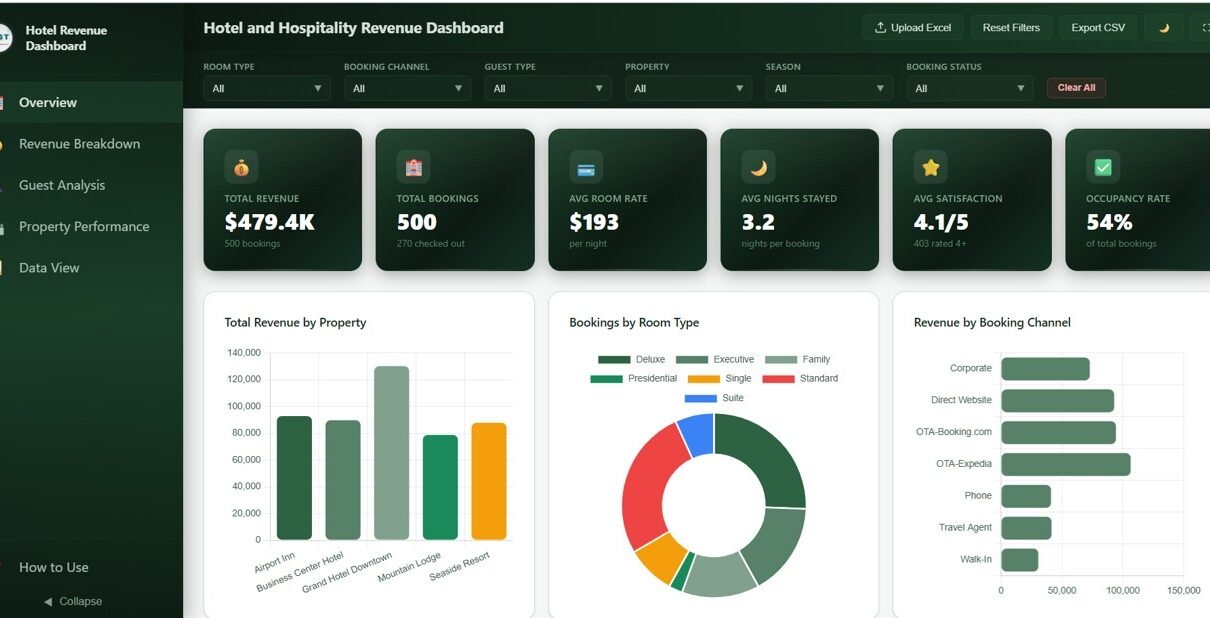
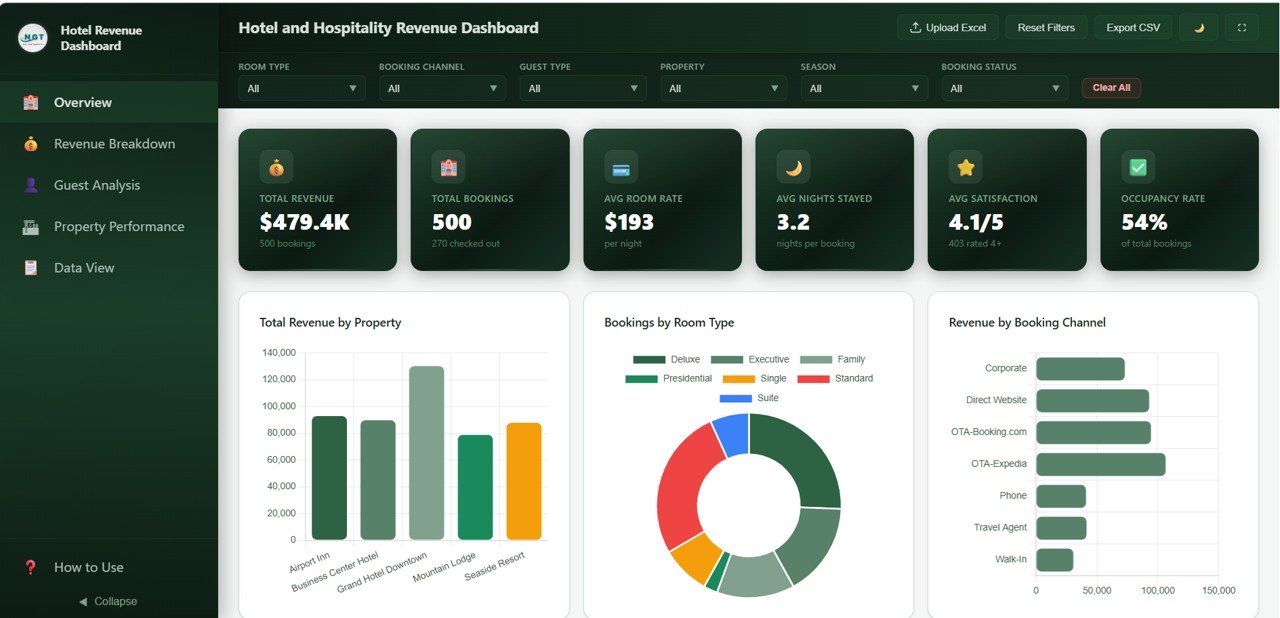
The Overview page is the command center of the Hotel and Hospitality Revenue Dashboard in HTML. At the top, you see 6 KPI cards that provide an instant snapshot of your hotel’s key metrics: Total Revenue, Total Bookings, Average Room Rate, Average Nights Stayed, Average Satisfaction, and Occupancy Rate. These cards give hotel managers and revenue analysts immediate clarity on how the business is performing without drilling into detailed reports.
Below the KPI cards, interactive charts visualize Total Revenue by Property showing how each hotel location contributes to overall revenue. The Bookings by Room Type chart breaks down reservation volumes across room categories. Revenue by Booking Channel helps you understand which channels like direct bookings, OTAs, or corporate accounts drive the most revenue. The Booking Status Distribution chart shows the proportion of confirmed, checked-out, and cancelled bookings. Finally, the Monthly Revenue Trend tracks revenue patterns over time to help spot seasonal peaks and dips. Multiple slicers are available on this page to apply quick filters across the entire dashboard.
Hotel and Hospitality Revenue Dashboard in HTML – Overview
2. Revenue Breakdown
The Revenue Breakdown page dives deeper into revenue segmentation for your hotel business. The Revenue Composition chart displays the breakdown of total revenue into Room Revenue, F&B Revenue, Spa Revenue, and Other Revenue — helping you understand which revenue streams contribute the most to your bottom line. The Average Room Rate by Room Type chart compares pricing across different room categories so you can evaluate your pricing strategy.
Additional charts on this page include Revenue by Season which uncovers seasonal revenue patterns to optimize pricing and promotions, Revenue by Guest Type which segments revenue by business, leisure, group, and other guest categories, and Revenue by Property and Room Type which cross-analyzes revenue performance across both dimensions simultaneously. This page is essential for revenue managers who want to maximize hotel profitability through data-driven pricing and channel optimization.
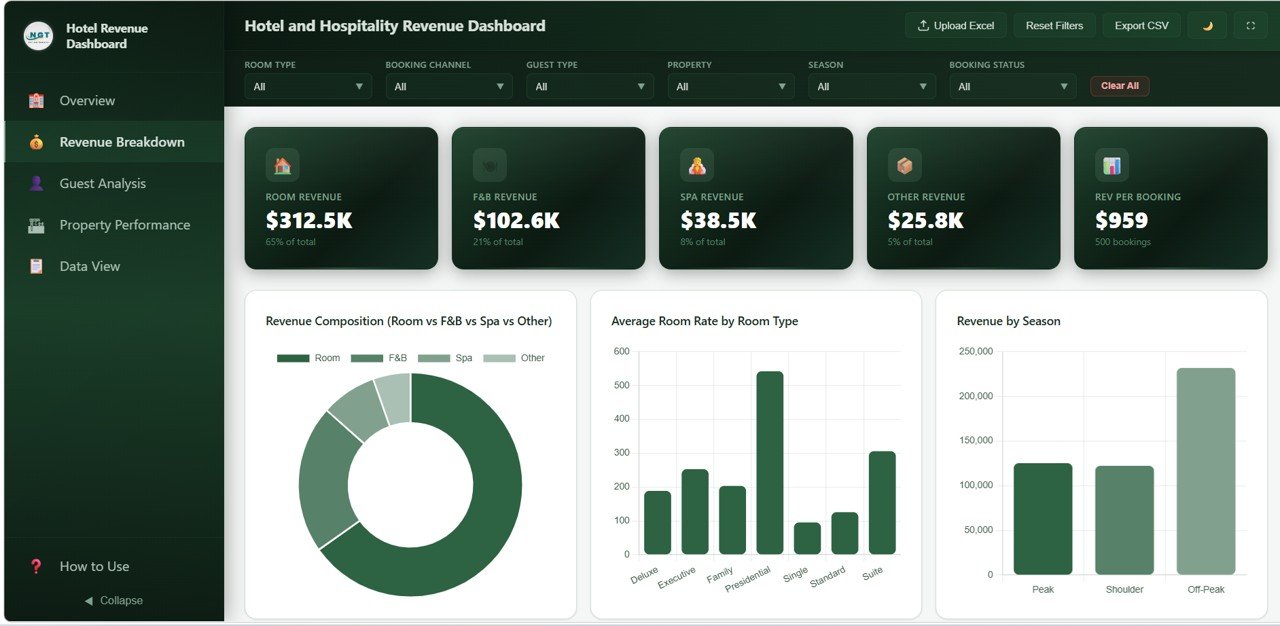
Revenue Breakdown
3. Guest Analysis
The Guest Analysis page helps you understand your guest segments and satisfaction levels in detail. The Bookings by Guest Type chart shows the distribution of reservations across different guest categories like business travelers, leisure guests, group bookings, and more. The Satisfaction Score Distribution chart visualizes how guest ratings are spread across your scoring scale, giving you a quick sense of overall service quality.
The Loyalty Tier Breakdown chart shows how many guests fall into each loyalty program tier — useful for evaluating loyalty program effectiveness and identifying upselling opportunities. The Average Satisfaction by Property chart lets you compare guest experience scores across hotel locations to spot underperforming properties. Finally, Average Nights Stayed by Guest Type reveals which guest segments tend to book longer stays, helping you tailor packages and promotions accordingly.
Download the Hotel and Hospitality Revenue Dashboard in HTML
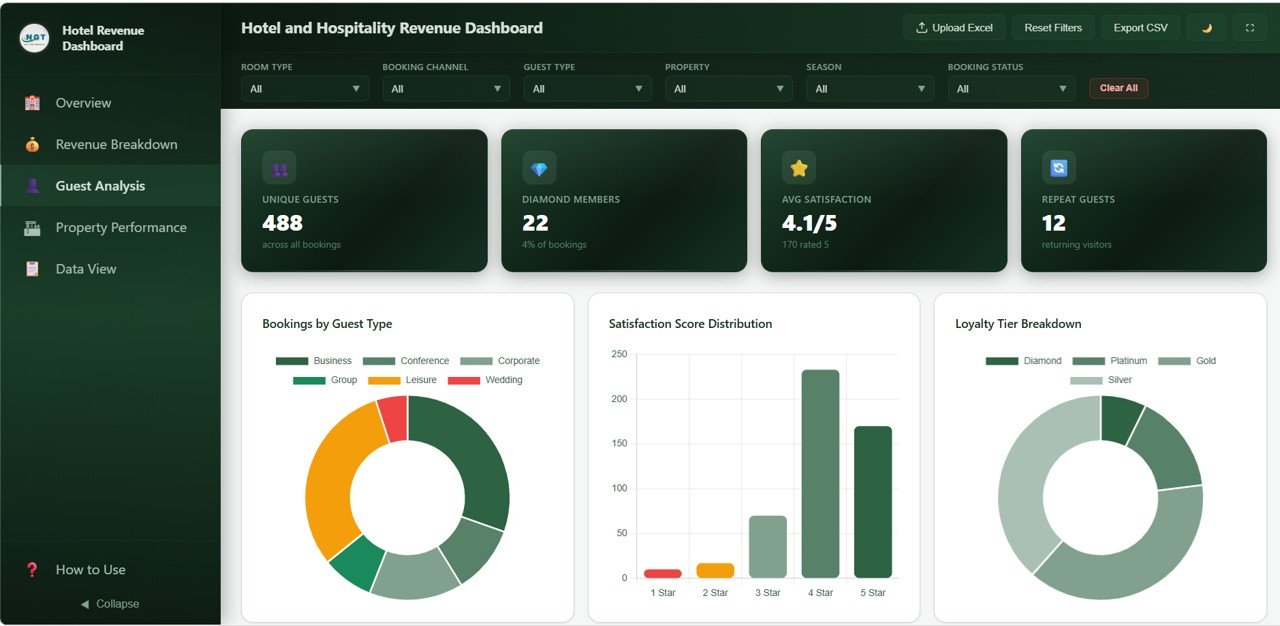
Guest Analysis
4. Property Performance
The Property Performance page enables multi-property comparison at a glance. Total Revenue by Property ranks your hotel locations by total revenue generation, making it easy to identify top performers. Average Nights Stayed by Property shows which locations attract longer-stay guests. The Booking Channel by Property chart reveals how booking sources vary across your properties — some might rely heavily on OTAs while others drive more direct bookings.
The Cancellation Rate by Property chart is critical for operations teams — it highlights which locations experience the highest cancellation volumes and may need improved overbooking strategies or deposit policies. Monthly Bookings by Property tracks booking volume trends over time across all properties, helping you plan staffing, inventory, and marketing campaigns seasonally.
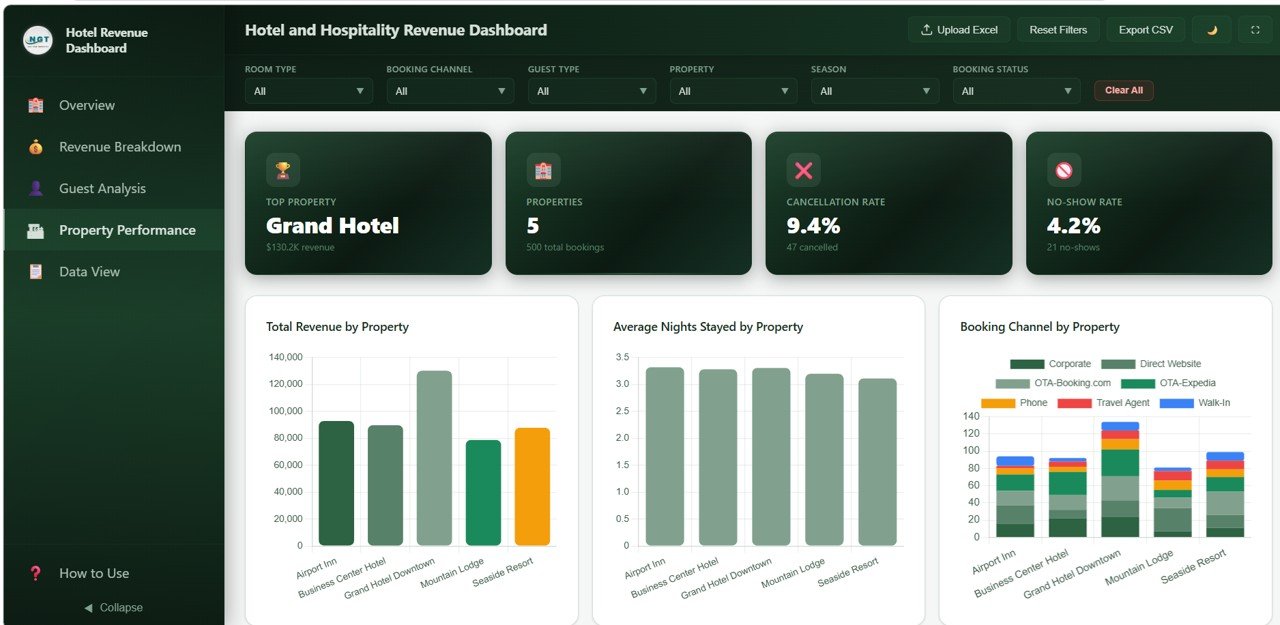
Property Performance
5. Data View
The Data View page is your detailed data table where you can see all the raw booking records powering the dashboard. It includes search functionality to quickly find specific bookings, sort capabilities on any column, pagination for easy navigation through large datasets, and a CSV export button to download the filtered data for further analysis in Excel or other tools. This page is particularly useful for operations teams who need to investigate individual bookings or export subsets of data for reporting.
Download the Hotel and Hospitality Revenue Dashboard in HTML
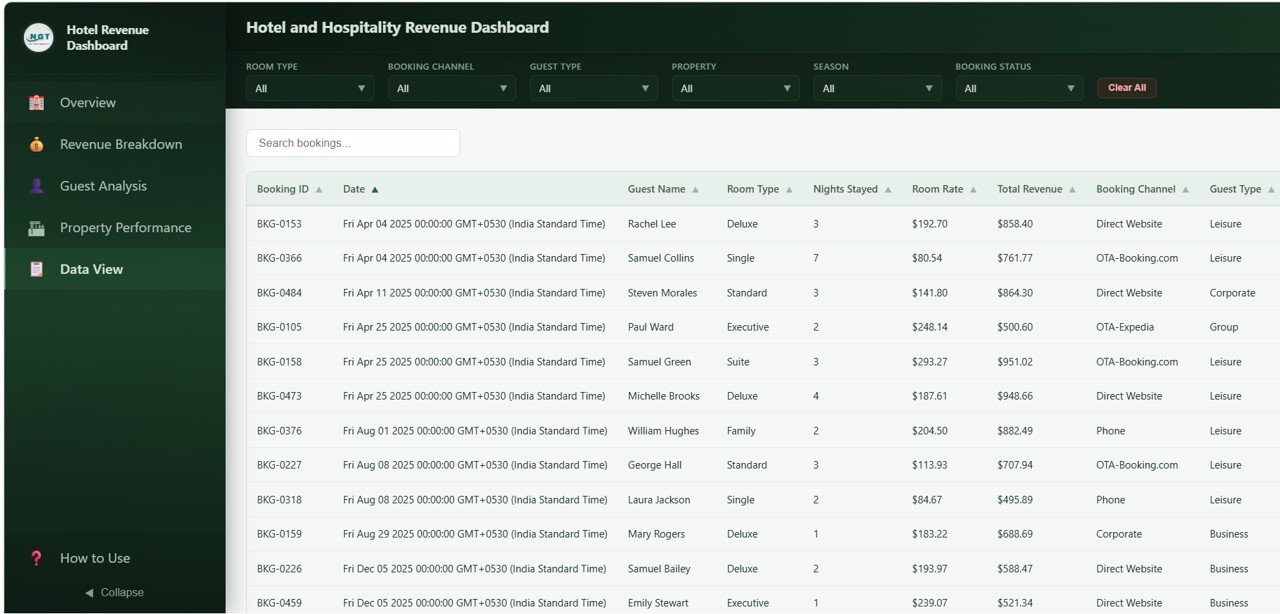
Data View Tab
Advantages of Hotel and Hospitality Revenue Dashboard in HTML
- Zero Software Cost – Unlike Power BI or Excel-based solutions, this dashboard requires no software licenses. It runs in any modern web browser for free.
- Instant Deployment – No setup, configuration, or database connection needed. Just unzip and open the file.
- Multi-Property Ready – Built-in property comparison features make it ideal for hotel chains and multi-location operators.
- Complete Revenue Visibility – Track Room, F&B, Spa, and Other revenue streams in one unified view.
- Guest Intelligence – Understand satisfaction patterns, loyalty tier distribution, and guest type behavior to improve service delivery.
- Data Portability – CSV export from the Data View page means you can always take your data to other tools for further analysis.
Opportunities for Improvement
- Forecasting Module – A future version could include revenue and occupancy forecasting based on historical trends.
- Competitor Benchmarking – Adding industry benchmark data would help hotels compare their performance against market averages.
- Real-Time Data Integration – Connecting to a live PMS (Property Management System) API would enable real-time dashboard updates.
- Mobile-First Layout – While the dashboard is responsive, a dedicated mobile-optimized view would improve the experience on smaller screens.
- Download the Hotel and Hospitality Revenue Dashboard in HTML
Best Practices
- Update Data Regularly – Replace sample data with actual booking records weekly or monthly for the most accurate insights.
- Use Filters Strategically – Apply property and date range filters to focus on specific time periods or locations during management reviews.
- Monitor Cancellation Trends – Use the Property Performance page to track cancellation rates and take corrective action before they impact revenue.
- Track Guest Satisfaction Weekly – Regular monitoring of satisfaction scores helps catch service issues before they escalate into negative reviews.
- Export and Share – Use the CSV export feature to share filtered data with department heads who may not access the dashboard directly.
Explore Relevant Templates
Click here to Purchase Hotel and Hospitality Revenue Dashboard in HTML
If you are looking for the same dashboard on other platforms, check out these related templates:
- Hotel and Hospitality Revenue Dashboard in Excel – The Excel version with pivot tables and slicers.
- Hotel and Hospitality Revenue Dashboard in Power BI – Advanced Power BI version with drill-through capabilities.
- Hotel Hospitality Revenue Dashboard in Google Sheets – Google Sheets version with built-in formulas and charts.
- Hospitality Dashboard in HTML – A complementary HTML dashboard for broader hospitality analytics.
- Rental Property Investment Dashboard in HTML – HTML dashboard for rental property investment tracking.
Explore our complete collection of HTML Dashboard Templates for every industry.
Frequently Asked Questions
Download the Hotel and Hospitality Revenue Dashboard in HTML
What KPIs does the Hotel and Hospitality Revenue Dashboard in HTML track?
The Hotel and Hospitality Revenue Dashboard in HTML tracks 6 key performance indicators on the Overview page: Total Revenue, Total Bookings, Average Room Rate, Average Nights Stayed, Average Satisfaction, and Occupancy Rate. Additional analysis covers revenue composition by category, revenue by season, guest satisfaction by property, loyalty tier breakdown, cancellation rates, and monthly booking trends across 5 dedicated dashboard pages.
Do I need any software to use this HTML dashboard?
No. This dashboard runs entirely in your web browser. Simply unzip the downloaded file and open index.html in Chrome, Firefox, Edge, or Safari. No installation, plugins, or software licenses are required.
Can I track multiple hotel properties in this dashboard?
Yes. The dashboard includes a dedicated Property Performance page that compares Total Revenue, Average Nights Stayed, Booking Channels, Cancellation Rates, and Monthly Bookings across multiple properties. Built-in slicers let you filter by individual property.
What is the best HTML dashboard template for tracking hotel revenue?
The Hotel and Hospitality Revenue Dashboard in HTML from NextGenTemplates is one of the best options available. It includes 5 interactive pages covering revenue breakdown, guest analysis, property performance, and a data explorer with CSV export — all in a professionally designed, browser-based template.
Download the Hotel and Hospitality Revenue Dashboard in HTML
Can I customize the data in this HTML dashboard?
Yes. Replace the sample data with your own hotel booking records and all charts, KPIs, and filters update automatically. The Data View page also lets you search, sort, and export your data to CSV.
Is this dashboard available in other platforms like Excel or Power BI?
Yes. NextGenTemplates offers the same Hotel and Hospitality Revenue Dashboard in Excel, Power BI, and Google Sheets formats.
Conclusion
The Hotel and Hospitality Revenue Dashboard in HTML is a comprehensive, browser-based analytics solution that gives hotel managers, revenue analysts, and hospitality professionals everything they need to track revenue, bookings, guest satisfaction, and property performance from one unified interface. With 5 interactive dashboard pages, 6 KPI cards, dynamic slicers, and a full data explorer with CSV export, this template transforms raw booking data into actionable insights without requiring any software installation.
Whether you operate a single property or a portfolio of hotels, this dashboard helps you make smarter, data-driven decisions that boost revenue and improve guest experiences. Download the Hotel and Hospitality Revenue Dashboard in HTML today and start optimizing your hotel business!
Visit our YouTube channel for step-by-step video tutorials: Youtube.com/@NeoTechNavigators