Brands now allocate an average of 20% of their digital marketing budget to influencer campaigns — yet 63% of marketing teams still track campaign performance in disconnected spreadsheets or rely on expensive SaaS platforms that charge $800–$3,600 per month. The Influencer Campaign Dashboard in Google Sheets changes that: 4 headline KPIs, 16 pre-built charts, slicer-driven filtering across 6 interactive pages, all for a single one-time purchase. According to Google Sheets documentation, pivot-table-driven dashboards update in real time as new rows are added — no formula maintenance required.
This template is built for digital marketing managers, social media agencies, and brand teams who need clear influencer ROI reporting without paying per-user fees. In this post, we walk through every page, chart, and feature so you can decide if this dashboard fits your workflow.
Key Features of Influencer Campaign Dashboard in Google Sheets
Click here to Purchase the Influencer Campaign Dashboard in Google Sheets
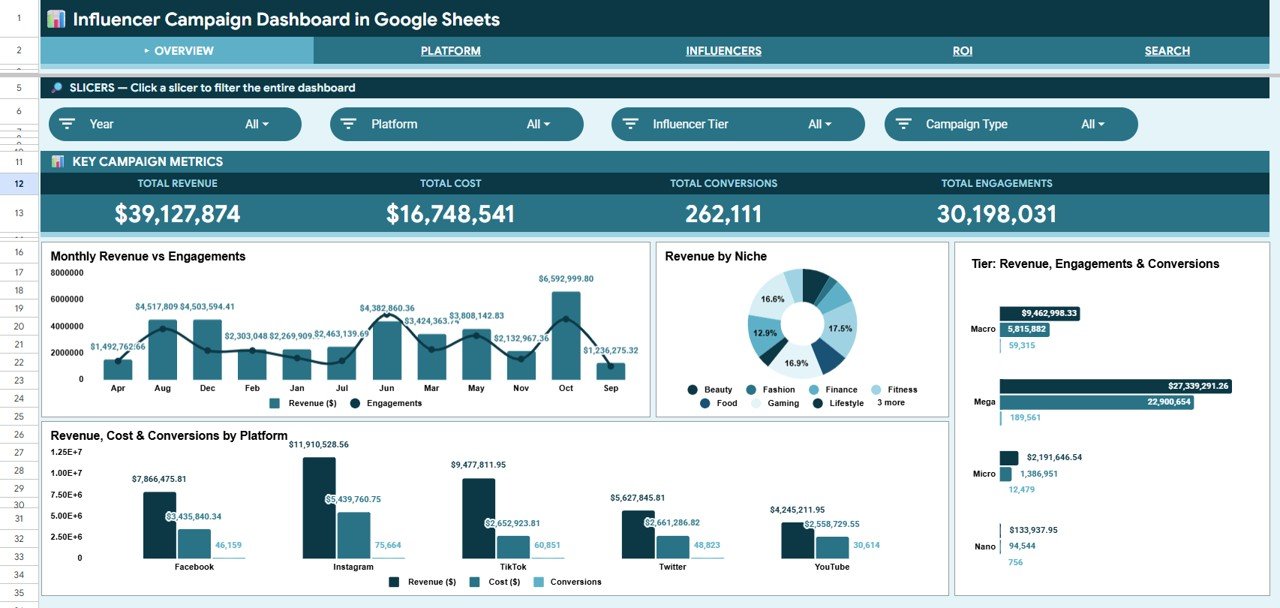
The Influencer Campaign Dashboard in Google Sheets includes the following capabilities that marketing teams will find immediately useful:Influencer Campaign Dashboard in Google Sheets
- 4 headline KPI cards — Total Revenue, Total Cost, Total Conversions, and Total Engagements update automatically as you add campaign records to the Data sheet.
- 16 pre-built charts across 4 analysis pages — This dashboard tracks campaign performance across Platform, Influencer, and ROI dimensions, giving teams a complete 360° picture without writing a single formula.
- Multiple slicer controls — Filter every KPI and chart simultaneously by Platform, Niche, Influencer Tier, or Campaign Type with a single click from the Overview page.
- Influencer Tier analysis — Revenue, Cost, Engagements, and Conversions broken down by Nano, Micro, Macro, and Mega tiers so you can see which tier category delivers the strongest return per dollar spent.
- Campaign Search page — Select any Campaign ID from a dropdown to instantly surface all 13 data fields: Platform, Influencer Name, Tier, Niche, Content Type, Reach, Impressions, Engagements, Clicks, and Conversions.
- Pivot-table backend — All 16 charts and 4 KPI cards are powered by pivot tables hidden from Column Z onward. Add data to the Data sheet, click Refresh All, and every metric updates automatically.
- Browser-based accessibility — Works in Chrome, Firefox, Safari, and the Google Sheets mobile app with no software installation required.
Dashboard Pages Explanation
1. Overview Page
The Overview page opens with four KPI cards at the top of the sheet: Total Revenue, Total Cost, Total Conversions, and Total Engagements — each pulling directly from pivot table cells. Four charts below give a campaign-wide analysis: Monthly Revenue and Engagements by Month (trend), Revenue by Niche (horizontal bar), Revenue/Engagements/Conversions by Tier (grouped column), and Revenue/Cost/Conversions by Platform (stacked column). Multiple slicers sit in a dedicated filter row, letting you drill into any combination of Platform, Niche, Tier, or Campaign Type instantly.
Overview Page – KPI Cards, Monthly Trends, and Slicer Filters
2. Platform Page
The Platform page provides dedicated analysis by channel: Monthly Revenue by Platform (line chart for trend comparison), Total Reach by Platform (bar chart for audience size), Revenue by Content Type (to see which content format drives revenue), and Impressions, Engagements, and Clicks by Platform (triple metric view for engagement quality benchmarking).
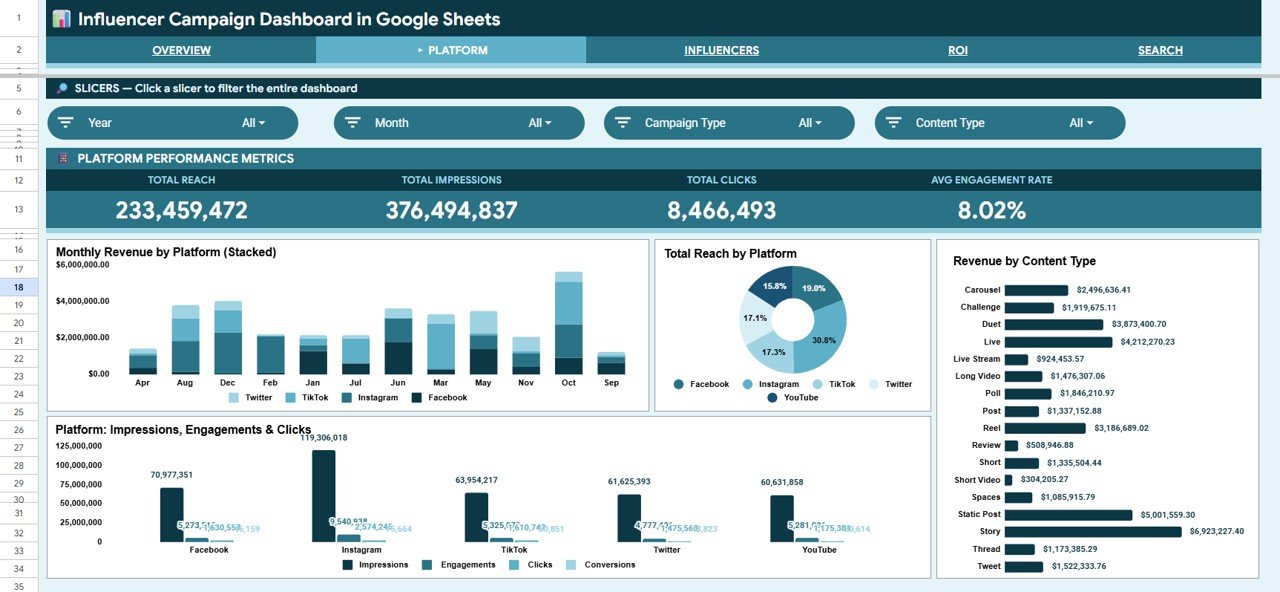
Platform Page – Revenue, Reach, and Engagement by Channel
3. Influencers Page
The Influencers page goes deep on creator performance: Revenue/Cost/Engagements/Conversions by Tier (to benchmark Nano vs. Macro ROI), Top Influencers by Revenue (ranked bar chart), Revenue and Engagements by Niche (to find high-performing content niches), and Tier Reach by Platform (to see where each tier has the strongest audience presence).
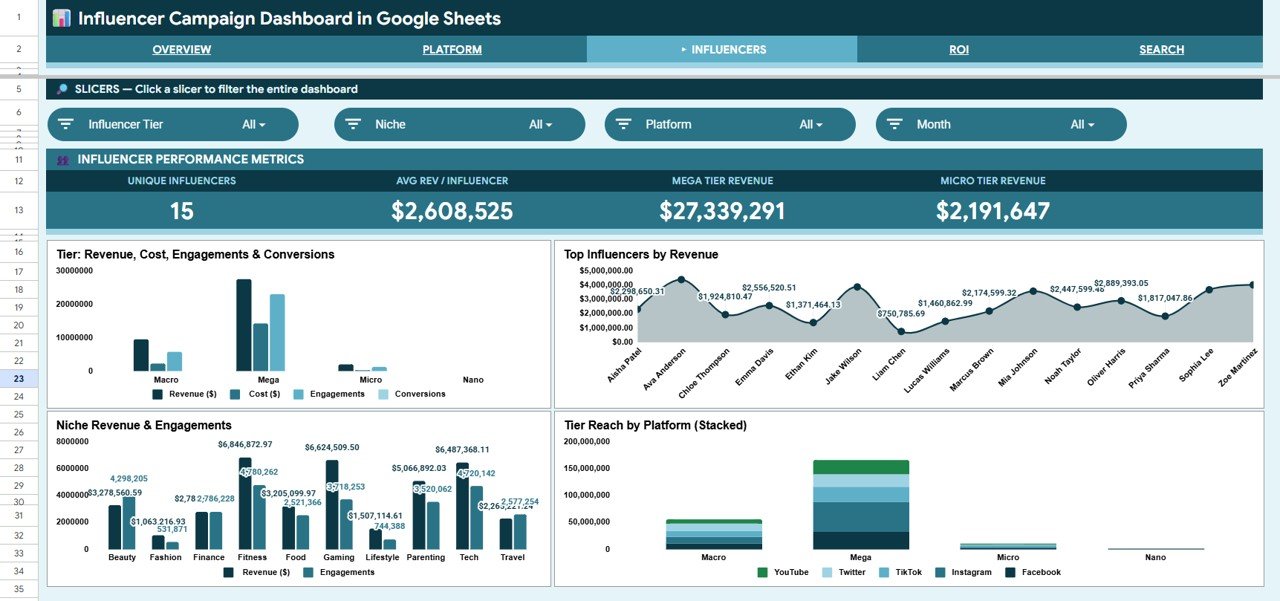
Influencers Page – Tier Comparison and Top Creator Rankings
4. ROI Page
The ROI page answers the budget justification question directly: Revenue and Cost by Platform (side-by-side comparison), Monthly Revenue and Cost Trend (to spot over-spend periods), Revenue/Cost/Conversions by Campaign Type (to see which campaign formats pay off), and Revenue and Cost by Niche (to identify the highest-margin content categories).
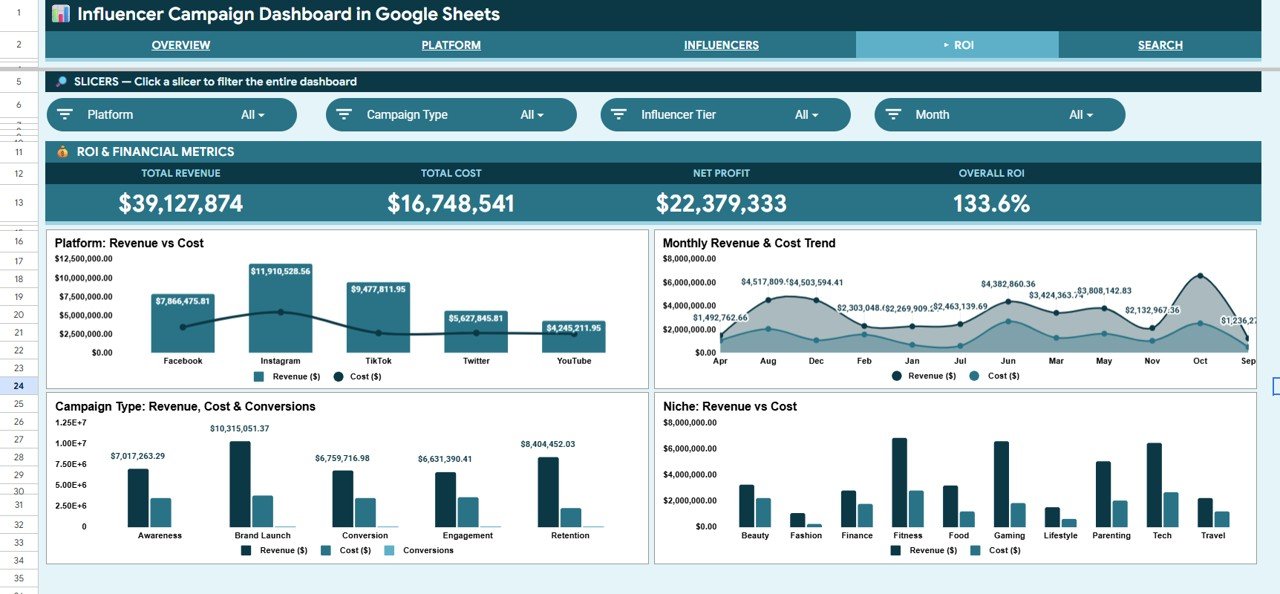
ROI Page – Revenue vs. Cost Analysis Across Platforms and Niches
5. Search Page
The Search page contains a Campaign ID dropdown that instantly displays all 13 fields for the selected record: Campaign ID, Date, Platform, Campaign Type, Influencer Name, Influencer Tier, Niche, Content Type, Reach, Impressions, Engagements, Clicks, and Conversions. Useful for campaign audits, client reporting, and individual influencer performance reviews.
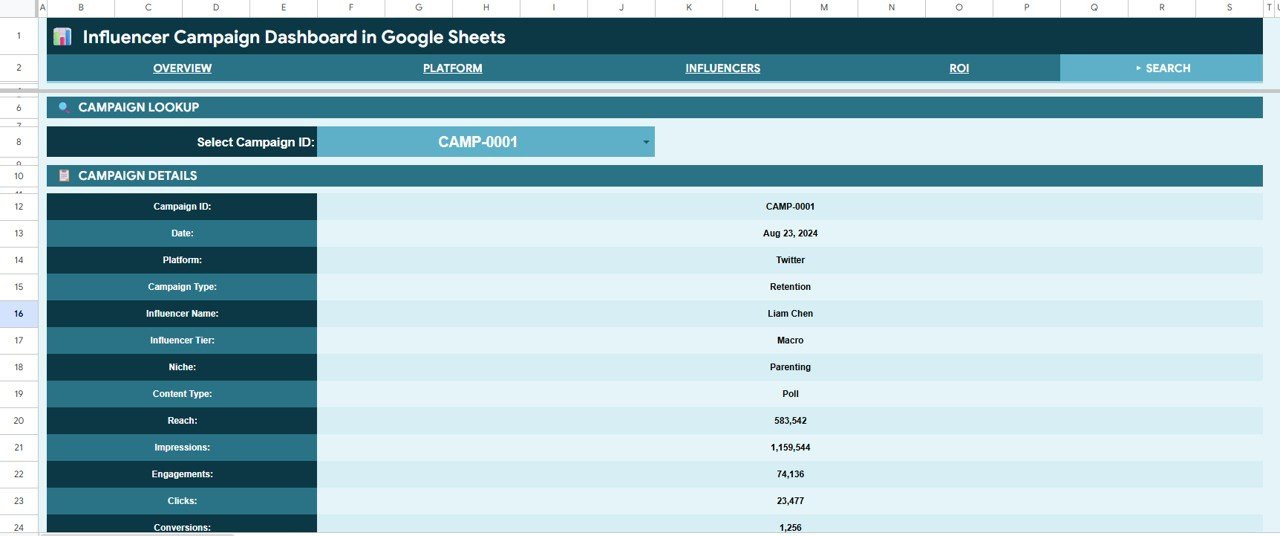
Search Page – Campaign ID Lookup with 13 Data Fields
6. Data Sheet
The Data sheet is the single input source for all dashboard pages. Enter campaign records in the structured column format and every chart, KPI card, and search lookup updates on the next pivot refresh. The column headers define the 13 tracked fields, and dynamic SORT/UNIQUE formulas in the Search page ensure dropdown options stay current automatically.
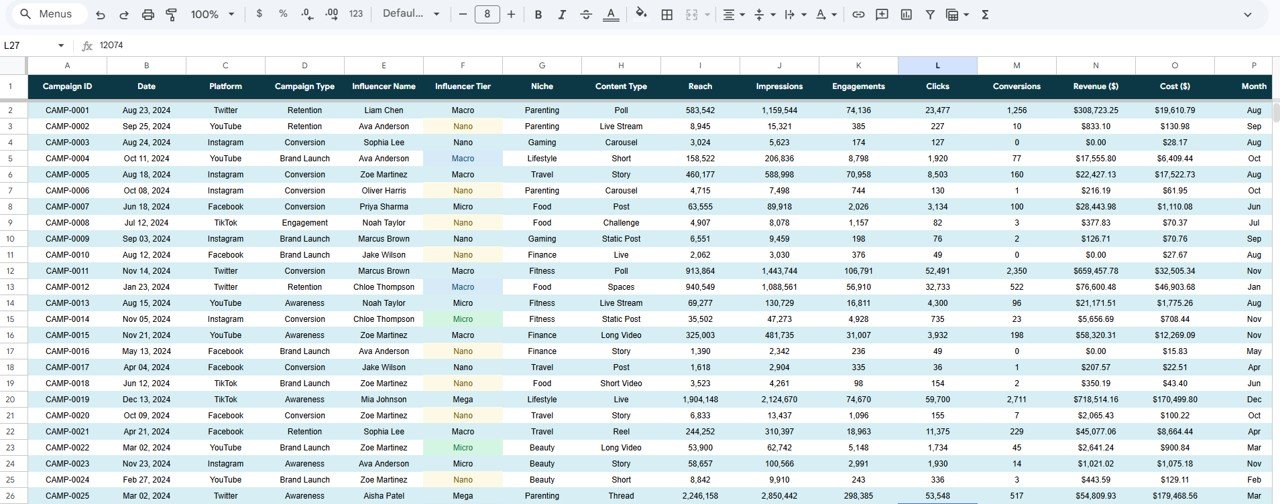
Data Sheet – Structured Input Table for All Campaign Records
Influencer Campaign Dashboard in Google Sheets vs. Excel Dashboard vs. HubSpot Marketing Hub — Feature Comparison
| Feature | Influencer Campaign Dashboard (Google Sheets) | Microsoft Excel Dashboard | HubSpot Marketing Hub |
|---|---|---|---|
| Cost | $9.99 one-time | Requires MS Office license | $800–$3,600/month |
| Platform | ✅ Browser-based, any device | Desktop only (Windows/Mac) | Cloud SaaS |
| Setup time | ✅ Under 10 minutes | 10–15 minutes | Days of onboarding |
| Real-time team collaboration | ✅ Native (Google Drive) | Limited (SharePoint required) | ✅ Yes |
| Influencer Tier breakdown | ✅ Nano/Micro/Macro/Mega | Custom formula needed | Partial (add-on required) |
| Campaign search by ID | ✅ Dropdown lookup | Manual VLOOKUP needed | ✅ Yes |
| Customizable layout | ✅ Full control | ✅ Full control | Limited without developer |
| Year-1 cost (5 users) | $9.99 total | ~$50+ (Office licenses) | $9,600–$43,200 |
For marketing teams that need influencer ROI clarity without paying enterprise SaaS prices, the Influencer Campaign Dashboard in Google Sheets sits in the sweet spot.
Who Should Use This Template
Click here to Purchase the Influencer Campaign Dashboard in Google Sheets
Perfect for:
- Digital marketing managers running multi-platform influencer campaigns
- Social media agencies managing 10–200 creators simultaneously
- Brand managers accountable for influencer spend ROI
- Freelance marketing consultants building client reporting packages
- E-commerce businesses running affiliate and creator programs
Not a fit if:
- You need live API integrations with Instagram, TikTok, or YouTube Analytics
- Your team requires automated contract management or CRM functionality
- You need enterprise-grade SOC 2 data compliance and SSO authentication
Real-World Use Cases
Priya manages influencer partnerships at a D2C beauty brand. She uses the Influencer Campaign Dashboard in Google Sheets to compare Macro vs. Micro influencer ROI each quarter, identify which niches (skincare, wellness, lifestyle) drive the most conversions, and present spend vs. revenue reports to her CMO — all without paying $800/month for a platform like AspireIQ or HubSpot.
Marco runs a boutique digital marketing agency. He creates a Google Sheets copy for each client, updates it weekly with campaign data, and shares view-only access via Google Drive so clients can monitor their live Platform and ROI pages between meetings. The transparency adds perceived value to his retainer without any additional tooling cost.
Sophia heads digital marketing at a mid-size retail brand. She uses the ROI page to identify which campaign types (sponsored posts, unboxing videos, affiliate codes) consistently outperform cost benchmarks — then adjusts the next quarter’s influencer budget allocation using those findings.
Advantages of Influencer Campaign Dashboard in Google Sheets
The primary advantage is the cost-to-capability ratio: 16 charts across 6 pages for $9.99 one-time versus $800+/month for comparable SaaS functionality. Google Sheets’ native sharing and collaboration remove the need for per-user licensing, making this equally viable for solo freelancers and 50-person marketing departments. The pivot-table architecture means zero formula maintenance — data updates flow through the backend automatically. The Influencer Tier breakdown (Nano/Micro/Macro/Mega) is a metric most general-purpose dashboards require custom configuration to replicate.
Opportunities for Improvement
Click here to Purchase the Influencer Campaign Dashboard in Google Sheets
Like any spreadsheet-based tool, this dashboard does not pull data automatically from social platforms — campaign records need to be entered or pasted into the Data sheet manually or via CSV import. Teams running more than 500 simultaneous campaigns may find Google Sheets pivot refresh times increase with data volume. The template does not include influencer contract tracking, payment scheduling, or communication logging, which are outside its scope as a campaign analytics tool.
Best Practices
- Use consistent naming in the Platform, Niche, Tier, and Campaign Type columns — inconsistent spelling creates separate slicer values and breaks chart groupings.
- Click Refresh All pivots after each data entry session (Data menu → Pivot Tables) to ensure all charts and KPIs reflect the latest records.
- Share the dashboard with clients or stakeholders using “Viewer” access to prevent accidental data edits.
- Add a new row per campaign (not per influencer) so the Search page Campaign ID lookup works correctly.
- Review the ROI page monthly to identify which Platform + Niche combinations should receive increased budget in the following quarter.
Explore Relevant Templates
Looking for more influencer and marketing analytics tools? Explore these related templates on NextGenTemplates:
- Influencer Marketing Dashboard in Excel — Same campaign analytics in Microsoft Excel with pivot slicer controls.
- Influencer Marketing Dashboard in Power BI — Enterprise-grade visuals and DAX-powered KPIs for Power BI Desktop users.
- Influencer Marketing KPI Scorecard in Excel — Monthly scorecard format for tracking KPI targets vs. actuals.
- Influencer ROI KPI Dashboard in Google Sheets — KPI-format version with MTD/YTD tracking.
- Social Media ROI KPI Dashboard in Google Sheets — Broader social media tracking including organic and paid channels.
Frequently Asked Questions
Click here to Purchase the Influencer Campaign Dashboard in Google Sheets
What KPIs does the Influencer Campaign Dashboard in Google Sheets track?
The dashboard tracks 4 headline KPIs: Total Revenue, Total Cost, Total Conversions, and Total Engagements. Analysis pages break these down by Platform, Influencer Tier, Niche, Campaign Type, and Content Type across 16 pre-built charts.
Does this work on mobile?
Yes. The Influencer Campaign Dashboard in Google Sheets runs in the Google Sheets mobile app on iOS and Android. Slicer controls work on mobile, though data entry is easiest on desktop or tablet.
How do I add my own influencer campaign data?
Open the Data sheet tab and enter your campaign records in the structured column format provided. All 16 charts and 4 KPI cards update automatically after you refresh the pivot tables — no formula editing required.
Can I add custom columns or niches?
Yes. You can add new Niche values, Platform names, or Tier labels directly in the Data sheet. The pivot tables and slicer dropdowns will pick up any new values automatically on the next refresh.
How does this compare to paid influencer analytics tools?
Platforms like AspireIQ and HubSpot Marketing Hub charge $800–$3,600/month. The Influencer Campaign Dashboard in Google Sheets delivers the same core KPI and trend analysis for $9.99 one-time — with full layout control and no per-user fees.
Can I share this with clients?
Yes. Use Google Drive’s sharing to give clients Viewer access to their copy of the dashboard. They can see all live pages without being able to edit data, which is ideal for client reporting and transparency.
Is the download a Google Sheets link or a file?
The download includes a PDF guide with the Google Sheets copy link. Click the link to create your personal, fully editable copy directly in your Google Drive account.
About the Author
Built by PK — Microsoft Certified Professional with 15+ years of Excel, Google Sheets, and Power BI experience. Founder of NextGenTemplates, reaching 300K+ subscribers across YouTube channels. Every template is hand-built and tested before release.
Conclusion
The Influencer Campaign Dashboard in Google Sheets gives marketing teams a single, structured place to track Revenue, Cost, ROI, Platform, and Influencer Tier performance across every campaign — without the recurring cost of SaaS platforms or the complexity of building custom analytics from scratch.
✅ Click here to Purchase the Influencer Campaign Dashboard in Google Sheets — Instant download · One-time payment · No subscription
👉 Follow us on Youtube.com/@NeoTechNavigators for Google Sheets tutorials and dashboard walkthroughs.
📅 Last updated: May 2026