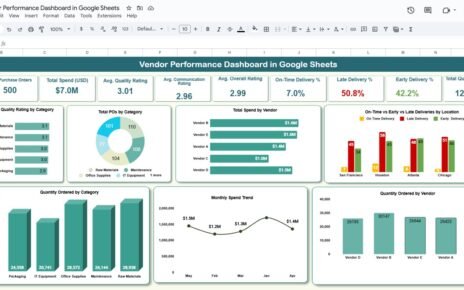
Influencer marketing can create strong awareness, traffic and revenue, but only when campaign results are measured in a clean and consistent way. Many teams still track creator collaborations across disconnected exports, screenshots, manual spreadsheets and separate client reports. The Influencer Collaboration Analytics Dashboard in Google Sheets is designed to bring those campaign metrics into one practical reporting template.Influencer Collaboration Analytics Dashboard in Google Sheets
This dashboard includes 6 dashboard tabs, 4 KPI cards and 16 chart views for analyzing revenue, cost, conversions, engagements, reach, impressions, clicks, platform performance, niche performance and influencer tier results. Because it is built in Google Sheets, teams can copy it, edit it, collaborate online and update campaign records without buying complex software. If you are new to collaborative spreadsheets, Google also provides helpful guidance for working with Google Sheets files and sharing settings.
What This Influencer Collaboration Dashboard Helps You Track
The template is built for marketers who need a fast way to understand which collaborations are generating business value. It is useful for brand teams, agencies, creator partnership managers, performance marketers and small businesses running campaigns across multiple platforms.
The dashboard focuses on the metrics that matter most in influencer reporting: revenue, cost, conversions, engagements, reach, impressions, clicks, campaign type, content type, influencer tier, niche and platform. Instead of manually rebuilding charts each month, you can update the Data Sheet and use the dashboard pages to review campaign performance from different angles.
Key Features
Influencer Collaboration Analytics Dashboard in Google Sheets
- Google Sheets format: Easy to copy, edit, share and customize for your own influencer reporting process.
- Overview KPI cards: Total Revenue, Total Cost, Total Conversions and Total Engagements show high-level campaign performance quickly.
- Multiple dashboard pages: Separate views for Overview, Platform, Influencers, ROI, Search Sheet and Data Sheet.
- Interactive slicers: Filter campaign results quickly by dimensions such as platform, tier, niche, campaign type or content type.Influencer Collaboration Analytics Dashboard in Google Sheets
- ROI analysis: Compare revenue and cost by platform, month, campaign type and niche.
- Campaign lookup: Use the Search Sheet to select a Campaign ID and review all related details in one place.Influencer Collaboration Analytics Dashboard in Google Sheets
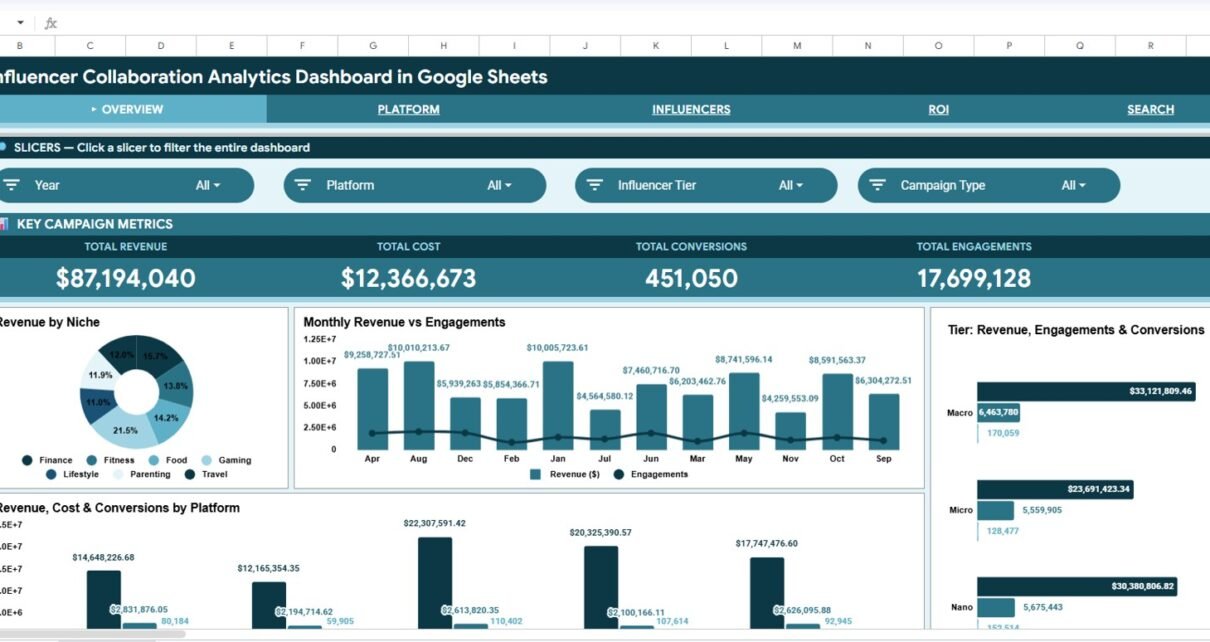
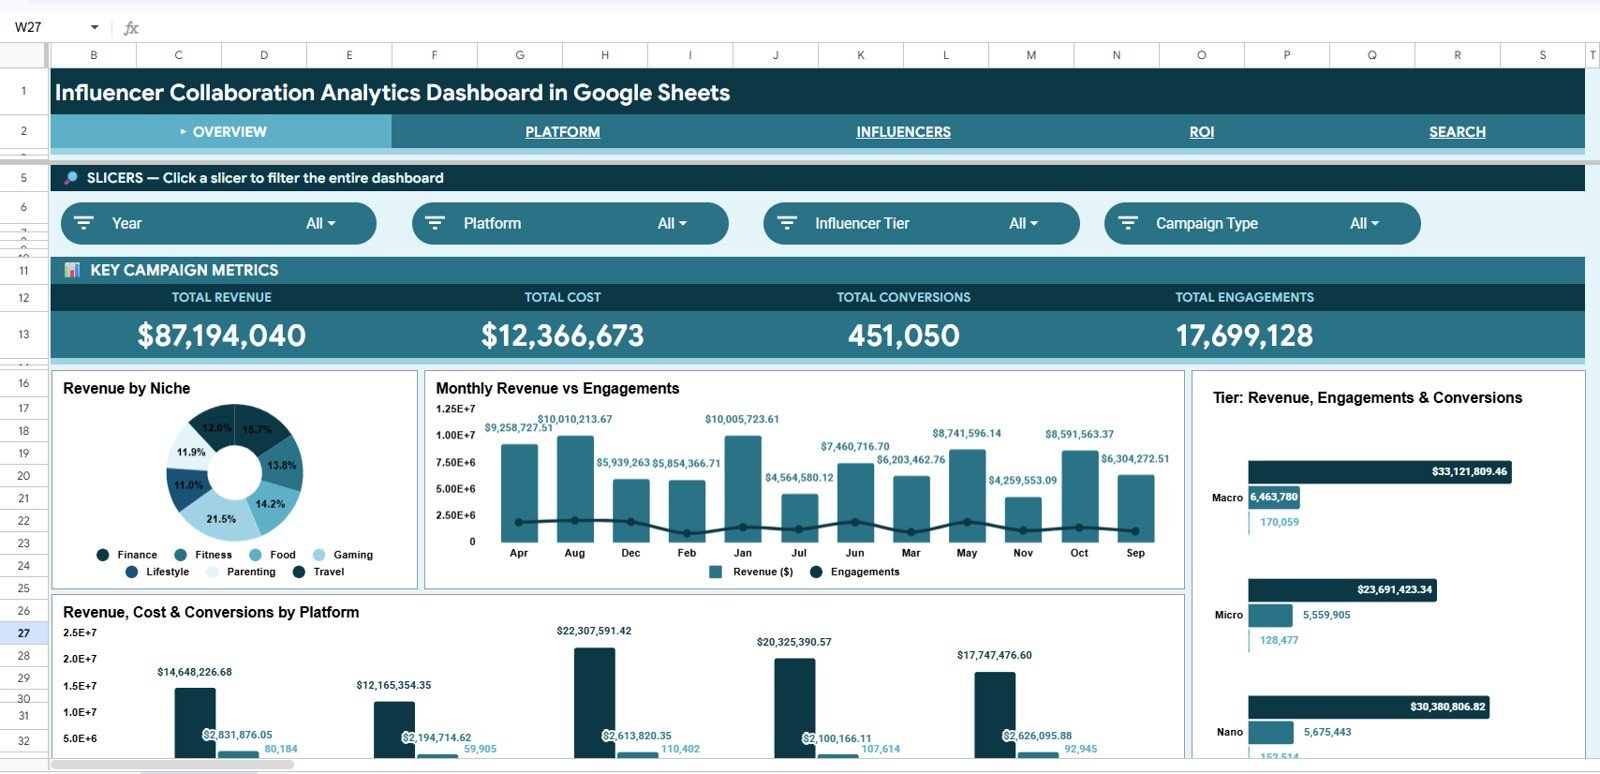
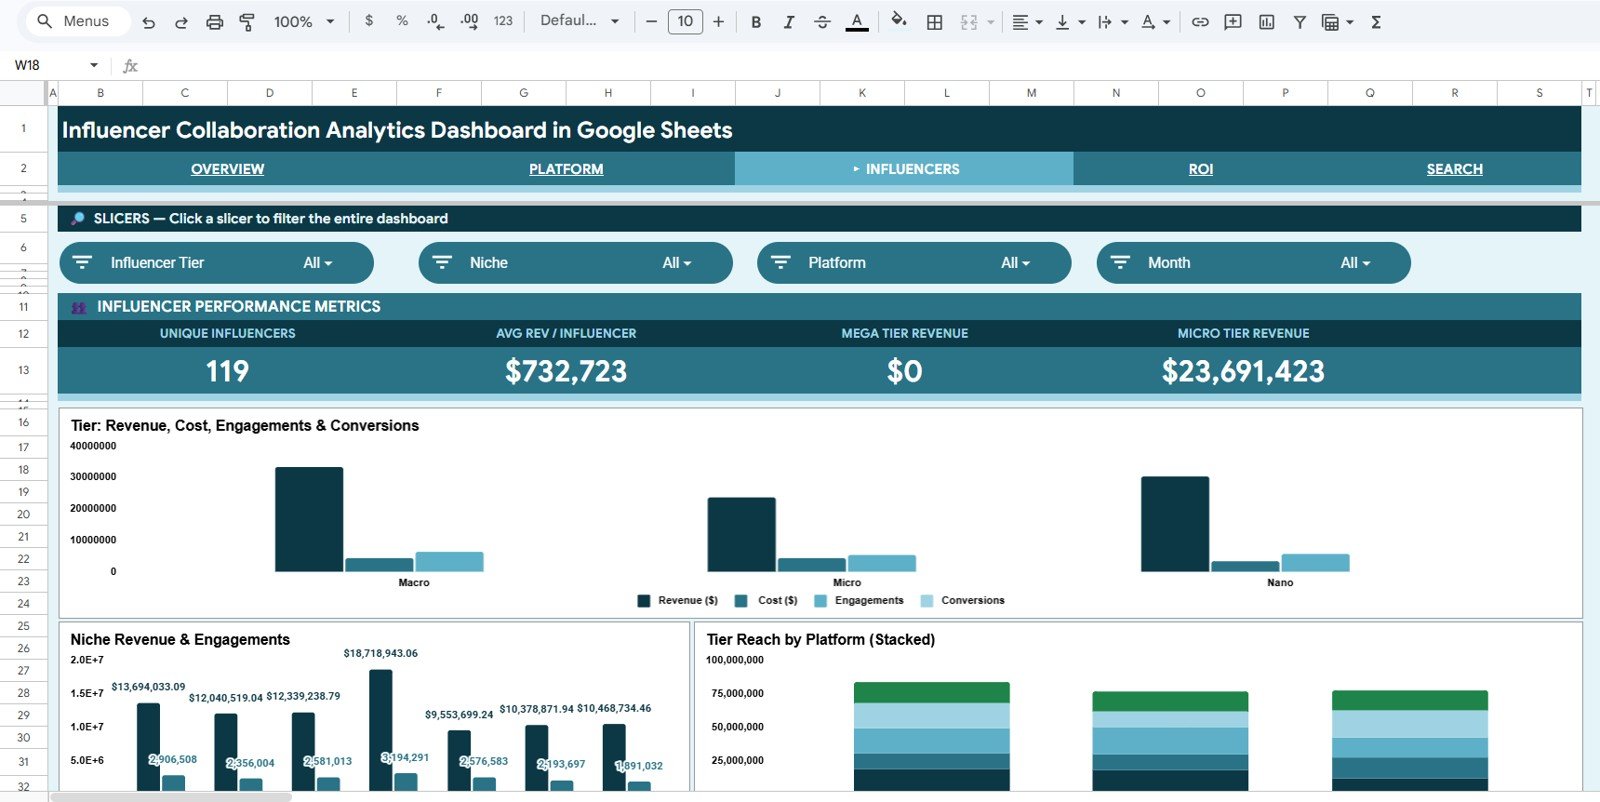
1. Overview Page
The Overview Page is built for quick executive review. At the top of the sheet, the dashboard displays high-level KPI cards for Total Revenue, Total Cost, Total Conversions and Total Engagements. These cards give users a clear summary before they move into deeper analysis.Influencer Collaboration Analytics Dashboard in Google Sheets
The Overview section also includes four important chart groups. Revenue by Niche helps identify which influencer categories are bringing the most value. Revenue and Engagements by Month shows how campaign output changes over time. Revenue, Engagements and Conversions by Influencer Tier compares performance across influencer sizes. Revenue, Cost and Conversions by Platform helps compare channels side by side.Influencer Collaboration Analytics Dashboard in Google Sheets
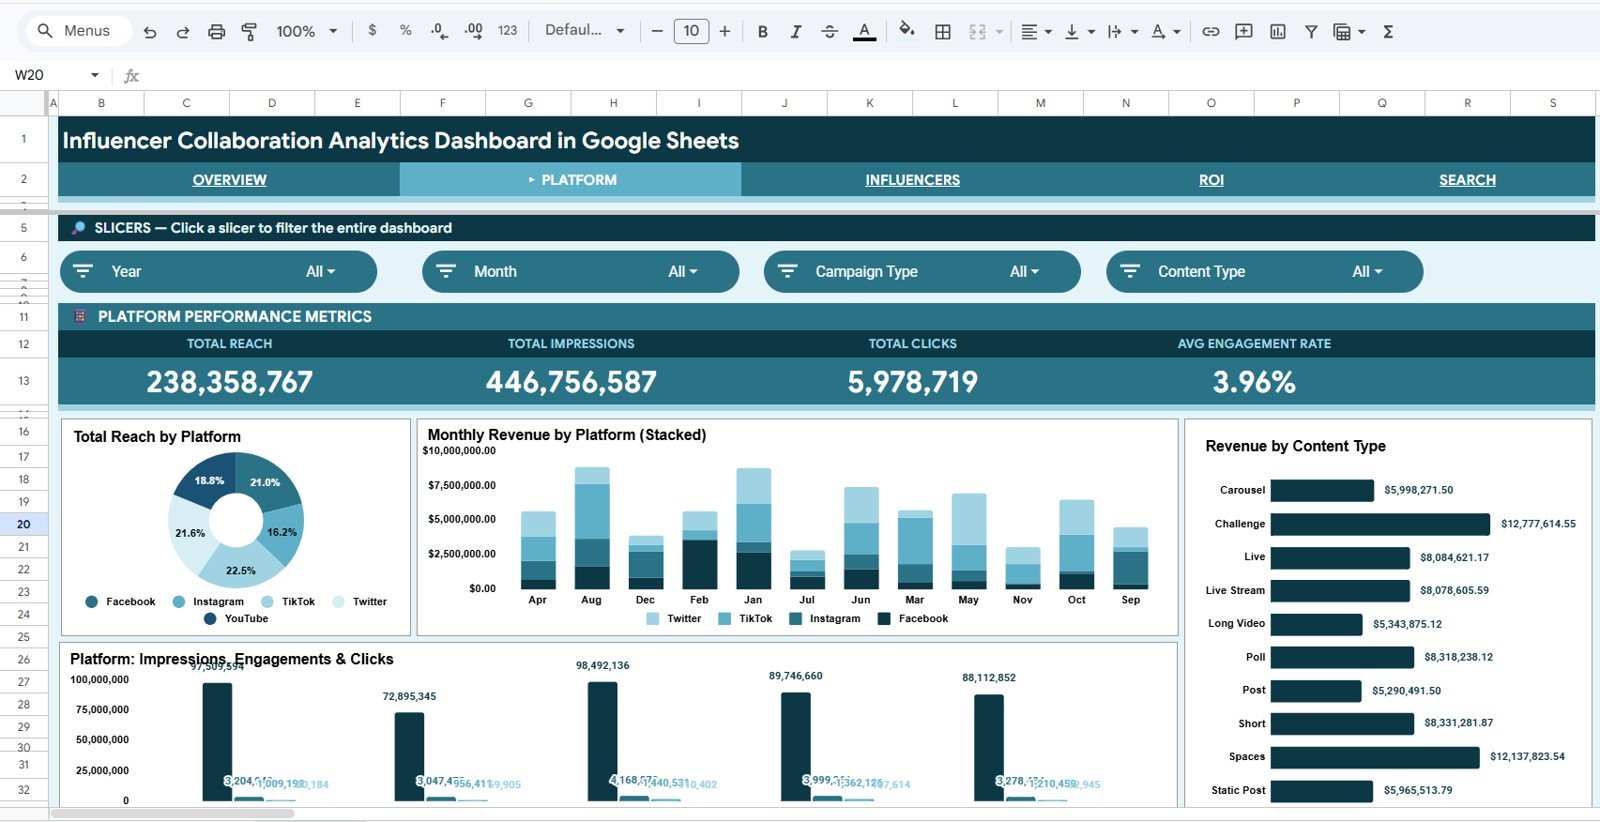
2. Platform Page
The Platform tab helps marketers compare channel performance across influencer campaigns. It includes Reach by Platform, which is useful for understanding audience scale. It also includes Revenue by Platform and Month, so you can see how each platform contributes to results over time.
The dashboard also shows Revenue by Content Type and Impressions, Engagements and Clicks by Platform. These views help separate awareness metrics from action metrics, making it easier to decide whether a platform is driving visibility, engagement, traffic or conversions.
Influencer Collaboration Analytics Dashboard in Google Sheets
3. Influencers Page
The Influencers tab focuses on performance by creator tier and niche. The chart for Revenue, Cost, Engagements and Conversions by Tier helps compare whether nano, micro, mid-tier or larger influencers are producing stronger results relative to campaign spend.
The tab also includes Revenue and Engagements by Niche and Reach by Platform and Tier. This helps campaign managers understand which influencer categories are resonating with audiences and how different tiers perform across platforms.Influencer Collaboration Analytics Dashboard in Google Sheets
Influencer Collaboration Analytics Dashboard in Google Sheets
4. ROI Page
The ROI tab is designed for campaign profitability review. Revenue and Cost by Platform helps compare spend and return across channels, while Revenue and Cost by Month makes monthly performance easier to review.
The dashboard also includes Revenue, Cost and Conversions by Campaign Type and Revenue and Cost by Niche. These charts make it easier to spot where influencer campaigns are generating a return, where spend is rising, and which campaign formats may need adjustment.

Influencer Collaboration Analytics Dashboard in Google Sheets
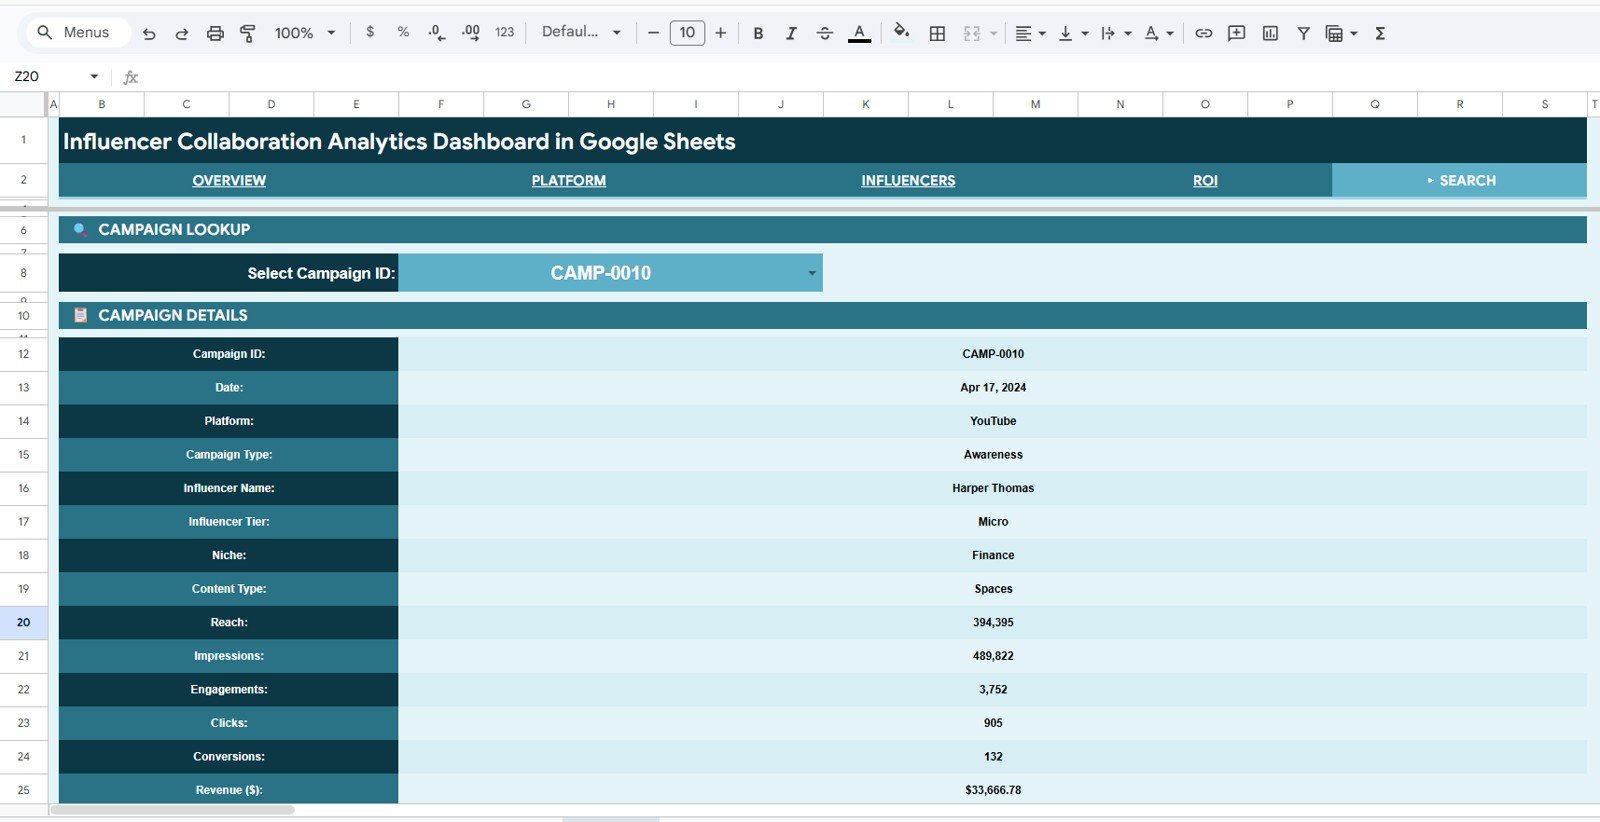
5. Search Sheet Tab
The Search Sheet gives users a quick campaign lookup experience. You can select a Campaign ID from the dropdown and view all related campaign details in one place. This is useful when you need to answer a specific question about a single collaboration without scrolling through the raw data.Influencer Collaboration Analytics Dashboard in Google Sheets
The lookup view includes date, platform, campaign type, influencer name, influencer tier, niche, content type, reach, impressions, engagements, clicks, conversions and revenue. For agencies and reporting teams, this tab can save time during client calls and campaign reviews.Influencer Collaboration Analytics Dashboard in Google Sheets
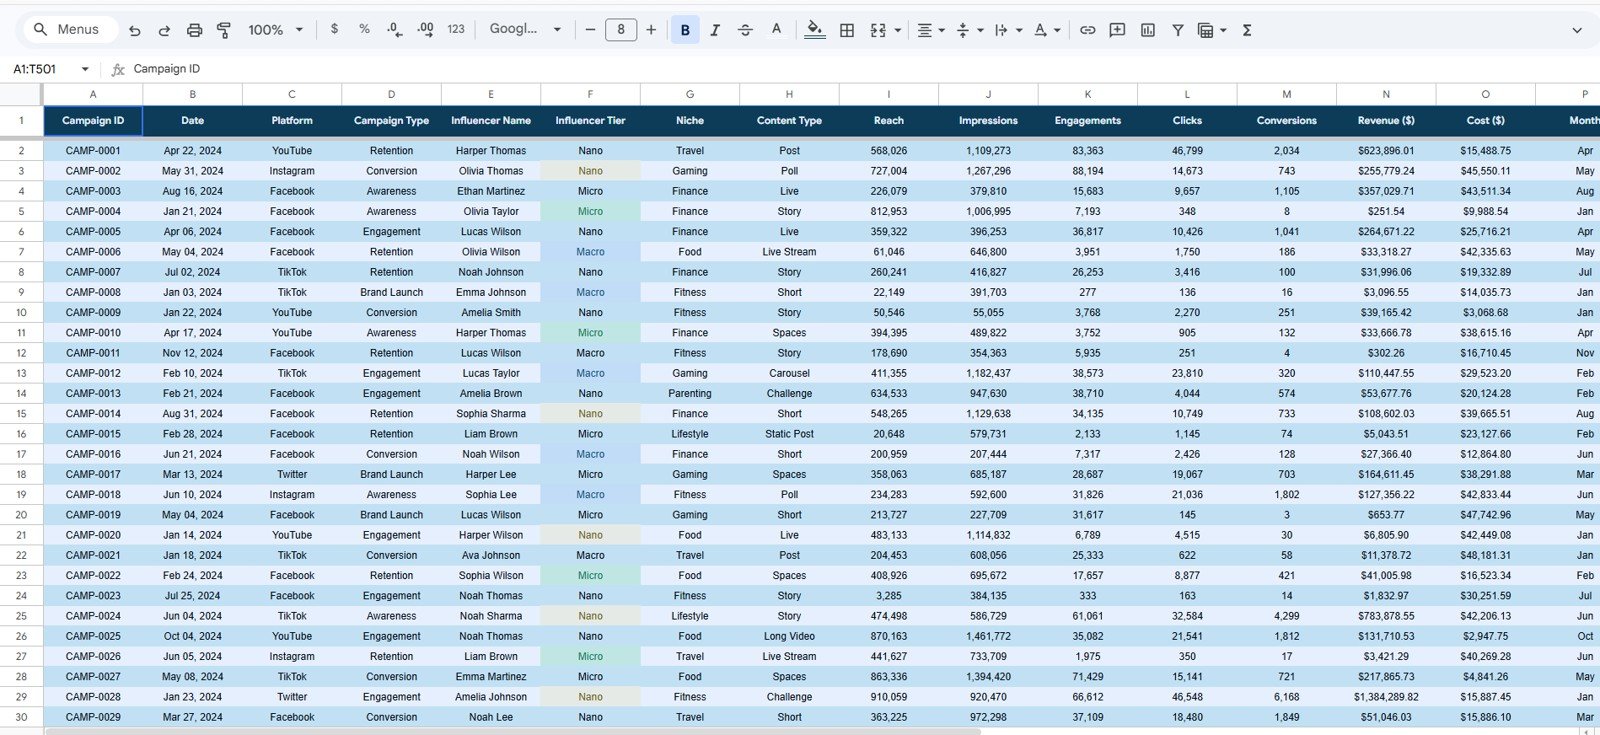
6. Data Sheet Tab
The Data Sheet is where campaign records are added. To keep the dashboard working correctly, users should enter new data in the same structure and format as the existing table. This includes campaign ID, date, platform, campaign type, influencer name, tier, niche, content type and performance metrics.
A clean Data Sheet is the foundation of the full dashboard. When campaign data is entered consistently, the overview charts, platform analysis, influencer analysis, ROI reports and search lookup all become easier to maintain.
Influencer Collaboration Analytics Dashboard in Google Sheets
Dashboard Pages at a Glance
| Page | Main Purpose | Best Use Case |
|---|---|---|
| Overview | High-level KPI and campaign performance summary. | Monthly review and executive reporting. |
| Platform | Channel-level performance across reach, revenue and engagement metrics. | Platform budget allocation and campaign planning. |
| Influencers | Creator tier, niche and reach analysis. | Comparing influencer groups and collaboration value. |
| ROI | Revenue and cost comparison by key campaign dimensions. | Spend review and profitability analysis. |
| Search Sheet | Campaign ID lookup with detailed campaign information. | Fast answers during campaign reviews. |
| Data Sheet | Structured campaign input table. | Adding and maintaining influencer collaboration records. |
Who Should Use This Template?
This Google Sheets influencer dashboard is useful for influencer marketing managers, brand partnership teams, digital marketing agencies, small businesses, ecommerce teams and content partnership managers. It is especially helpful for teams that need a clear reporting system but do not want the cost or complexity of a full influencer marketing platform.
It can also be used by consultants who prepare campaign reports for clients. The dashboard gives them a structured way to show revenue, cost, engagement, conversion and platform performance without manually building the same charts each time.Influencer Collaboration Analytics Dashboard in Google Sheets
Real-World Use CasesInfluencer Collaboration Analytics Dashboard in Google Sheets
- Monthly campaign reporting: Summarize influencer revenue, costs, conversions and engagements for leadership.Influencer Collaboration Analytics Dashboard in Google Sheets
- Client performance reviews: Use platform, influencer and ROI pages to explain campaign outcomes to clients.Influencer Collaboration Analytics Dashboard in Google Sheets
- Budget planning: Compare platform and niche performance before deciding where to invest next.
- Influencer tier comparison: Understand whether nano, micro, mid-tier or larger influencers are delivering better value.Influencer Collaboration Analytics Dashboard in Google Sheets
- Campaign audit: Use the Search Sheet to quickly review details for a specific Campaign ID.
Advantages
Influencer Collaboration Analytics Dashboard in Google Sheets
- Affordable one-time template instead of a recurring software subscription.
- Easy to customize inside Google Sheets.
- Useful for both high-level reporting and detailed campaign lookup.
- Built around practical influencer marketing metrics.
- Includes slicers and multiple pages for faster filtering and analysis.
Opportunities for Improvement
This dashboard is intentionally spreadsheet-based, so it works best when campaign data is entered or imported consistently. Teams with advanced automation needs may still want to connect exports from social platforms, ecommerce tools or ad systems before pasting the final metrics into the Data Sheet.
Another improvement opportunity is to add your own benchmarks. For example, your team can add target conversion rates, expected cost ranges, minimum engagement goals or campaign-specific ROI thresholds to make the dashboard even more aligned with your internal reporting process.
Best Practices for Using the Dashboard
- Use consistent campaign IDs so the Search Sheet remains useful.
- Keep platform, niche, tier and campaign type names standardized.
- Update the Data Sheet on a fixed schedule, such as weekly or monthly.
- Review revenue and cost together, not separately, when judging campaign performance.
- Use slicers during meetings to answer specific questions quickly.
Explore Relevant Templates
- Influencer Collaboration Analytics Dashboard in Google Sheets
- Influencer Campaign Dashboard in Google Sheets
- Influencer Engagement KPI Dashboard in Google Sheets
- PPC Campaign KPI Dashboard in Google Sheets
FAQ
Influencer Collaboration Analytics Dashboard in Google Sheets
Is this influencer dashboard built in Google Sheets?
Yes. The template is built in Google Sheets and can be copied, edited and customized for your own influencer campaign reporting.
What KPI cards are included?
The Overview page includes Total Revenue, Total Cost, Total Conversions and Total Engagements.
Can I analyze influencer ROI with this dashboard?
Yes. The ROI page compares revenue and cost by platform, month, campaign type and niche.
Does the dashboard include campaign search?
Yes. The Search Sheet lets you select a Campaign ID and view related campaign details in one place.
Can agencies use this for client reporting?
Yes. Agencies can use the template to present platform performance, influencer tier results, ROI analysis and campaign-level details to clients.
About NeoTechNavigators
NeoTechNavigators creates practical tutorials, digital templates and dashboard resources for business users who want cleaner reporting systems. You can explore more walkthroughs and template ideas on the NeoTechNavigators YouTube channel.
Conclusion
The Influencer Collaboration Analytics Dashboard in Google Sheets gives marketing teams a structured way to track creator campaign performance across revenue, cost, engagement, conversions, platform results, influencer tiers and ROI. It is practical, editable and built for teams that want useful reporting without starting from a blank spreadsheet.
If your influencer campaign data is scattered across multiple files, this dashboard can help you organize the numbers, review performance faster and make better decisions about future collaborations.
Last updated: May 21, 2026.
Influencer Collaboration Analytics Dashboard in Google Sheets