In today’s competitive digital landscape, businesses rely heavily on marketing campaigns to generate leads, drive conversions, and increase revenue. However, managing multiple campaigns across different channels can become complex. Many organizations still depend on scattered spreadsheets and manual reports. As a result, they struggle to track performance accurately.Marketing Funnel and Conversion Dashboard in Google Sheets
Therefore, businesses now adopt data-driven dashboards to monitor their marketing funnel effectively. One of the most powerful and accessible solutions is the Marketing Funnel and Conversion Dashboard in Google Sheets.
This dashboard provides a centralized platform to track campaigns, analyze conversions, monitor revenue, and optimize marketing strategies. In this detailed guide, you will learn everything about this dashboard, including its features, structure, benefits, best practices, and FAQs.Marketing Funnel and Conversion Dashboard in Google Sheets
What is a Marketing Funnel and Conversion Dashboard in Google Sheets?
A Marketing Funnel and Conversion Dashboard in Google Sheets is an interactive analytics tool that helps businesses track the entire customer journey—from lead generation to conversion.
It visualizes key metrics such as:
-
Total campaigns
-
Leads generated
-
Conversions
-
Marketing cost
-
Revenue
Because the dashboard uses Google Sheets, it allows real-time collaboration and easy data updates. Moreover, it automatically updates charts and KPIs when users change filters.
Why Do Businesses Need a Marketing Funnel Dashboard?
Click to Buy Marketing Funnel and Conversion Dashboard in Google Sheets
Marketing involves multiple stages, including awareness, engagement, conversion, and retention. Therefore, tracking each stage manually becomes difficult.
A funnel dashboard simplifies this process.
Businesses need this dashboard because it helps to:
-
Track campaign performance
-
Monitor lead-to-conversion ratio
-
Analyze channel effectiveness
-
Optimize marketing spend
-
Improve ROI
As a result, companies can make better marketing decisions and increase profitability.
Key Features of Marketing Funnel and Conversion Dashboard in Google Sheets
The dashboard includes multiple pages that provide deep insights into marketing performance.
1. Overview Dashboard – Complete Funnel Visibility
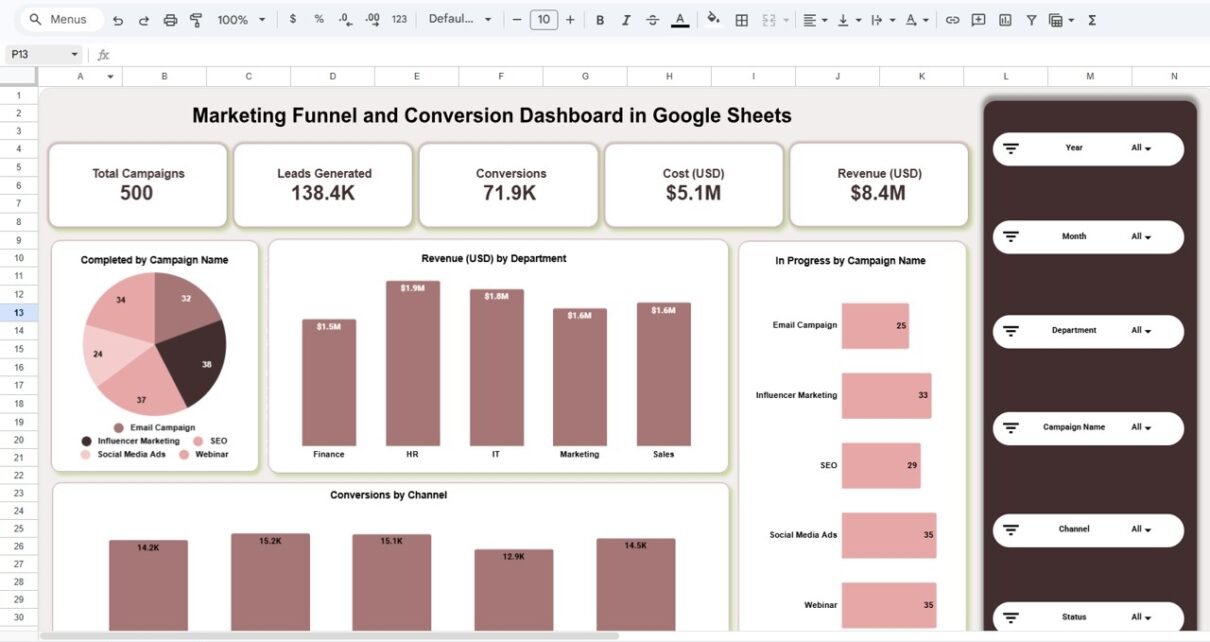
The Overview Dashboard provides a complete snapshot of marketing performance.
KPI Cards
At the top, the dashboard displays key metrics:
-
Total Campaigns
-
Leads Generated
-
Conversions
-
Cost (USD)
-
Revenue (USD)
Because of these KPIs, users can instantly evaluate performance.
Campaign Insights
The dashboard also includes:
-
Campaign completion breakdown
-
Campaign progress tracking
-
Revenue by department
-
Conversions by channel
Therefore, users can quickly identify which campaigns perform best.
Dynamic Filters
On the right side, users can apply filters such as:
-
Year
-
Month
-
Department
-
Campaign Name
-
Channel
-
Status
Because of these slicers, users can analyze specific segments easily.

Click to Buy Marketing Funnel and Conversion Dashboard in Google Sheets
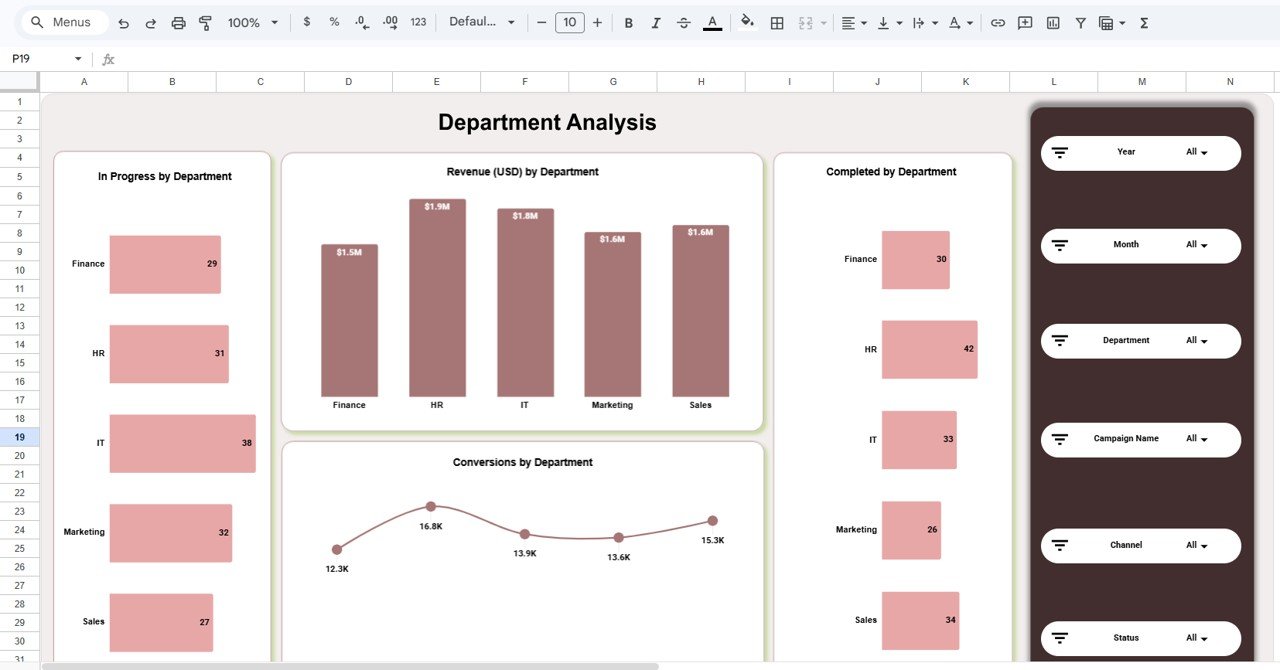
2. Department Analysis – Performance by Teams
The Department Analysis Page helps users evaluate performance across departments.
Key Insights
-
Revenue by department
-
Conversions by department
-
Campaign progress by department
Because of this analysis, managers can:
-
Identify top-performing teams
-
Detect underperforming departments
-
Allocate resources effectively
Click to Buy Marketing Funnel and Conversion Dashboard in Google Sheets
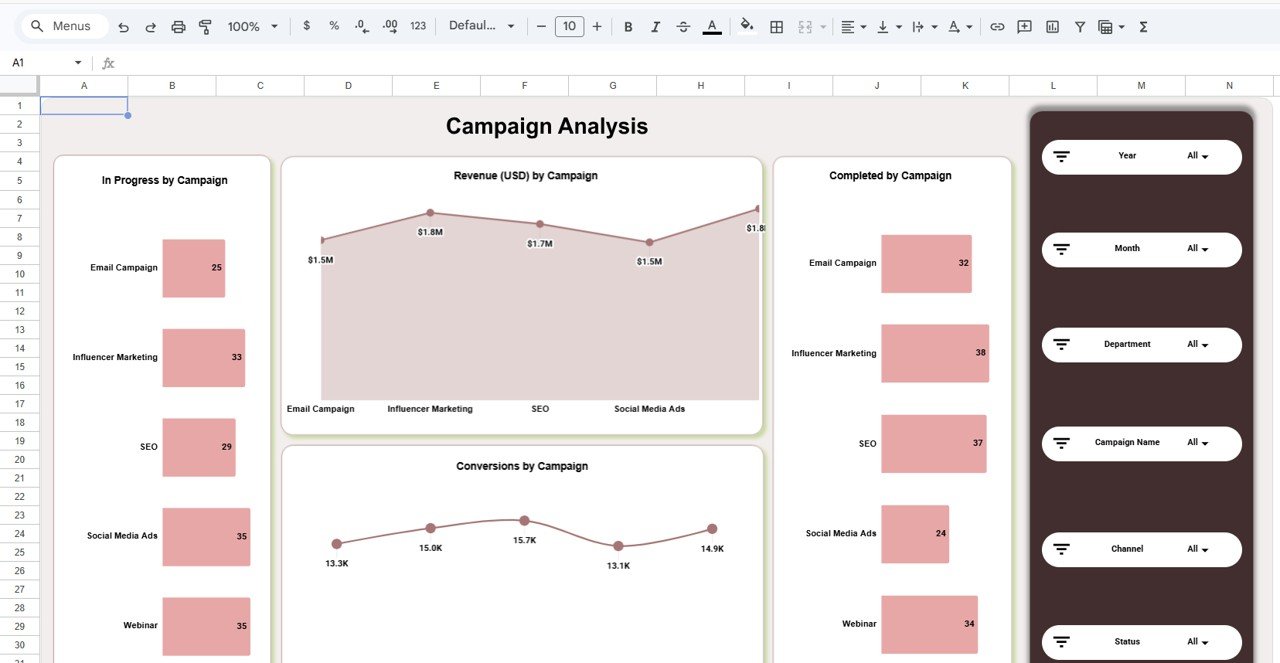
3. Campaign Analysis – Campaign-Level Insights
The Campaign Analysis Page focuses on individual campaigns.
It shows:
-
Revenue by campaign
-
Conversion trends
-
Campaign completion status
Because of this, marketers can:
-
Identify high-performing campaigns
-
Optimize low-performing campaigns
-
Improve marketing strategies
Click to Buy Marketing Funnel and Conversion Dashboard in Google Sheets
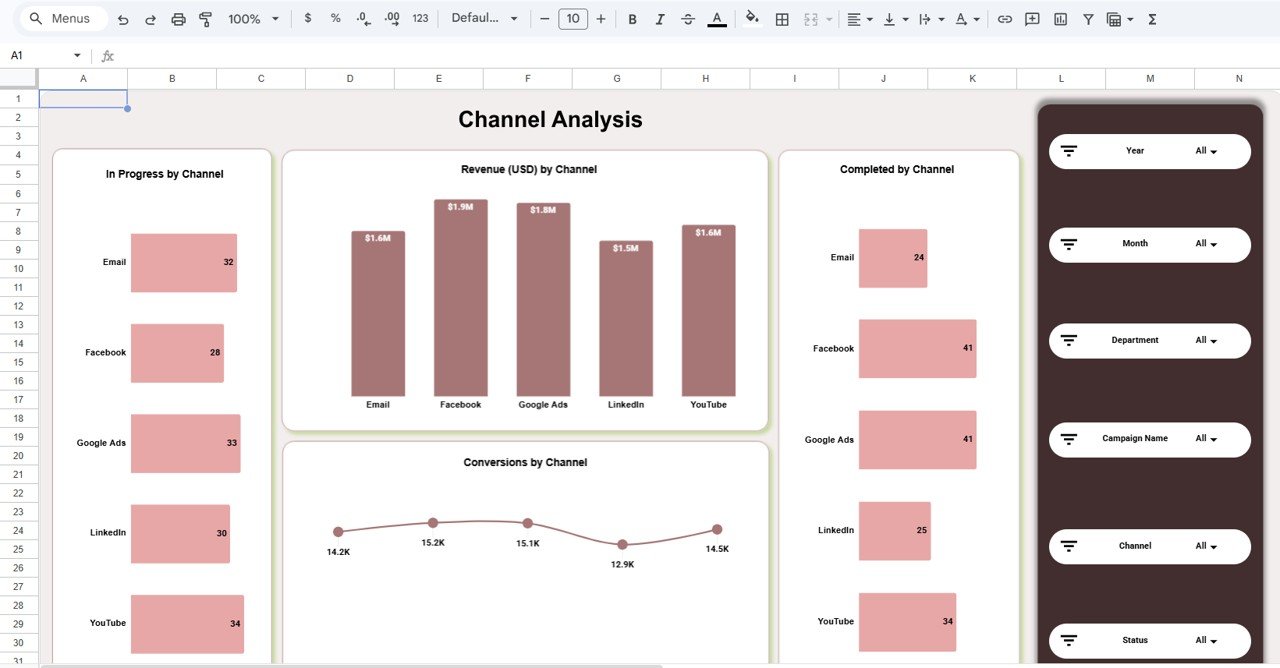
4. Channel Analysis – Channel Performance Tracking
The Channel Analysis Page evaluates performance across marketing channels.
Channels include:
- Google Ads
- YouTube
Key Metrics:
-
Revenue by channel
-
Conversions by channel
-
Campaign progress
Because of this, businesses can identify the most profitable channels.
Click to Buy Marketing Funnel and Conversion Dashboard in Google Sheets
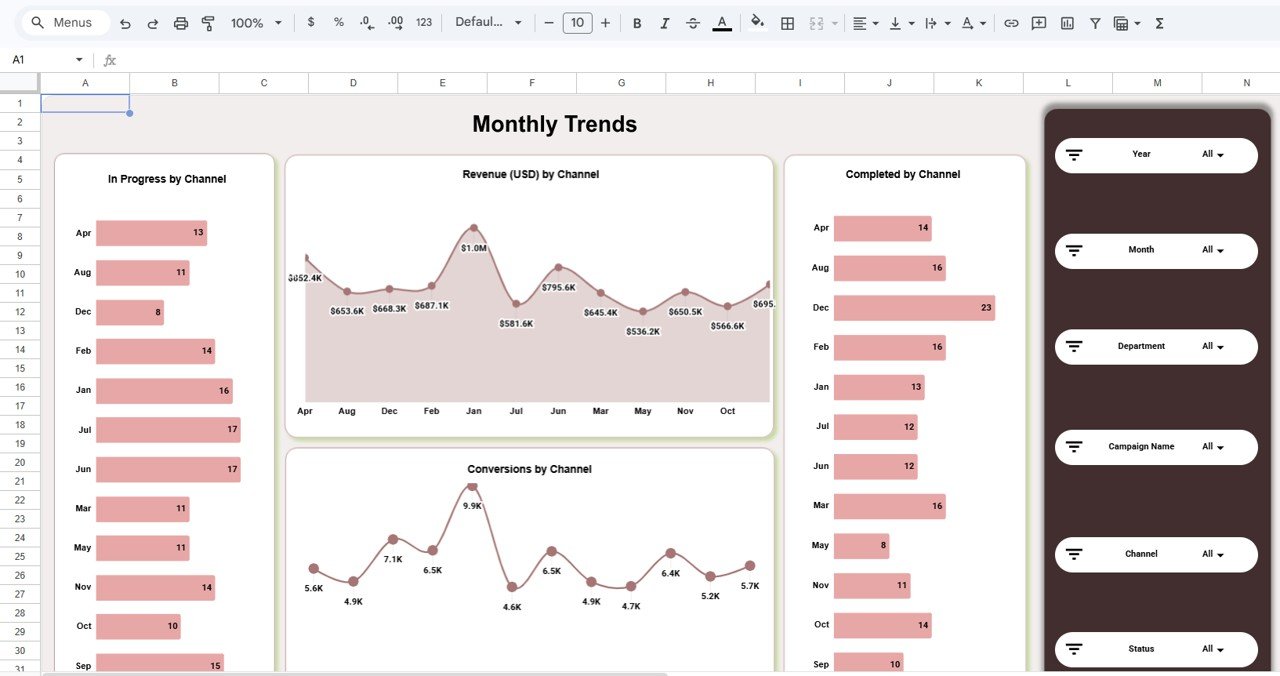
5. Monthly Trends – Performance Over Time
The Monthly Trends Page provides time-based insights.
It includes:
-
Revenue trends
-
Conversion trends
-
Monthly campaign progress
Because of this, users can:
-
Identify seasonal trends
-
Track performance growth
-
Forecast future results
Click to Buy Marketing Funnel and Conversion Dashboard in Google Sheets
Advantages of Marketing Funnel Dashboard in Google Sheets
1. Centralized Marketing Data
All campaign data is available in one dashboard. Therefore, users avoid switching between reports.
2. Real-Time Collaboration
Google Sheets allows multiple users to access and update data simultaneously.
3. Better Decision-Making
Because of clear visualizations, managers can make faster and smarter decisions.
4. Improved ROI Tracking
The dashboard tracks cost and revenue, which helps measure marketing effectiveness.
5. Easy Customization
Users can customize KPIs, charts, and filters based on their needs.
Opportunities for Improvement in Marketing Funnel Tracking
-
Integrate CRM systems for real-time lead tracking
-
Automate data collection from ad platforms
-
Use predictive analytics for forecasting
-
Track customer lifetime value (CLV)
-
Monitor audience segmentation
Best Practices for the Marketing Funnel Dashboard
Click to Buy Marketing Funnel and Conversion Dashboard in Google Sheets
1. Define Clear Funnel Stages
Clearly define stages such as:
-
Awareness
-
Interest
-
Conversion
2. Track Relevant KPIs
Focus on metrics like:
-
Conversion rate
-
Cost per lead
-
ROI
3. Maintain Data Accuracy
Ensure all data inputs are correct and updated regularly.
4. Use Consistent Naming
Keep campaign and channel names consistent.
5. Review Performance Regularly
Analyze data weekly or monthly to improve strategies.
Who Can Use This Dashboard?
- Marketing teams
- Digital marketing agencies
- Business owners
- Sales teams
- Startups
Conclusion
Click to Buy Marketing Funnel and Conversion Dashboard in Google Sheets
The Marketing Funnel and Conversion Dashboard in Google Sheets is a powerful tool for tracking marketing performance. It provides complete visibility into campaigns, conversions, and revenue.
Because it combines dynamic filters, KPI tracking, and trend analysis, it helps businesses make data-driven decisions. Moreover, its user-friendly design ensures easy adoption.
Therefore, organizations that use this dashboard can significantly improve their marketing performance and ROI.
Visit our YouTube channel to learn step-by-step video tutorials
Youtube.com/@NeotechNavigators
Watch the step-by-step video tutorial:
Click to Buy Marketing Funnel and Conversion Dashboard in Google Sheets