Real Estate Agent Dashboard in Google Sheets — Track Listings, Agent Performance & Commissions
Real Estate Agent Dashboard in Google Sheets is a comprehensive analytics template built for real estate professionals who need a centralized view of their business performance. Whether you are a solo agent juggling dozens of active listings or a brokerage manager overseeing a team of agents, this dashboard puts all your critical data — listings, sales volume, commissions, agent close rates, and neighborhood trends — into one organized, auto-updating Google Sheets file. It includes 6 sheet tabs covering an Overview page, Listings analysis, Agent Performance metrics, Financial summaries, a Search Sheet for instant listing lookups, and a Data Sheet where you enter your records.
🛒 Click here to Purchase the Real Estate Agent Dashboard in Google Sheets
Key Features of the Real Estate Agent Dashboard in Google Sheets
This dashboard is packed with features that make it one of the most complete real estate analytics solutions available in Google Sheets. Here is what sets it apart:
- 6 Interactive Sheet Tabs — Overview, Listings, Agent Performance, Financial, Search Sheet, and Data Sheet covering every aspect of real estate operations
- 15+ Auto-Updating KPI Cards — Including Total Listings, Total Sales Volume, Avg List Price, Avg Days on Market, Total Commission, Active/Pending/Sold counts, Agent Close Rates, and Sale to List Ratios
- Dynamic Slicers and Filters — Filter the Overview page by property type, neighborhood, status, or time period to see exactly the data you need
- Agent Performance Comparison — Compare deals closed, commission earned, lead source effectiveness, and close rates across your team
- Financial Trend Analysis — Track monthly commission revenue, cumulative commission trends, and sales volume vs commission side by side
- Instant Listing Search — Select any Listing ID from a dropdown and see all 14 data fields for that property instantly
- Zero Coding Required — Simply replace the sample data and the entire dashboard updates automatically
- Works on Any Device — Access from desktop, tablet, or mobile via the Google Sheets app
If you work with Google Sheets dashboards regularly, this template will save you hours of manual reporting and give you instant visibility into your real estate business.
Dashboard Pages Explained
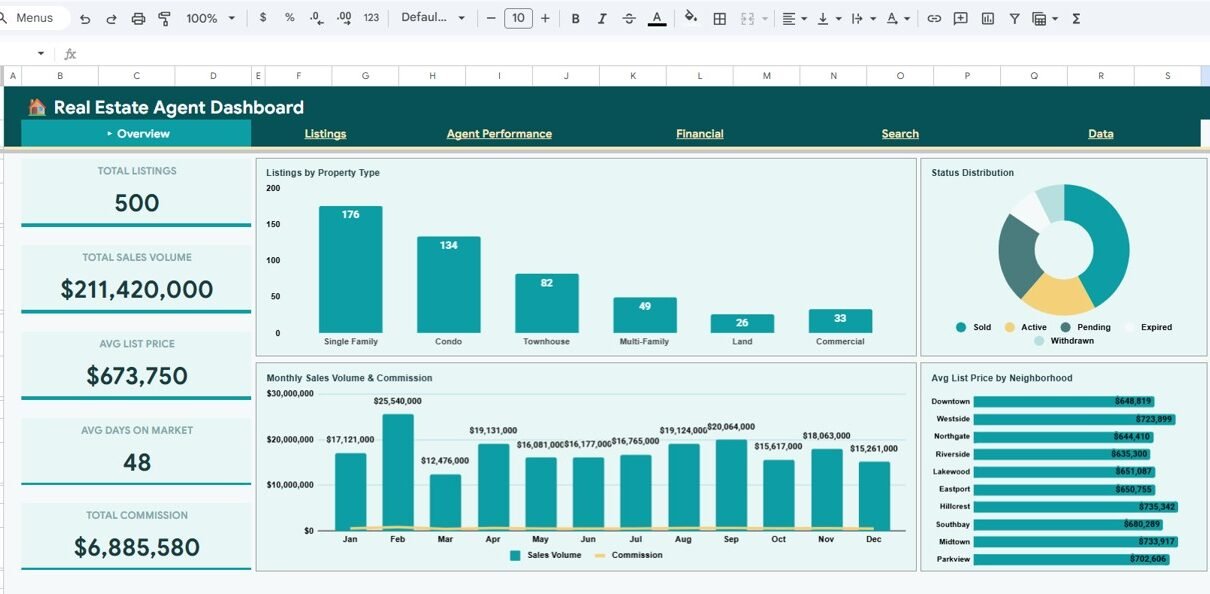
1. Overview Page
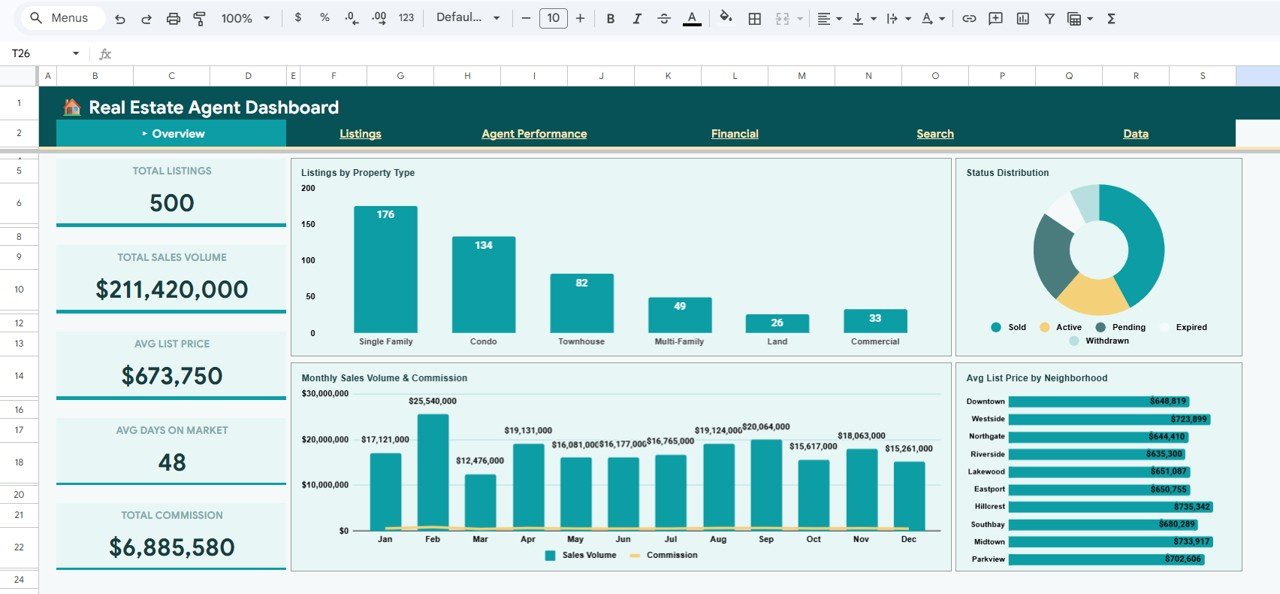
The Overview page is your command center. It features 5 high-level KPI cards at the top: Total Listings, Total Sales Volume, Avg List Price, Avg Days on Market, and Total Commission. Below the cards, you will find four key visualizations: Listings by Property Type shows how your portfolio is distributed across condos, single-family homes, townhouses, and other property categories. Status Distribution by Listing Status breaks down how many listings are active, pending, or sold. Monthly Sales Volume and Commission by Month reveals revenue trends over time. Avg List Price by Neighborhood helps you identify which areas command premium pricing. Multiple slicers let you filter the entire page by any dimension.
Overview Page2. Listings Page
The Listings page dives deeper into your property portfolio. It shows 5 KPI cards: Active Listings, Pending Listings, Sold Listings, Avg Sq Ft, and Avg Price per Sq Ft. The charts include Listings and Avg Price by Bedrooms, which helps you understand pricing patterns by bedroom count. Avg Days on Market by Property Type reveals which property categories sell fastest. Sq Ft vs List Price by Listing provides a scatter-style view of how square footage relates to pricing. Bedroom Distribution Trend by Month shows how the mix of properties has shifted over time.
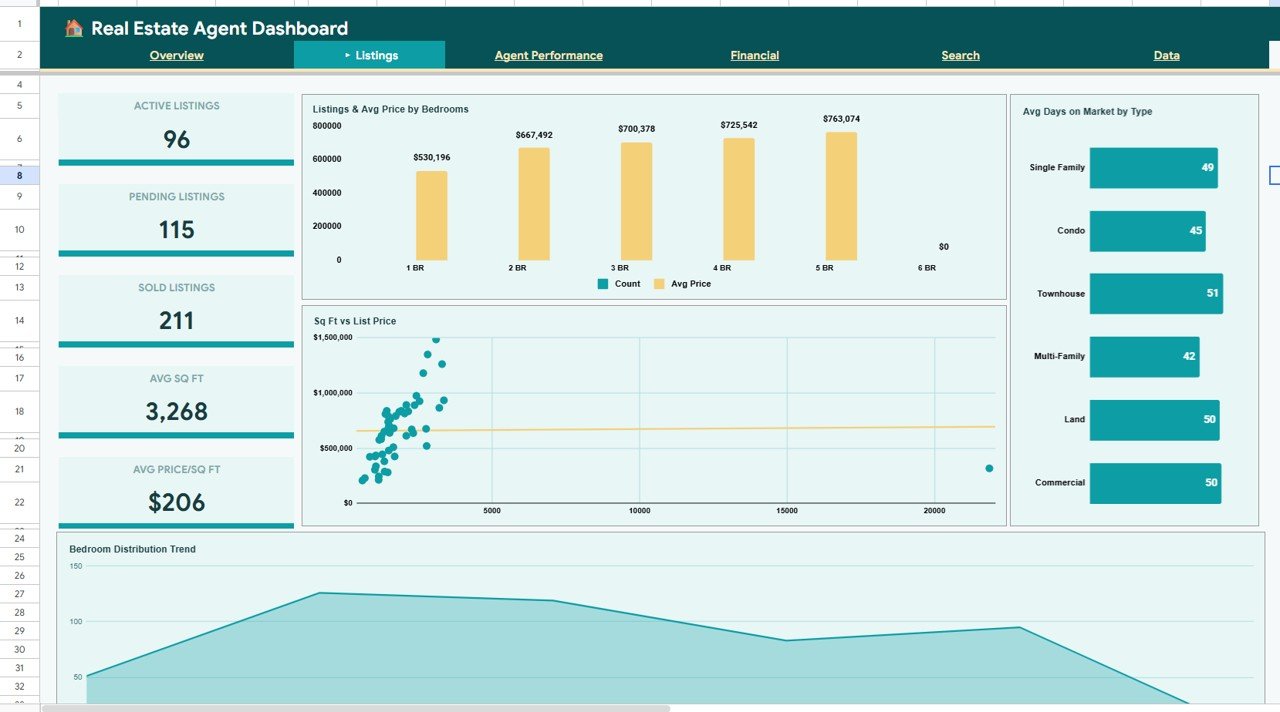 Listings Page
3. Agent Performance Page
This page is essential for brokerage managers and team leads. It highlights the Top Agent, Highest Commission earner, Avg Deals per Agent, and Best Close Rate at the top. The analysis section shows Deals Closed by Agent for a direct comparison of productivity, Deals by Lead Source to see which channels (referral, online, open house) generate the most business, Commission by Agent for revenue attribution, and Close Rate by Agent to identify who converts leads most effectively.
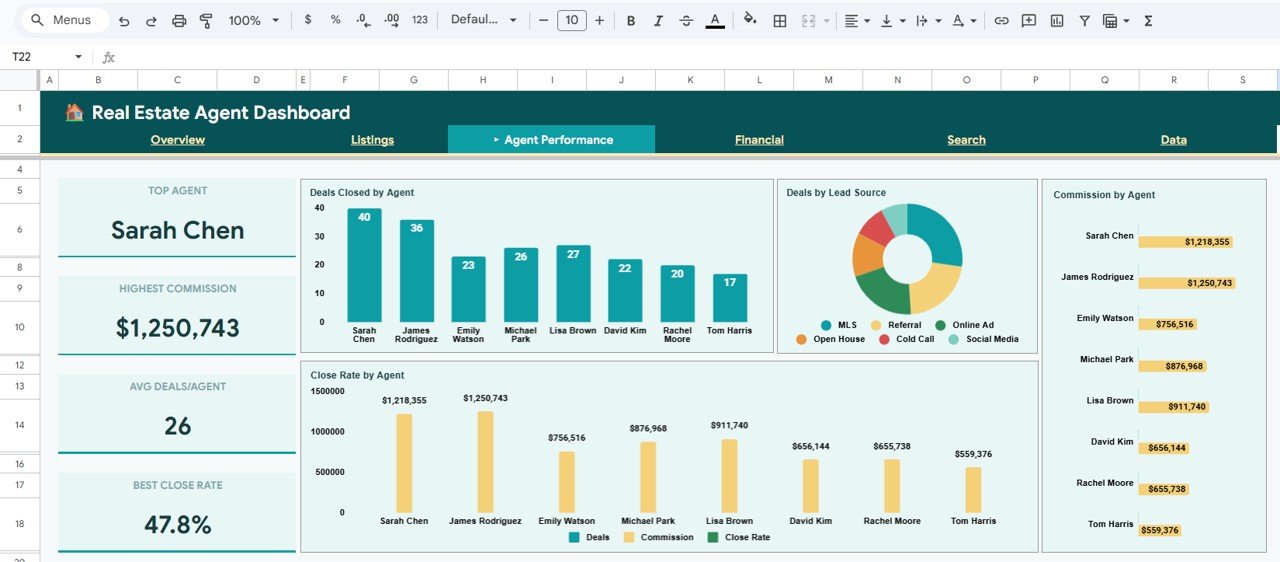 Agent Performance Page
4. Financial Page
The Financial page provides a complete revenue picture. KPI cards show Total Revenue (Commission), Avg Commission per Deal, Total Sale Volume, Avg Sale Price, and Sale to List Ratio. Monthly Commission and Sales Volume by Month tracks your income trajectory. Commission Revenue by Neighborhood reveals which areas are most profitable. Cumulative Commission Trend by Month shows your running total over the year. Sales Volume vs Commission by Month lets you see if commission rates are keeping pace with deal sizes.
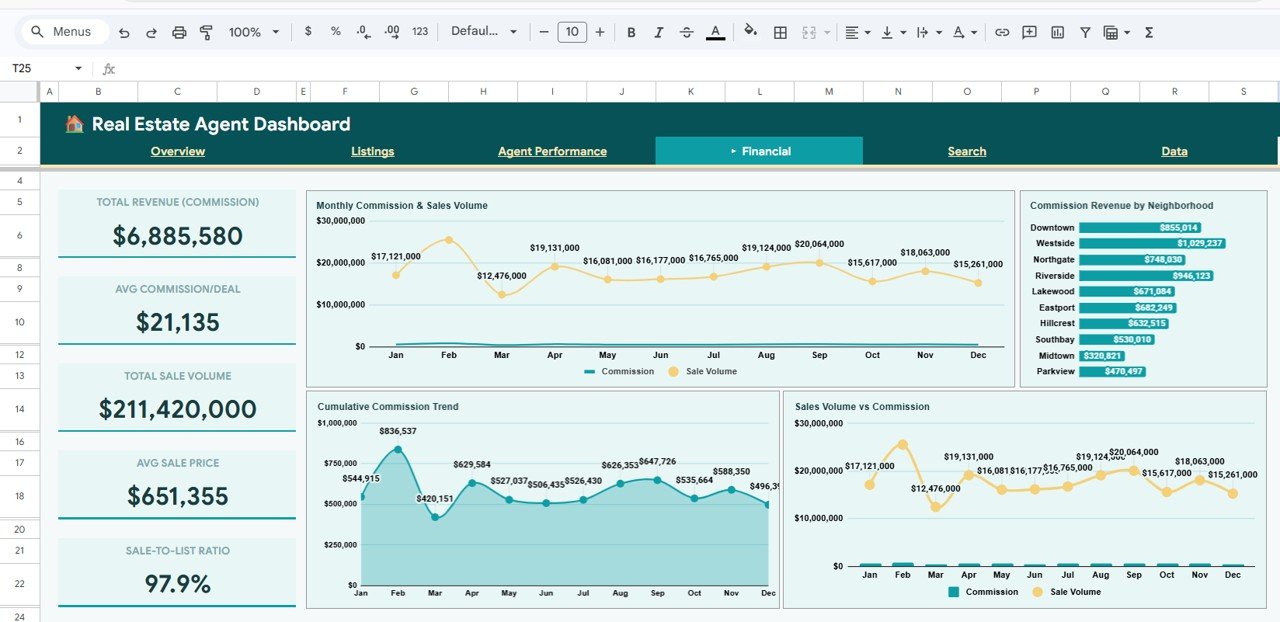 Financial Page
5. Search Sheet
The Search Sheet provides a quick lookup tool. Pick any Listing ID from the dropdown and instantly view all details: Date, Agent, Property Type, Neighborhood, Bedrooms, Bathrooms, Sq Ft, List Price, Sale Price, Days on Market, Status, Lead Source, and Commission Rate. This is incredibly useful when you need to pull up a specific property’s details for a client call or team meeting.
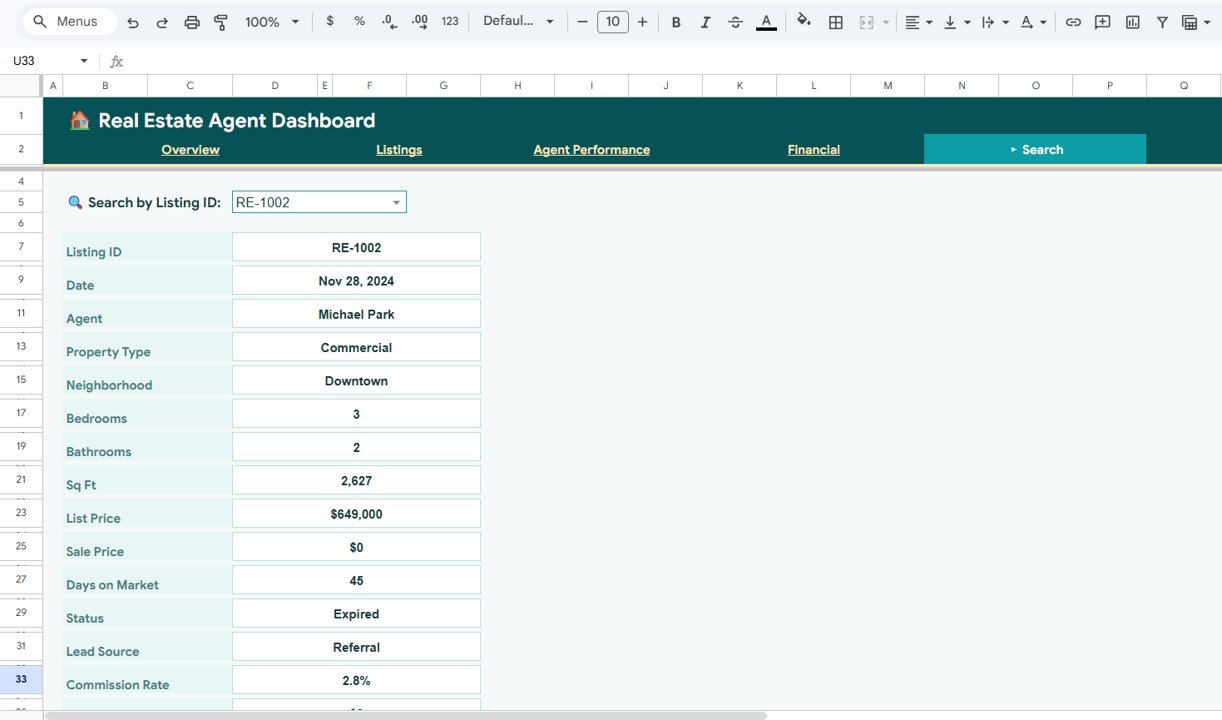 Search Sheet
6. Data Sheet
The Data Sheet is your input layer. All your listing records go here in a structured tabular format. Each row represents one listing with columns for every data field used across the dashboard. Simply replace the sample data with your own and every chart, KPI card, and analysis page updates automatically.
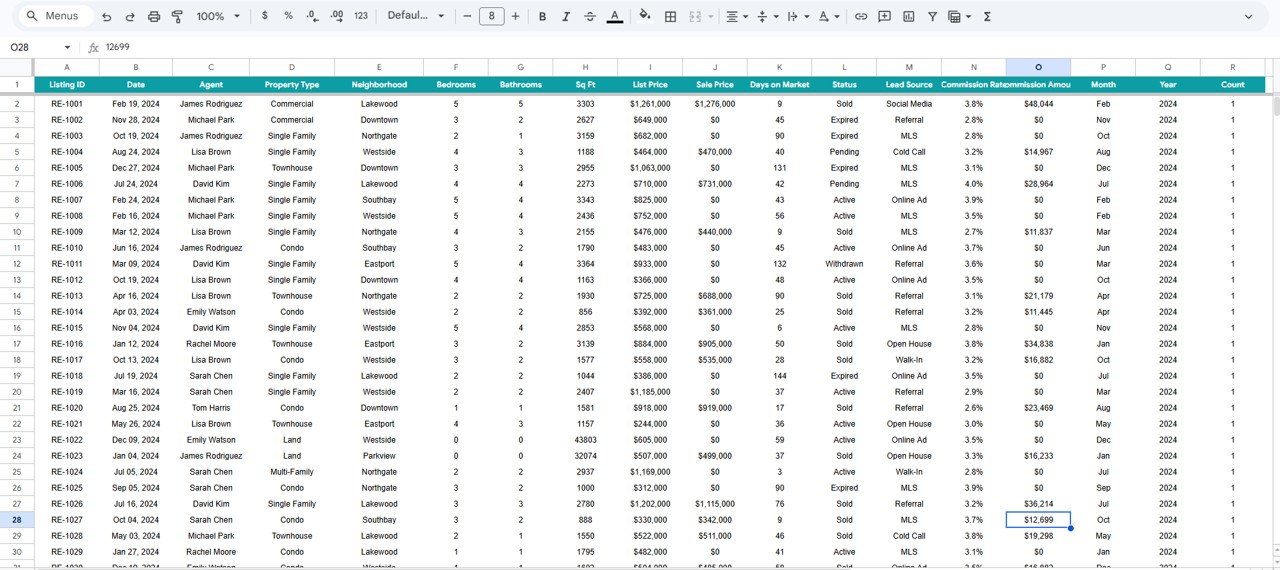 Data Sheet
Advantages of the Real Estate Agent Dashboard in Google Sheets
🛒 Click here to Purchase the Real Estate Agent Dashboard in Google Sheets
- Instant Business Visibility — See your entire real estate operation in one dashboard without switching between spreadsheets, CRMs, or tools
- Time Savings — Automated formulas and charts eliminate hours of manual report creation each week
- Team Accountability — Agent Performance page makes it easy to identify top performers and coaching opportunities
- Financial Clarity — Track commission trends, cumulative revenue, and sale-to-list ratios to understand your profitability
- Cloud-Based Collaboration — Share the Google Sheet with your team for real-time updates from any device
- No Software Costs — Google Sheets is free, so you only pay for the template itself
For an alternative platform experience, check out the Real Estate Agent Dashboard in Power BI or the Real Estate Agent Dashboard in Excel.
Opportunities for Improvement
- Adding a Lead Pipeline Tracker page could help agents manage prospects from initial contact through closing
- A Client Communication Log tab would centralize follow-up notes and appointment histories
- Integration with Google Calendar for showing and open house scheduling could enhance workflow efficiency
- Adding a Market Comparison section with external benchmark data would provide competitive context
Best Practices for Using This Dashboard
🛒 Click here to Purchase the Real Estate Agent Dashboard in Google Sheets
- Update data weekly — Enter new listings and update statuses every Friday for a fresh Monday morning view
- Use slicers strategically — Filter by neighborhood or property type during team meetings to focus discussions
- Review Agent Performance monthly — Use the close rate and commission charts to set coaching priorities
- Track the Sale to List Ratio — A ratio consistently below 1.0 may indicate overpricing in certain markets
- Share read-only copies — Give clients or stakeholders a view-only link so they can see progress without editing data
Explore Relevant Templates
🔹 Real Estate Agent Dashboard in Power BI — Advanced interactive analytics with Power BI visuals and drill-through capabilities
🔹 Real Estate Agent Dashboard in HTML — A browser-based SaaS-style dashboard that runs without any software
🔹 Rental Property Investment Dashboard in Google Sheets — Track rental income, expenses, cash flow, and ROI across your investment portfolio
🔹 Real Estate Agent Dashboard in Excel — The same comprehensive dashboard for Microsoft Excel users
Also explore the full collection of Google Sheets tutorials and templates on NeoTechNavigators and Real Estate Agent Dashboard in HTML blog post for more insights.
Frequently Asked Questions
🛒 Click here to Purchase the Real Estate Agent Dashboard in Google Sheets
What KPIs does the Real Estate Agent Dashboard in Google Sheets track?
The Real Estate Agent Dashboard in Google Sheets tracks over 15 key performance indicators across 4 analysis pages. These include Total Listings, Total Sales Volume, Avg List Price, Avg Days on Market, Total Commission, Active Listings, Pending Listings, Sold Listings, Avg Sq Ft, Avg Price per Sq Ft, Top Agent, Best Close Rate, Avg Commission per Deal, Sale to List Ratio, and Cumulative Commission Trends.
Do I need advanced Google Sheets skills to use this template?
No. The dashboard is fully pre-built with formulas and charts. You simply open the Data Sheet tab, replace the sample records with your own listing data, and every page updates automatically. No coding or formula knowledge is needed.
Can multiple agents use this dashboard simultaneously?
Yes. Since it runs in Google Sheets, you can share the file with your team. Multiple users can view and edit the data simultaneously, making it ideal for brokerage teams that need real-time collaboration.
How is this different from the Real Estate Agent Dashboard in Excel?
Both dashboards track the same KPIs and have similar page structures. The Google Sheets version offers cloud-based access, real-time collaboration, and no software installation. The Excel version offers offline access and is better for users who prefer Microsoft’s desktop environment.
What types of properties can I track with this dashboard?
You can track any property type — single-family homes, condos, townhouses, multi-family units, commercial properties, and more. The Property Type column in the Data Sheet accepts any category you define, and the charts automatically group by your property types.
Where can I learn more about using Google Sheets for business?
Visit our Google Sheets Help Center for official documentation, or explore our Google Sheets tutorials for practical guides and template walkthroughs.
Conclusion
🛒 Click here to Purchase the Real Estate Agent Dashboard in Google Sheets
The Real Estate Agent Dashboard in Google Sheets is a must-have tool for any real estate professional who wants to stop guessing and start making data-driven decisions. With 6 interactive pages, 15+ auto-updating KPIs, agent performance comparisons, and financial trend analysis, this template gives you a complete picture of your business in minutes. Replace the sample data, apply your filters, and you are ready to go.
🛒 Click here to Purchase the Real Estate Agent Dashboard in Google Sheets
🎥 Visit our YouTube channel for step-by-step tutorials: Youtube.com/@NeoTechNavigators
🛒 Click here to Purchase the Real Estate Agent Dashboard in Google Sheets