Skip to content
Monday, October 26, 2026
  • About
  • Contact Us

Neotech Navigators

Online Tutorial for Data Analysis and Automation

  • Home
  • Google Sheets
    • Templates (NextGenTemplates)
    • Dashboards
    • KPI Dashboards
  • HTML Dashboards
  • Power BI
  • SQL Tutorial
    • All SQL chapters
  • Python Tutorial
  • Template Store
  • Courses
  • Academy
    • Excel + AI Mastery: 100 Formulas
    • Excel Pivot Tables & Dashboards
  • More
    • MS Word
    • PowerPoint
    • Excel Tutorials (PK-AnExcelExpert)
    • About
    • Contact

Tag: Google Sheets real estate analytics

Templates

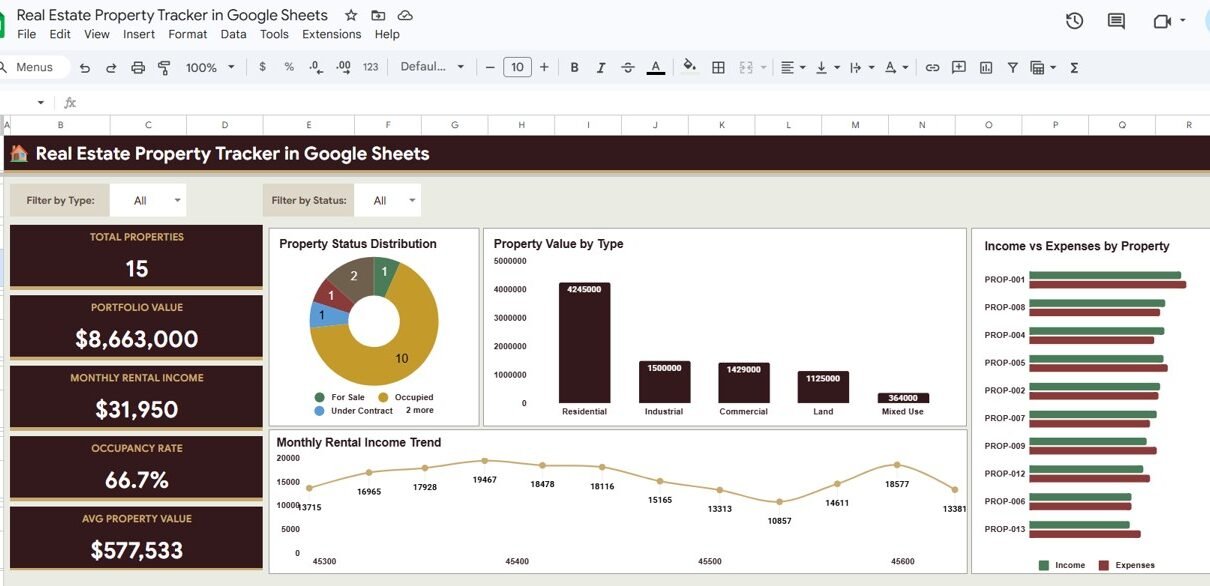
Real Estate Property Tracker in Google Sheets

May 7, 2026October 10, 2026PKComments Off on Real Estate Property Tracker in Google Sheets

Track properties, tenants, income, expenses, and maintenance in one Google Sheets tracker with 7 pages, 14+ charts, slicer filters, an investment calculator, and instant property search.
Dashboard

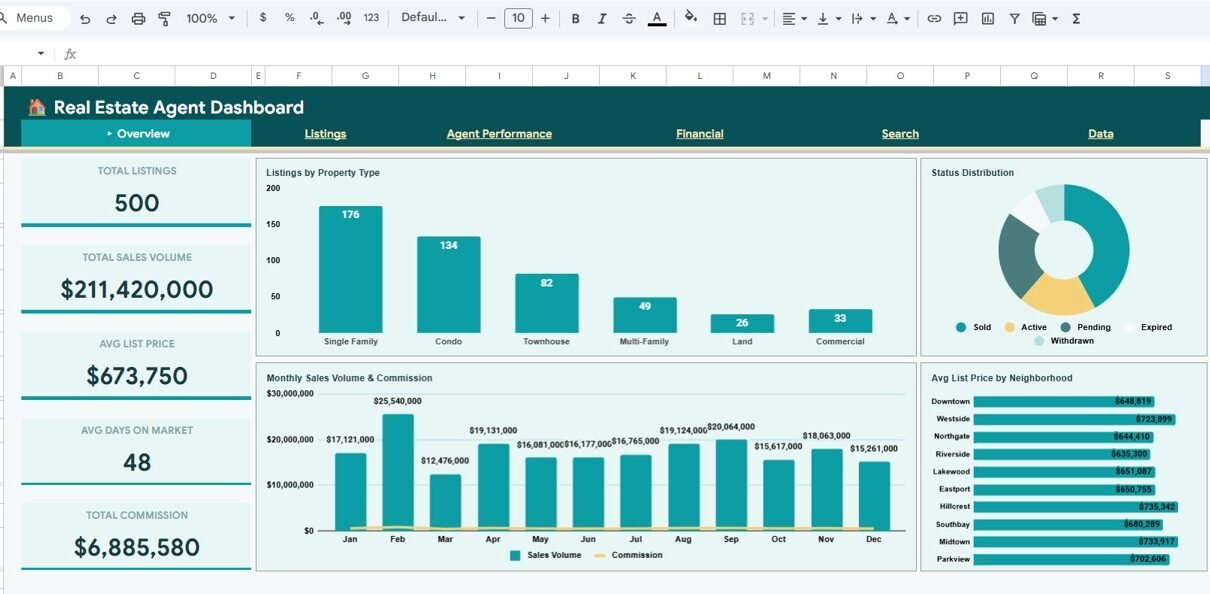
Real Estate Agent Dashboard in Google Sheets

April 10, 2026October 10, 2026PKComments Off on Real Estate Agent Dashboard in Google Sheets

Track listings, agent performance, commissions, and financial KPIs with the Real Estate Agent Dashboard in Google Sheets. 6 interactive pages with auto-updating charts and a search sheet.
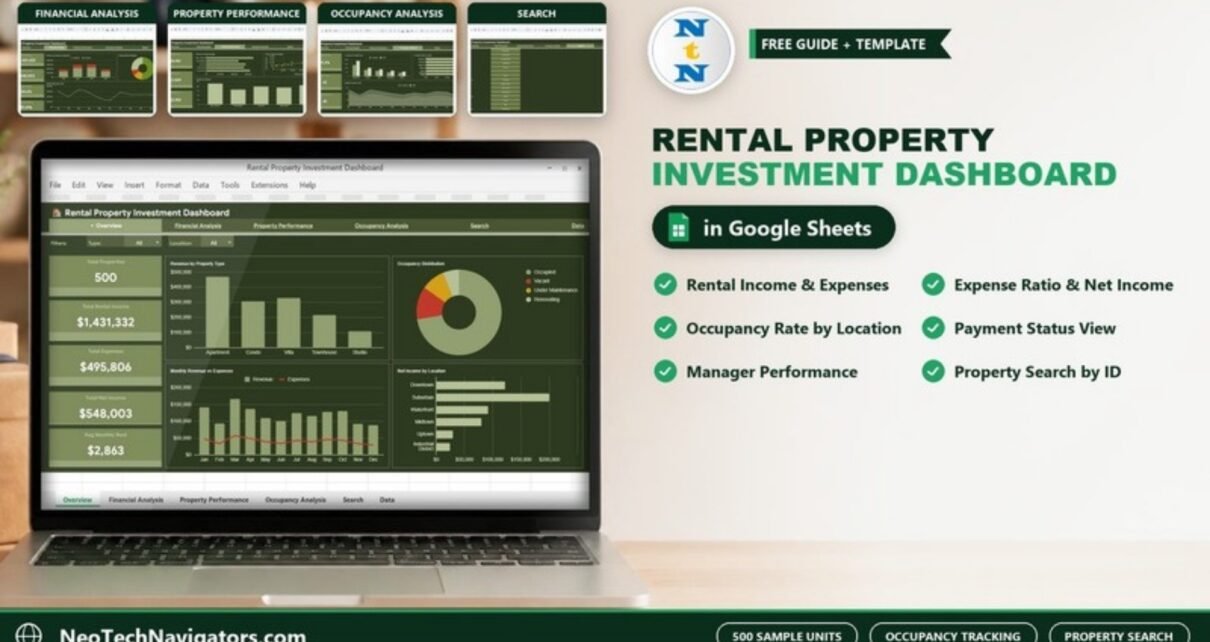
Laptop showing the Rental Property Investment Dashboard overview in Google Sheets with income KPIs, occupancy chart and page previews
KPI Dashboard

Rental Property Investment Dashboard in Google Sheets

April 6, 2026October 9, 2026PKComments Off on Rental Property Investment Dashboard in Google Sheets

A page-by-page guide to the Rental Property Investment Dashboard in Google Sheets: rental income, expense ratio, net income, occupancy, payment status and manager performance, with KPI formulas and setup steps.

Laptop showing the Real Estate Sales Performance Dashboard in Google Sheets with property count, total cost, area and rating KPI cards and region and lead source charts
Dashboard

Real Estate Sales Performance Dashboard in Google Sheets

November 8, 2025October 9, 2026PKComments Off on Real Estate Sales Performance Dashboard in Google Sheets

A Google Sheets dashboard that turns property records into four KPI cards and nine charts by status, region, lead source, property type, furnishing and client type.

Categories

  • AI
  • Dashboard
  • Formulas
  • Google Sheets
  • Google Sheets Templates
  • HTML Dashboard
  • KPI Dashboard
  • MS Word
  • Power BI
  • PowerPoint
  • Python
  • SQL
  • Templates
  • Windows

Popular Tutorials

  • Sales KPI Dashboard in Google Sheets
  • Dynamic Calendar with Holidays & Events
  • Multi-Location Inventory Management in Google Sheets
  • Attendance Sheet Template in Google Sheets
  • What is Power BI? A Beginner’s Guide
  • Cleaning Data with Power Query in Power BI
  • Complete Guide to SQL JOINs
  • How to Use Copilot in Windows 11

Free SQL Course

SQL from Scratch — a free, 31-chapter course from SELECT to window functions, with runnable examples and a final quiz.

Start the SQL course →

Browse all SQL chapters · All courses

Popular Tags

business KPI scorecard calendar template Checklist Template Customer Satisfaction Dashboard Template data analysis Database Data Visualization Google Apps Script Google Apps Script Management System Google Apps Script Web App Google Sheets Google Sheets calendar Google Sheets Dashboard Google Sheets Dashboard Template Google Sheets KPI Google Sheets KPI Dashboard google sheets kpi scorecard Google Sheets KPI template Google Sheets template Google Sheets Tracker Google Sheets tracker template Google Sheets Tutorial Healthcare HR Analytics HR Dashboard HTML Dashboard HTML Dashboard Template KPI Dashboard KPI Dashboard Google Sheets KPI Scorecard KPI tracking Learn SQL Performance Tracking personal finance Productivity Project management Spreadsheet Tips SQL Basics SQL for Beginners SQL Tutorial task management task tracker task tracking Web App Template
| Editorial by MysteryThemes.
  • Blog
  • Contact Us
  • About