Security Dashboard in Google Sheets is a ready-to-use, interactive analytics template designed for IT security managers, cybersecurity analysts, SOC teams, compliance officers, and CISOs who need complete visibility into their organization’s security incident landscape. This powerful Google Sheets Dashboard tracks 5 key performance indicators including Total Incidents, Total Impact Cost, Avg Response Time, Critical Incidents, and Resolution Rate across 4 interactive dashboard pages, a Search Page, and a Data Sheet — all within a single collaborative Google Sheets workbook.
Whether you manage internal cybersecurity operations, a managed security service, or enterprise SOC teams, this template transforms your scattered incident data into actionable visual insights. The dashboard covers threat analysis, compliance framework tracking (NIST CSF, ISO 27001, SOC 2), response performance analytics, and a dedicated incident lookup feature — making it one of the most comprehensive security analytics solutions available in Google Sheets today.
Key Features of Security Dashboard in Google Sheets
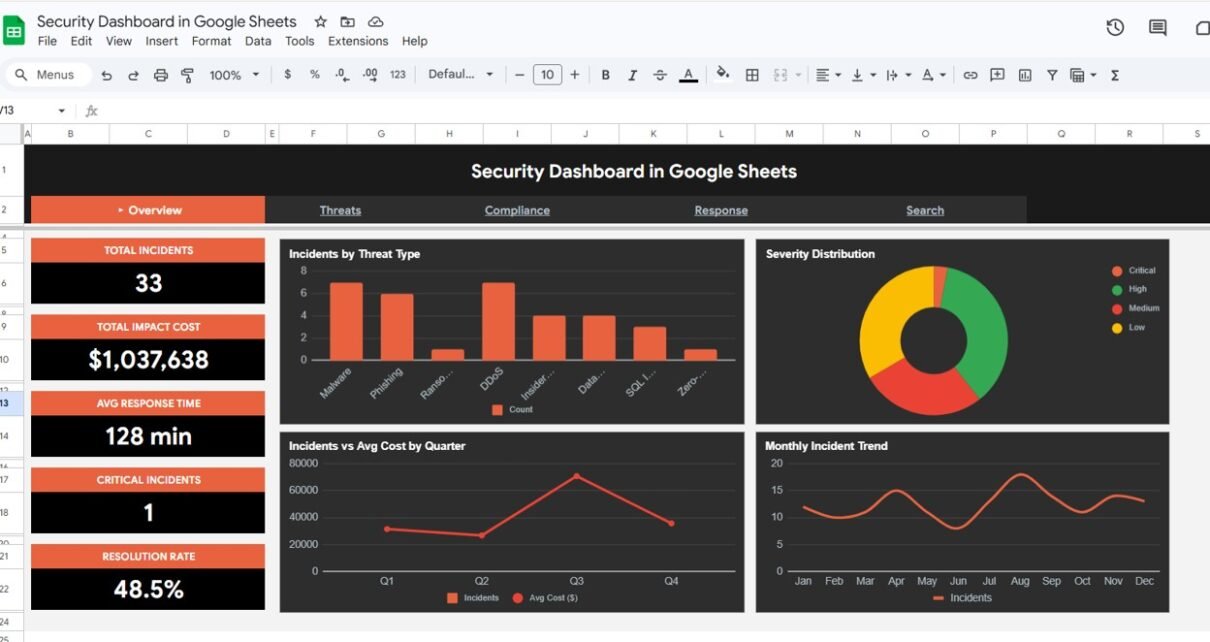
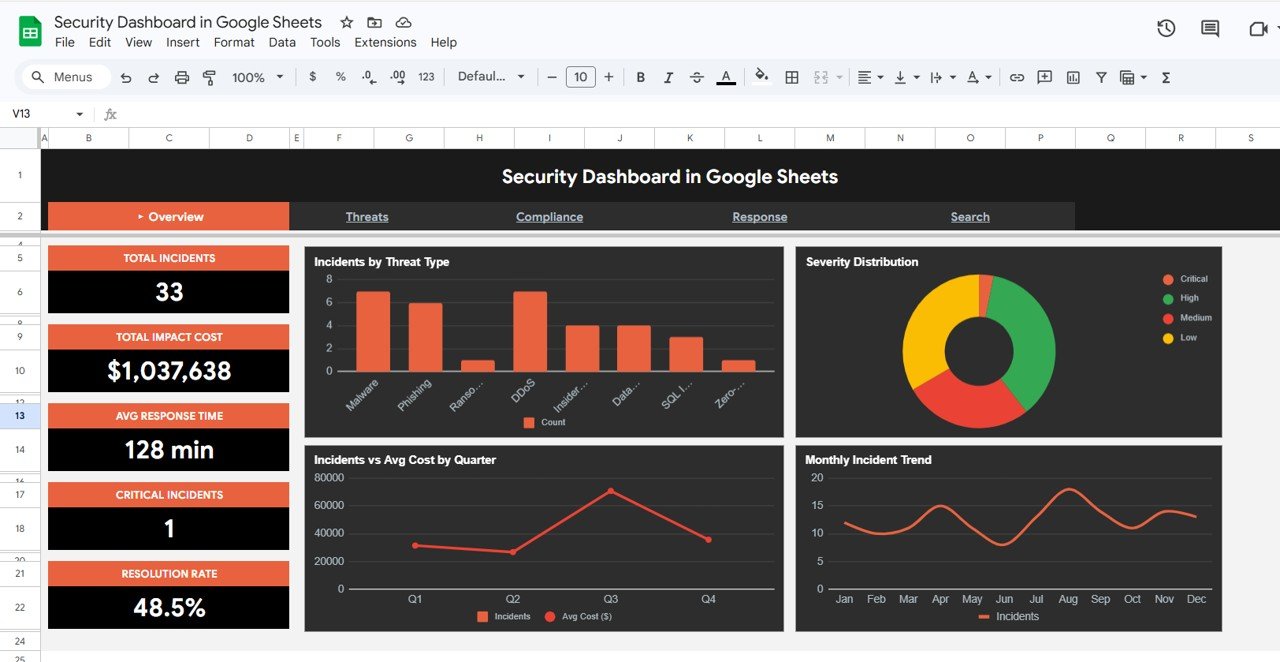
This Security Dashboard in Google Sheets includes 4 interactive dashboard pages plus a Search Page and structured Data Sheet. The Overview page displays 5 high-level KPI cards — Total Incidents, Total Impact Cost, Avg Response Time, Critical Incidents, and Resolution Rate — along with dynamic charts covering incident distribution by threat type, severity level breakdown, quarterly incident vs cost comparison, and monthly incident trends. Multiple slicers allow instant filtering across all dimensions for quick drill-down analysis.
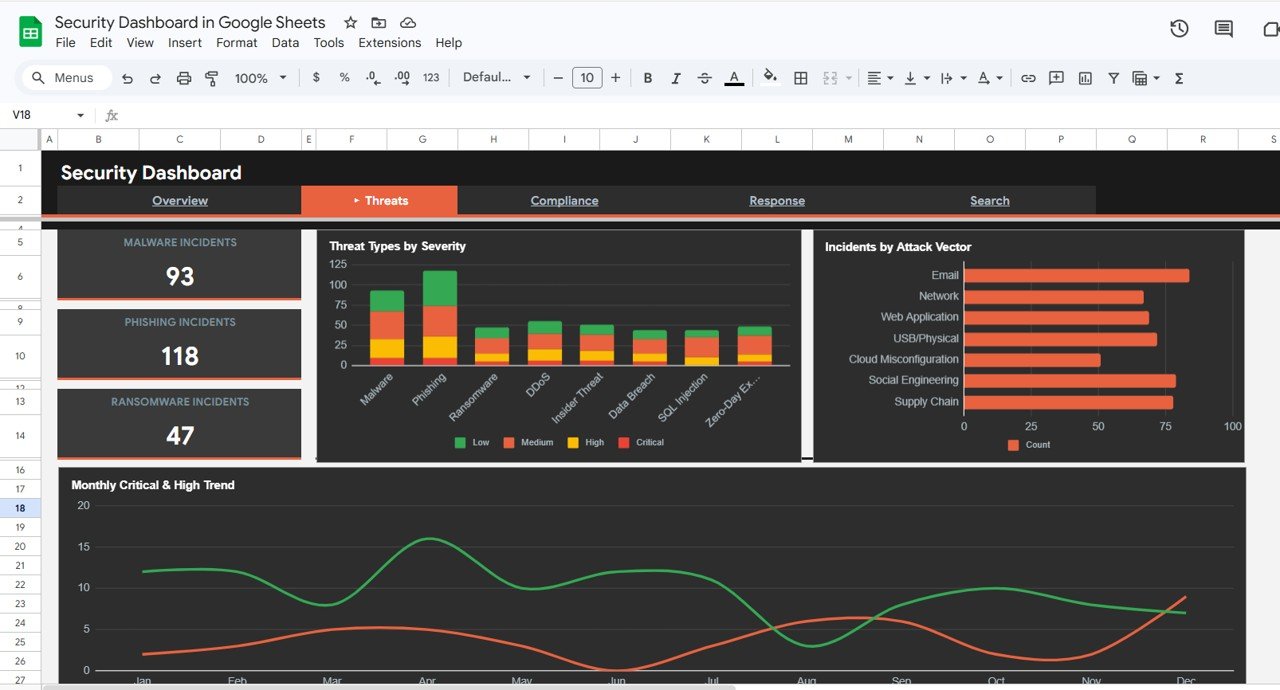
The dedicated Threats page provides deep-dive threat intelligence tracking Malware, Phishing, and Ransomware incidents with charts showing threat types by severity, incidents by attack vector, and monthly critical and high-priority trends. The Compliance page monitors NIST CSF, ISO 27001, and SOC 2 framework incidents with cost analysis and severity breakdowns. The Response page evaluates analyst performance, resolution rates, escalation patterns, and regional cost distribution.
A unique Incident Lookup Search Page lets you search by Incident ID and instantly view all related details including date, threat type, severity, source, target system, department, status, response time, impact cost, and assigned analyst. All charts auto-update using pure Google Sheets formulas with no scripts or macros required.
Dashboard Pages Explanation
1 — Overview Page
The Overview page is the main landing page of the Security Dashboard in Google Sheets. It displays 5 high-level KPI cards at the top: Total Incidents, Total Impact Cost, Avg Response Time, Critical Incidents, and Resolution Rate. Below the cards, you will find four analytical charts. Incidents by Threat Type shows how security events are distributed across different threat categories like malware, phishing, ransomware, and insider threats. Severity Distribution by Level breaks down all incidents by their severity classification. Incidents vs Avg Cost by Quarter compares quarterly incident volumes against their average financial impact. Monthly Incident Trend by Month reveals seasonal patterns and spikes in security events over time. Multiple slicers on this page allow you to filter the entire dashboard instantly by threat type, severity, region, or time period.
Security Dashboard in Google Sheets2 — Threats Page
The Threats page provides dedicated threat intelligence analysis. It features KPI cards for Malware Incidents, Phishing Incidents, and Ransomware Incidents at the top for quick reference. The charts on this page include Threat Types by Severity which breaks down each threat category by severity level to identify the most dangerous threats, Incidents by Attack Vector which identifies the most common methods used by threat actors to compromise systems, and Monthly Critical and High Trend by Month which tracks escalation patterns of high-priority threats over time. This page is essential for SOC teams and cybersecurity analysts who need to understand the evolving threat landscape.
 Threats Page
3 — Compliance Page
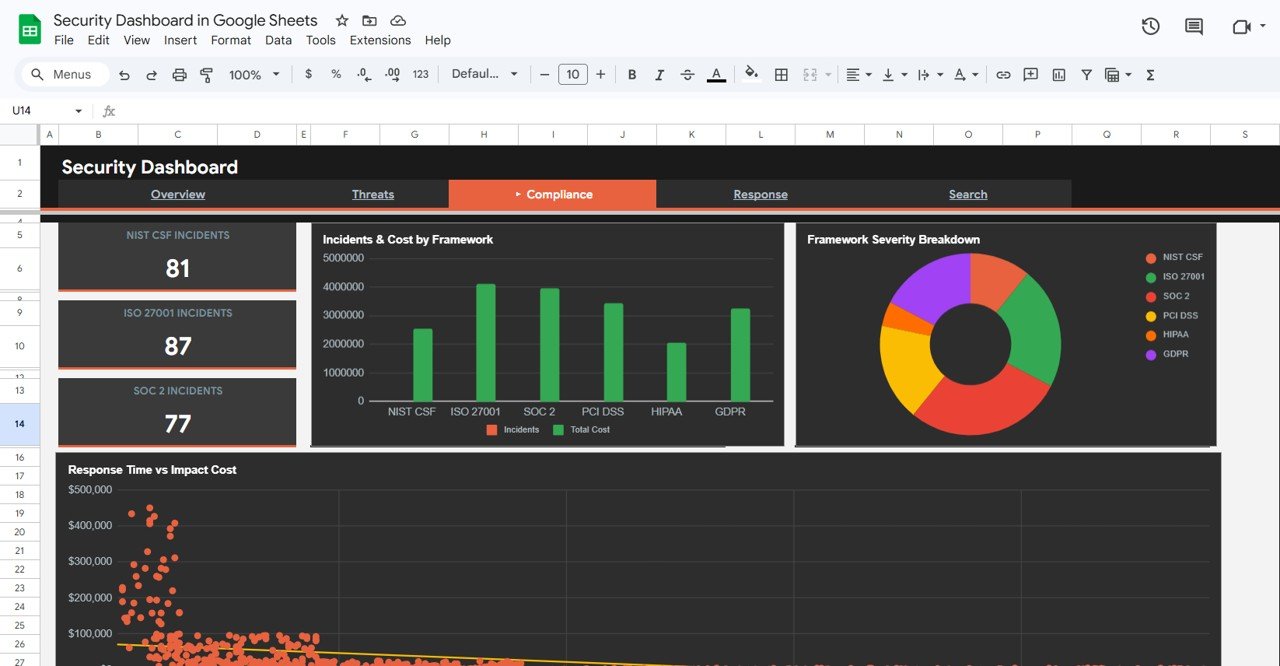
The Compliance page focuses on regulatory framework analysis. KPI cards show NIST CSF Incidents, ISO 27001 Incidents, and SOC 2 Incidents for immediate compliance visibility. Charts include Incidents and Cost by Framework which compares incident volumes and their financial impact across different compliance standards, Framework Severity Breakdown by Framework which shows how severity levels are distributed within each regulatory framework, and Response Time vs Impact Cost which reveals the correlation between incident response speed and total cost impact. This page is critical for compliance officers and risk management teams who need to demonstrate regulatory adherence and identify compliance gaps.
 Compliance Page
4 — Response Page
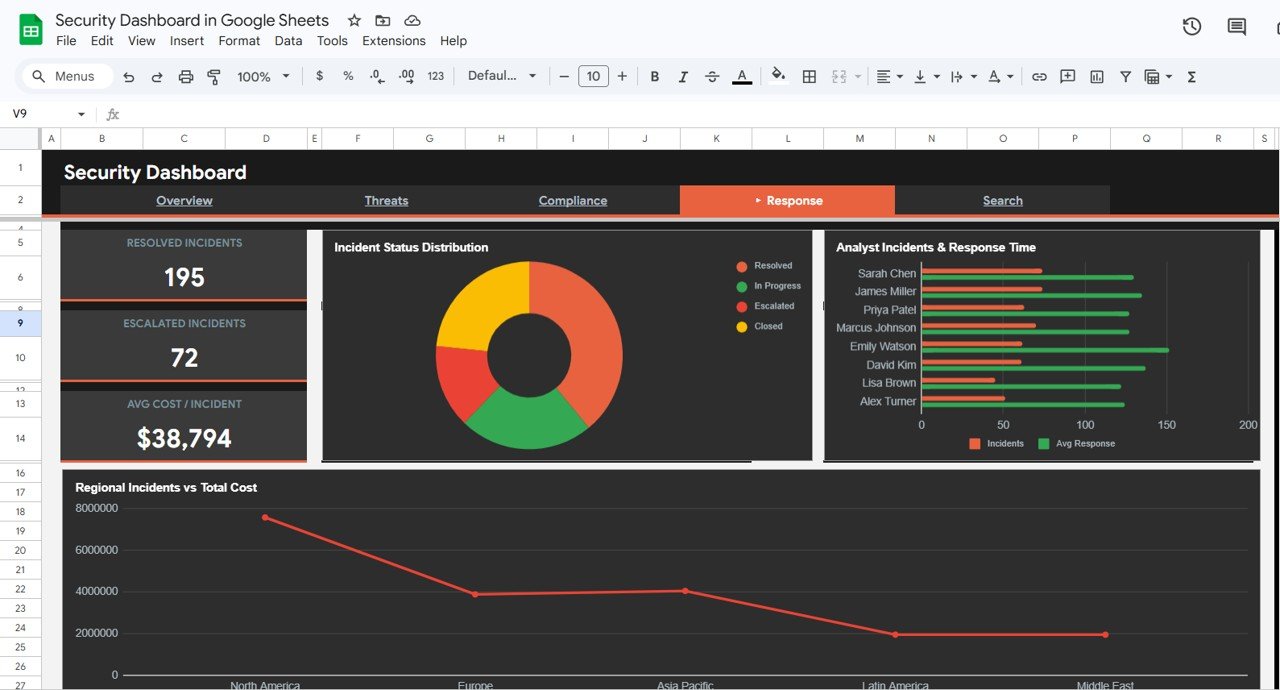
The Response page evaluates incident response performance across your security team. KPI cards display Resolved Incidents, Escalated Incidents, and Avg Cost per Incident. Charts include Incident Status Distribution by Status showing the current status breakdown of all incidents in your environment, Analyst Incidents and Response Time by Analyst which evaluates individual analyst workload and response efficiency for performance reviews and capacity planning, and Regional Incidents vs Total Cost by Region which identifies geographic hotspots with the highest incident volumes and associated financial impact. This page helps security managers optimize team allocation and improve response times.
 Response Page
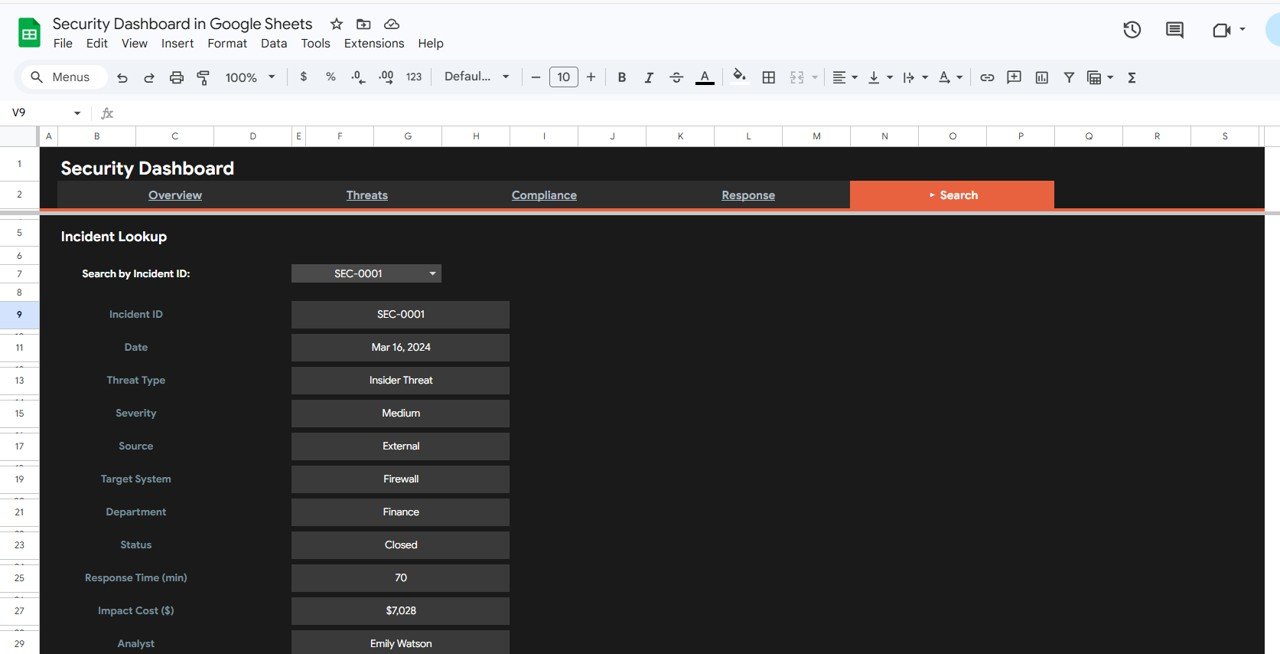
5 — Search Page
The Search Page features an Incident Lookup tool that allows you to search by Incident ID using a dropdown selector. Once an incident is selected, the page instantly displays all related details including Date, Threat Type, Severity, Source, Target System, Department, Status, Response Time, Impact Cost, and Analyst. This page is perfect for quick incident lookups during audits, management reviews, or when investigating specific security events without navigating through the raw data.
 Search Sheet Tab
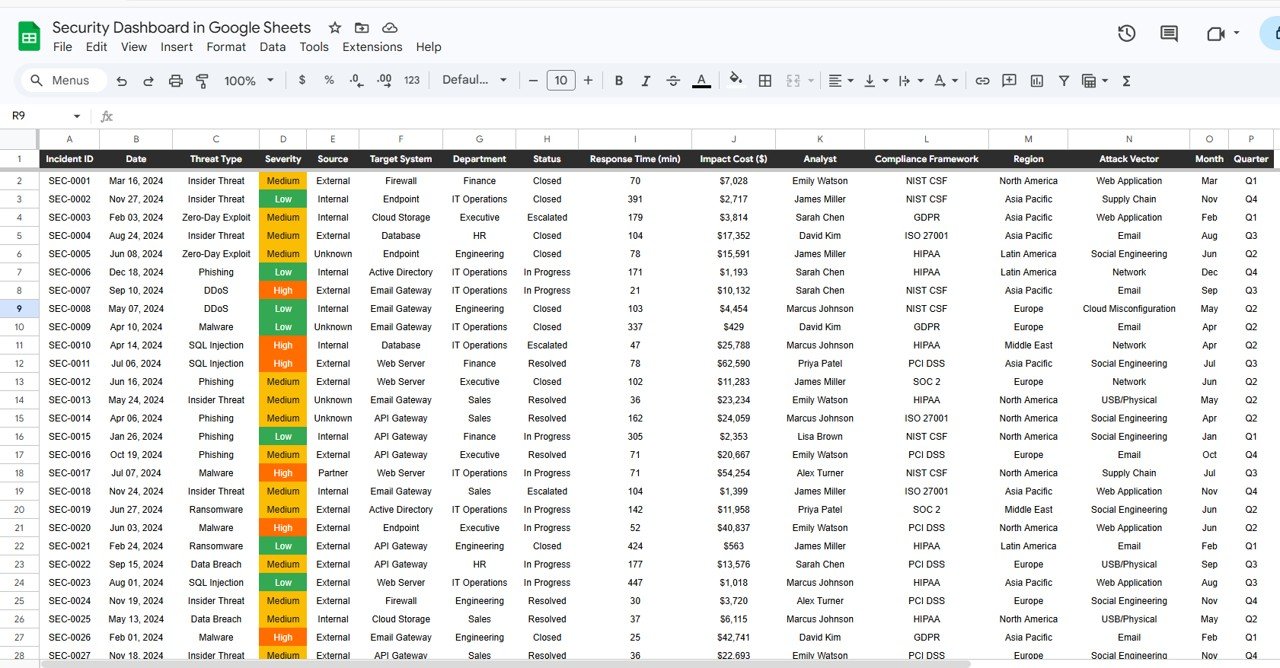
6 — Data Sheet Tab
The Data Sheet is where all your security incident records are stored in a structured format. It contains columns for every data point used across the dashboard including incident ID, date, threat type, severity, attack vector, source, target system, department, compliance framework, status, response time, impact cost, region, and analyst. Replace the sample data with your own records in the same column format and all dashboard pages update automatically.
 Data Sheet Tab
Advantages of Security Dashboard in Google Sheets
This template eliminates the need for expensive cybersecurity analytics platforms by delivering professional-grade incident monitoring inside Google Sheets. The collaborative nature of Google Sheets means your entire security team can access the dashboard simultaneously from any device with internet access. All charts are formula-driven with no scripts or macros required, ensuring maximum compatibility and zero maintenance overhead. The dashboard provides regulatory compliance visibility across NIST CSF, ISO 27001, and SOC 2 frameworks in one centralized view, saving hours of manual reporting. The incident lookup search page adds a unique self-service capability for quick audit trail reviews without disrupting the main dashboard views.
Opportunities for Improvement
Users with advanced Google Sheets skills can extend this dashboard by adding Google Apps Script automation for real-time data feeds from SIEM tools or ticketing systems. The compliance page could be expanded to include additional frameworks like PCI DSS, HIPAA, or GDPR by adding corresponding columns to the data sheet. Organizations with larger security teams may benefit from adding a dedicated analyst leaderboard page or integrating notification triggers for critical incidents using Google Sheets’ built-in email capabilities.
Best Practices
For optimal results, update your incident data regularly — ideally daily or weekly — to maintain dashboard accuracy. Use consistent naming conventions for threat types, severity levels, and analyst names to ensure clean chart aggregation. Take advantage of the slicer filters on the Overview page to create focused views for different stakeholders — executives may want a high-level overview while SOC analysts need granular threat data. Export filtered views to PDF for board-level reporting. Keep the Data Sheet as the single source of truth and avoid editing formulas in the dashboard pages directly.
Explore Relevant Templates
If you are looking for additional IT and security analytics tools, explore these related templates from NextGenTemplates:
- IT SLA Compliance and Ticket Monitoring Dashboard in Google Sheets — Track IT ticket SLA compliance, response times, and agent performance with interactive Google Sheets analytics.
- IT Services Dashboard in HTML — Monitor IT service requests, SLA compliance, team performance, and service trends with interactive browser-based analytics.
- Cloud Migration Services Dashboard in Power BI — Track cloud migration projects across platforms and industries with interactive Power BI visuals.
Browse all Google Sheets Dashboard Templates on NextGenTemplates.
Frequently Asked Questions
Click to Buy Security Dashboard in Google Sheets
What KPIs does the Security Dashboard in Google Sheets track?
The Security Dashboard in Google Sheets tracks 5 key performance indicators on the overview page: Total Incidents, Total Impact Cost, Avg Response Time, Critical Incidents, and Resolution Rate. Additional metrics across 4 analysis pages include threat type distribution, severity breakdown, compliance framework incidents for NIST CSF, ISO 27001, and SOC 2, analyst performance, and regional cost analysis.
Do I need advanced Google Sheets skills to use this dashboard?
No. Simply make a copy of the Google Sheet using the link provided in the PDF guide, replace the sample data with your own security incident records, and all charts and KPI cards update automatically. No scripts, macros, or advanced formulas to configure.
Can multiple team members access this dashboard simultaneously?
Yes. Since this dashboard runs on Google Sheets, you can share it with your entire security team via Google Drive. Multiple users can view and analyze the dashboard simultaneously from any device with internet access.
Which compliance frameworks does this dashboard support?
The Compliance page tracks incidents mapped to NIST CSF, ISO 27001, and SOC 2 frameworks out of the box. You can customize the data sheet to add additional compliance frameworks such as PCI DSS, HIPAA, or GDPR relevant to your organization.
What is the best Google Sheets template for tracking cybersecurity incidents?
The Security Dashboard in Google Sheets from NextGenTemplates is one of the best options available. It includes 4 interactive dashboard pages, 5 KPI cards, threat analysis, compliance tracking, response analytics, an incident lookup search page, and a structured data sheet all in a single collaborative Google Sheets workbook.
Can I use this dashboard for SOC 2 compliance reporting?
Yes. The dedicated Compliance page tracks SOC 2 incidents alongside NIST CSF and ISO 27001 with cost analysis and severity breakdown charts. You can filter by framework using slicers and export the filtered view for audit reporting purposes.
Conclusion
The Security Dashboard in Google Sheets is a comprehensive cybersecurity analytics solution that gives IT security teams, compliance officers, and CISOs complete visibility into incidents, threats, compliance posture, and response performance — all from a single collaborative Google Sheets workbook. With 4 interactive dashboard pages, 5 KPI cards, dedicated threat and compliance modules, analyst performance tracking, and an incident lookup search page, this template covers every aspect of security incident monitoring without requiring expensive BI tools or advanced technical skills.
Click here to Purchase Security Dashboard in Google Sheets
Visit our YouTube channel for step-by-step video tutorials: Youtube.com/@NeoTechNavigators
Click to Buy Security Dashboard in Google Sheets