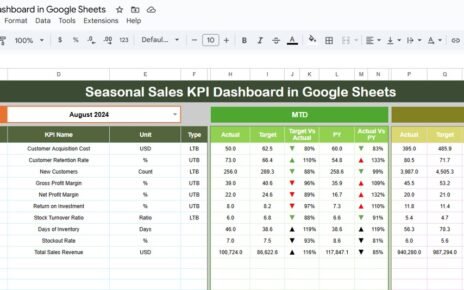
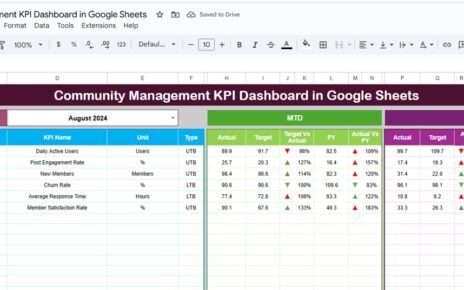
IT operations teams maintain the stability, performance, and availability of business systems. However, when systems grow complex, teams struggle to track incidents, downtime, service quality, costs, and workloads. Because of limited visibility, issues escalate faster, response slows down, and service quality suffers. That is why organizations now rely on structured KPI dashboards.
An IT Operations KPI Dashboard in Google Sheets provides a clear and centralized view of IT performance. It tracks incidents, uptime, response time, capacity, cost, and service quality in one place. Moreover, because the dashboard runs in Google Sheets, teams update data easily, collaborate in real time, and review performance anytime.
In this article, we explain how the dashboard works, all KPIs included, worksheet structure, benefits, improvement areas, and best practices for managing IT operations efficiently.
What Is an IT Operations KPI Dashboard in Google Sheets?
An IT Operations KPI Dashboard is a reporting and monitoring tool that tracks key metrics related to infrastructure, support, availability, performance, and efficiency. It helps IT leaders answer important questions such as:
-
How many incidents occurred this month?
-
How fast does the team resolve issues?
-
Are systems meeting uptime targets?
-
Where do performance bottlenecks appear?
-
Is IT cost under control?
Instead of reviewing multiple reports, the dashboard shows these insights through clear KPIs, trends, and comparisons.
Because it uses Google Sheets, the dashboard offers:
-
Real-time updates
-
Automated calculations
-
Month-wise and YTD tracking
-
Easy collaboration
-
No complex tools or coding
Key Features of the IT Operations KPI Dashboard
Click to Buy IT Operations KPI Dashboard in Google Sheets
The dashboard contains 6 interconnected worksheet tabs, each serving a specific purpose.
Dashboard Sheet Tab (Main Page)
This is the executive summary of IT operations performance.
-
In cell D3, you select the month from a dropdown list.
-
Once selected, the dashboard updates all KPI values automatically.
Metrics Displayed
MTD View
-
MTD Actual
-
MTD Target
-
MTD Previous Year
-
Target vs Actual
-
Previous Year vs Actual
YTD View
-
YTD Actual
-
YTD Target
-
YTD Previous Year
-
Target vs Actual
-
Previous Year vs Actual
The dashboard uses conditional formatting with up/down arrows:
-
🟢 Green arrow → performance improved
-
🔴 Red arrow → performance declined
This structure allows IT managers to assess operational health within minutes.

Click to Buy IT Operations KPI Dashboard in Google Sheets
KPI Trend Sheet Tab
This sheet enables detailed KPI analysis.
-
Select a KPI from the dropdown in cell C3.
The sheet displays:
-
KPI Group
-
KPI Unit
-
KPI Type (Lower the Better / Upper the Better)
-
KPI Formula
-
KPI Definition
It also shows month-wise trend charts, helping teams identify long-term patterns and early warning signs.

Click to Buy IT Operations KPI Dashboard in Google Sheets
Actual Number Sheet Tab
This sheet stores actual IT performance values.
-
Enter MTD Actual and YTD Actual data for each KPI.
-
Select the first month of the year in cell E1.
Once updated, the dashboard refreshes automatically.

Click to Buy IT Operations KPI Dashboard in Google Sheets
Target Sheet Tab
This sheet stores performance targets.
-
MTD Target for each KPI
-
YTD Target for each KPI
Targets help teams measure success against defined service objectives.

Click to Buy IT Operations KPI Dashboard in Google Sheets
Previous Year Number Sheet Tab
This sheet stores last year’s IT operations data.
It supports:
-
Year-over-year comparison
-
Maturity assessment
-
Trend-based decision-making

KPI Definition Sheet Tab
This reference sheet ensures consistency and governance.
It contains:
-
KPI Name
-
KPI Group
-
Unit
-
Formula
-
Definition
-
KPI Type (LTB / UTB)
Every stakeholder understands KPIs clearly through this sheet.

Click to Buy IT Operations KPI Dashboard in Google Sheets
Advantages of the IT Operations KPI Dashboard
-
Centralized IT performance tracking
-
Faster incident response improvement
-
Better SLA management
-
Reduced downtime and risk
-
Improved cost visibility
-
Easy executive reporting
-
No dependency on complex tools
Opportunities for Improvement in IT Operations Tracking
Click to Buy IT Operations KPI Dashboard in Google Sheets
-
Integrate ticketing tools like ServiceNow or Jira
-
Add category-wise incident analysis
-
Introduce predictive outage indicators
-
Implement SLA breach alerts
-
Track cloud vs on-prem infrastructure KPIs
Best Practices for Using the Dashboard
-
Update KPI values monthly without delay
-
Define clear SLA and incident severity rules
-
Review trends instead of single months
-
Align IT targets with business objectives
-
Maintain KPI definitions consistently
-
Use dashboard insights in review meetings
Conclusion
Click to Buy IT Operations KPI Dashboard in Google Sheets
An IT Operations KPI Dashboard in Google Sheets helps IT teams maintain service quality, reduce downtime, control costs, and improve operational efficiency. It transforms scattered IT data into actionable insights using structured KPIs and automated processing. Because it is easy to use, customizable, and collaborative, it becomes a powerful management tool for IT leaders and operations teams.
Frequently Asked Questions (FAQs)
1. Who should use this IT Operations dashboard?
IT managers, system administrators, service desk teams, and CIOs.
2. Can I add new KPIs?
Yes, the KPI Definition sheet supports customization.
3. Does this dashboard support YTD reporting?
Yes, it includes both MTD and YTD views.
4. Is Google Sheets secure for IT data?
Yes, with proper access control and permissions.
5. Can I automate data inputs later?
Yes, using Google Apps Script or APIs.
Visit our YouTube channel to learn step-by-step video tutorials
Youtube.com/@NeotechNavigators
Watch the step-by-step video tutorial:


