Customer renewals drive long-term revenue in any SaaS business. However, many companies still track renewals using scattered spreadsheets and manual reports. As a result, renewal risks, churn signals, and revenue leakage often go unnoticed. That is why a SaaS Renewal KPI Dashboard in Google Sheets becomes a critical tool for subscription-based businesses.
In this detailed article, you will clearly understand how a SaaS Renewal KPI Dashboard in Google Sheets works, which KPIs it tracks, how each KPI is calculated, and how every worksheet supports renewal performance analysis. Furthermore, you will find a complete KPI list with units, formulas, definitions, and performance direction.
What Is a SaaS Renewal KPI Dashboard in Google Sheets?
A SaaS Renewal KPI Dashboard in Google Sheets is a structured performance-tracking system designed to monitor subscription renewals, churn risk, revenue retention, and customer health.
Instead of relying on CRM exports or static reports, this dashboard consolidates renewal KPIs into one interactive Google Sheets file. Consequently, revenue teams, customer success managers, and leadership gain instant visibility into renewal performance.
Most importantly, Google Sheets enables dropdown-based filtering, MTD and YTD tracking, and automated trend analysis without complex BI tools.
Why Renewal KPIs Matter in SaaS Businesses
Click to Buy SaaS Renewal KPI Dashboard in Google Sheets
Renewals determine profitability in SaaS. Therefore, tracking the right KPIs helps businesses:
-
Predict churn before it happens
-
Improve renewal conversations
-
Increase net revenue retention
-
Identify high-risk customer segments
-
Align sales and customer success teams
Because renewals reflect customer satisfaction and value realization, SaaS companies must track them continuously.
Key Features of SaaS Renewal KPI Dashboard in Google Sheets
This dashboard includes 6 well-structured worksheets, each serving a specific purpose in renewal tracking.
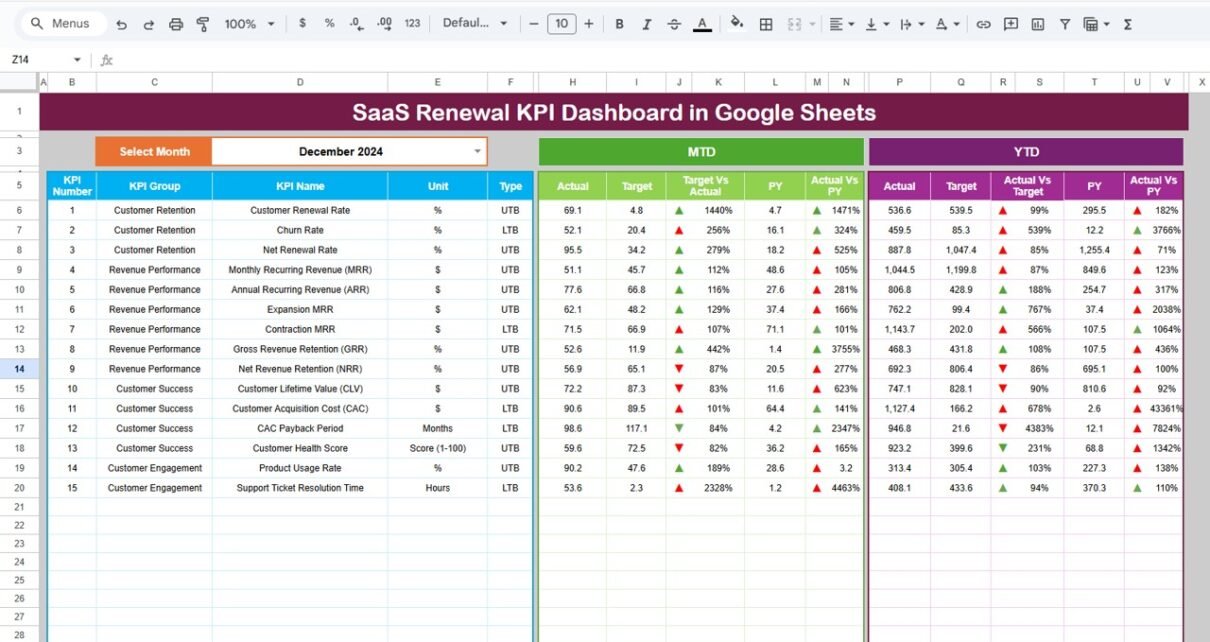
Dashboard Sheet Tab – Central Renewal Performance View
The Dashboard sheet acts as the main summary page.
Key Capabilities:
-
Month selection dropdown on Cell D3
-
Automatic update of all KPIs based on selected month
-
Visibility into:
-
MTD Actual vs Target
-
MTD Actual vs Previous Year
-
YTD Actual vs Target
-
YTD Actual vs Previous Year
-
-
Conditional formatting with up/down arrows for role clarity
This structure allows stakeholders to evaluate renewal health instantly.

Click to Buy SaaS Renewal KPI Dashboard in Google Sheets
KPI Trend Sheet – KPI Behavior & Definition Transparency
In the KPI Trend Sheet:
-
KPI selection dropdown available on Cell C3
-
Auto-display of:
-
KPI Group
-
KPI Unit
-
KPI Type (Upper the Better / Lower the Better)
-
KPI Formula
-
KPI Definition
-
This sheet ensures everyone understands what they measure and how they calculate it.

Click to Buy SaaS Renewal KPI Dashboard in Google Sheets
Actual Number Sheet – Enter Actual Renewal Performance
This sheet captures actual renewal results.
How It Works:
-
Month selector in Cell E1
-
Enter:
-
Monthly MTD actuals
-
YTD cumulative actuals
-
-
YTD auto-calculation based on month order
This keeps raw data clean and separate from visuals.

Target Sheet – Define Renewal Performance Goals
The Target Sheet holds planned renewal benchmarks.
Inputs Included:
-
KPI-wise MTD targets
-
KPI-wise YTD targets
-
Flexible to align with growth stages
Targets flow automatically into dashboard calculations.

Click to Buy SaaS Renewal KPI Dashboard in Google Sheets
Previous Year Number Sheet – YoY Renewal Analysis
This sheet stores previous year renewal KPI values.
By comparing current performance with last year, teams identify sustainable growth or risk patterns early.

KPI Definition Sheet – Master Control Sheet
The KPI Definition Sheet forms the backbone of the dashboard.
Columns Included:
-
KPI Name
-
KPI Group
-
Unit
-
Formula
-
KPI Definition
All other sheets reference this metadata dynamically.

Click to Buy SaaS Renewal KPI Dashboard in Google Sheets
Business Value of This Dashboard
This dashboard enables teams to:
-
Detect renewal risks early
-
Improve retention planning
-
Increase recurring revenue
-
Align CS and sales efforts
-
Track renewal performance objectively
Because renewal data updates dynamically, decisions stay proactive.
Advantages of SaaS Renewal KPI Dashboard in Google Sheets
Click to Buy SaaS Renewal KPI Dashboard in Google Sheets
-
No BI tool dependency
-
Clear MTD & YTD tracking
-
UTB/LTB clarity for each KPI
-
Strong YoY benchmarking
-
Easy customization
Best Practices for SaaS Renewal KPI Dashboard in Google Sheets
-
Standardize KPI definitions
-
Update actuals monthly
-
Review at-risk renewals weekly
-
Align targets with ARR plans
-
Keep visuals simple and focused
Conclusion
Click to Buy SaaS Renewal KPI Dashboard in Google Sheets
The SaaS Renewal KPI Dashboard in Google Sheets delivers a structured, transparent, and scalable way to track renewals, retention, and revenue stability. Because it combines KPI definitions, targets, actuals, and trends, the dashboard empowers SaaS teams to protect revenue and improve customer lifetime value.
When implemented correctly, this dashboard turns renewal tracking into a strategic growth engine.
Frequently Asked Questions (FAQs)
Is this dashboard suitable for B2B SaaS?
Yes, it works perfectly for SMB, mid-market, and enterprise SaaS models.
Can I add expansion KPIs later?
Yes, the KPI Definition Sheet supports unlimited scalability.
Does it support MTD and YTD tracking?
Yes, both MTD and YTD calculations are built-in.
Is Google Sheets enough for renewal tracking?
Yes, especially for small to mid-size SaaS teams.
How often should renewal KPIs be reviewed?
Monthly reviews work best, with weekly risk checks.
Watch the step-by-step video tutorial:
Visit our YouTube channel to learn step-by-step video tutorials