Employee benefits play a critical role in attracting, retaining, and motivating talent. However, managing benefits data across departments, providers, benefit types, and months can quickly become complex. Therefore, organizations need a centralized, visual, and easy-to-use system to monitor benefits cost, participation, and trends.
The Employee Benefits Dashboard in Google Sheets is a ready-to-use HR analytics solution that transforms raw benefits data into clear insights. In this detailed guide, you will learn what this dashboard is, how it works, its structure, charts, advantages, opportunities for improvement, best practices, and frequently asked questions.
What Is an Employee Benefits Dashboard in Google Sheets?
An Employee Benefits Dashboard in Google Sheets is an interactive reporting tool that consolidates employee benefits data into a single, visual interface. Instead of reviewing multiple spreadsheets or manual reports, HR teams can track:
-
Total benefits cost
-
Company vs. employee contribution
-
Active, pending, and expired benefits
-
Benefits by department, provider, and benefit type
-
Monthly trends and usage patterns
Moreover, since it is built in Google Sheets, the dashboard supports real-time collaboration, cloud access, and easy customization.
Why Is Employee Benefits Tracking Important?
Click to Buy Employee Benefits Dashboard in Google Sheets
Employee benefits represent a significant portion of total compensation costs. Without structured tracking:
-
HR budgets may exceed limits
-
Inefficient or underused benefits go unnoticed
-
Provider performance remains unclear
-
Reporting becomes time-consuming
Therefore, a benefits dashboard enables cost control, transparency, and smarter HR decisions.
Key Features of the Employee Benefits Dashboard
This ready-to-use dashboard is designed for clarity and efficiency.
🔹 Core Highlights
-
Interactive KPI cards for quick insights
-
Advanced filters (Month, Department, Benefit Type, Provider, Status)
-
Department-wise, benefit-type-wise, and provider-wise analysis
-
Monthly trend tracking
-
User-friendly design with no advanced technical skills required
Overview Sheet Tab – Executive Summary
Click to Buy Employee Benefits Dashboard in Google Sheets
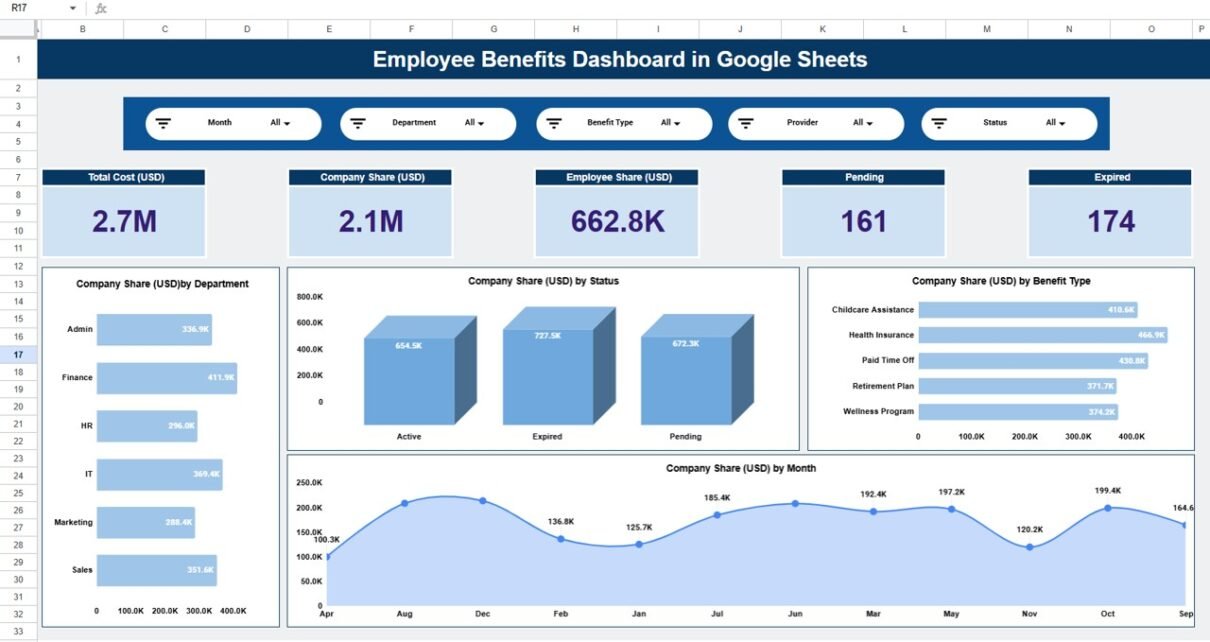
The Overview Sheet Tab provides a high-level snapshot of benefits performance.
📌 KPI Cards Display
-
Total Cost (USD) – Overall benefits spend
-
Company Share (USD) – Employer contribution
-
Employee Share (USD) – Employee contribution
-
Pending – Benefits awaiting activation or approval
-
Expired – Benefits that are no longer active
These KPIs help leadership understand benefits exposure instantly.

Click to Buy Employee Benefits Dashboard in Google Sheets
Department Summary – Team-Level Insights
The Department Summary page shows how benefits are distributed across teams.
📊 Charts Included
-
Company Share (USD) by Department
-
Total Cost (USD) by Department
-
Employee Share (USD) by Department
-
Active Benefits by Department
As a result, HR managers can identify departments with higher benefit costs or participation levels.

Click to Buy Employee Benefits Dashboard in Google Sheets
Benefit Type Summary – Benefits Utilization Analysis
The Benefit Type Summary focuses on different benefit programs offered by the organization.
📊 Key Visuals
-
Company Share (USD) by Benefit Type
-
Total Cost (USD) by Benefit Type
-
Employee Share (USD) by Benefit Type
-
Active Benefits by Benefit Type
This analysis helps organizations understand which benefits drive the highest cost and engagement.

Click to Buy Employee Benefits Dashboard in Google Sheets
Provider Summary – Vendor Performance Monitoring
Benefits are often managed through multiple providers. The Provider Summary page evaluates provider-wise performance.
📊 Charts Covered
-
Company Share (USD) by Provider
-
Total Cost (USD) by Provider
-
Employee Share (USD) by Provider
-
Active Benefits by Provider
This view supports vendor negotiations and contract optimization.

Click to Buy Employee Benefits Dashboard in Google Sheets
Monthly Trends – Benefits Over Time
The Monthly Trends section tracks benefit costs and activity across months.
📈 Trend Charts
-
Company Share (USD) by Month
-
Total Cost (USD) by Month
-
Employee Share (USD) by Month
-
Active Benefits by Month
These trends help HR teams forecast future costs and identify seasonal patterns.

Click to Buy Employee Benefits Dashboard in Google Sheets
Advantages of the Employee Benefits Dashboard
Centralized HR Data
All benefits information is stored in one dashboard.
Improved Cost Control
Company and employee contributions are clearly visible.
Better Decision-Making
Visual insights support strategic HR planning.
Time-Saving Reporting
No need for manual report preparation.
Easy Collaboration
Multiple users can work simultaneously in Google Sheets.
Opportunities for Improvement
Click to Buy Employee Benefits Dashboard in Google Sheets
You can enhance this dashboard further by:
-
Integrating Google Forms for benefit enrollment
-
Adding budget vs. actual comparisons
-
Including benefit satisfaction scores
-
Automating alerts for expired benefits
Best Practices for Using the Dashboard
-
Update benefits data regularly
-
Review department-wise costs monthly
-
Track expired and pending benefits closely
-
Use provider insights during contract renewals
-
Share dashboard access with HR leadership
Who Should Use This Dashboard?
Click to Buy Employee Benefits Dashboard in Google Sheets
This dashboard is ideal for:
-
HR managers
-
Compensation & benefits teams
-
Finance and payroll teams
-
Business leaders
-
Growing organizations and enterprises
Conclusion
The Employee Benefits Dashboard in Google Sheets is a powerful yet simple tool for managing benefits data effectively. With clear KPIs, interactive charts, and flexible filters, it helps organizations control costs, improve transparency, and make informed HR decisions.
If you want a ready-to-use, customizable, and collaborative benefits analytics solution, this dashboard is an excellent choice.
Frequently Asked Questions (FAQs)
Click to Buy Employee Benefits Dashboard in Google Sheets
Is this dashboard customizable?
Yes, all KPIs, charts, and categories can be modified.
Can it handle multiple benefit providers?
Absolutely. Provider-wise analysis is built in.
Do I need advanced Google Sheets skills?
No. The dashboard is beginner-friendly.
Can multiple users access it at the same time?
Yes, Google Sheets supports real-time collaboration.
Is it suitable for audits and reporting?
Yes, it is ideal for HR audits and management reporting.
Visit our YouTube channel to learn step-by-step video tutorials
Youtube.com/@NeotechNavigators
Watch the step-by-step video tutorial: