Remote work has become a major part of modern business operations. Many companies now allow employees to work from home, remote offices, or hybrid environments. While remote work offers flexibility and improved productivity, organizations must still monitor performance, collaboration, and operational efficiency.
However, managing remote teams without proper data can become difficult. Managers often struggle to track productivity, communication efficiency, employee engagement, and project completion rates. Because remote work generates data from multiple tools such as project management platforms, communication tools, and time-tracking systems, businesses need a centralized system to analyze this information.
Therefore, companies increasingly rely on KPI dashboards to monitor remote work performance. One powerful solution is the Remote Work KPI Dashboard in Google Sheets.
The Remote Work KPI Dashboard in Google Sheets is a structured analytics dashboard that helps organizations track key performance indicators related to remote work operations. Because Google Sheets updates data dynamically and supports real-time collaboration, businesses can easily monitor performance metrics and make data-driven decisions.
In this article, we will explore everything about the Remote Work KPI Dashboard in Google Sheets, including its structure, features, advantages, best practices, and frequently asked questions.
What Is a Remote Work KPI Dashboard in Google Sheets?
A Remote Work KPI Dashboard in Google Sheets is a performance monitoring system that tracks important remote work metrics using structured tables, charts, and KPIs.
The dashboard consolidates multiple performance indicators into one centralized interface. As a result, managers can evaluate employee productivity, project efficiency, communication effectiveness, and overall remote work performance.
Typically, the dashboard tracks metrics such as:
- Employee productivity
- Task completion rate
- Meeting attendance rate
- Response time to communication
- Project delivery performance
- Remote collaboration efficiency
- Work hours utilization
- Employee satisfaction levels
Because Google Sheets automatically updates formulas and supports real-time collaboration, managers can monitor KPIs continuously without switching between multiple tools.
Why Do Companies Need a Remote Work KPI Dashboard?
Click to Buy Remote Work KPI Dashboard in Google Sheets
Remote work environments require strong monitoring systems. Without proper measurement tools, managers cannot evaluate team performance accurately.
A Remote Work KPI Dashboard solves this challenge by providing a centralized analytics platform.
Centralized Performance Monitoring
First, the dashboard brings all KPI data into one location. Therefore, managers can analyze remote work performance quickly.
Real-Time Data Updates
Because Google Sheets supports real-time updates, users can monitor performance metrics continuously.
Improved Decision Making
Visual performance indicators allow managers to identify problems early. Consequently, organizations can take corrective actions quickly.
Better Team Productivity Tracking
The dashboard highlights productivity trends across teams and departments.
Data-Driven Remote Work Strategy
Finally, businesses can improve remote work policies using data insights rather than assumptions.
Key Features of the Remote Work KPI Dashboard in Google Sheets
The Remote Work KPI Dashboard in Google Sheets contains six worksheets that organize KPI data efficiently.
Each worksheet focuses on a specific component of KPI monitoring.
1. Dashboard Sheet Tab
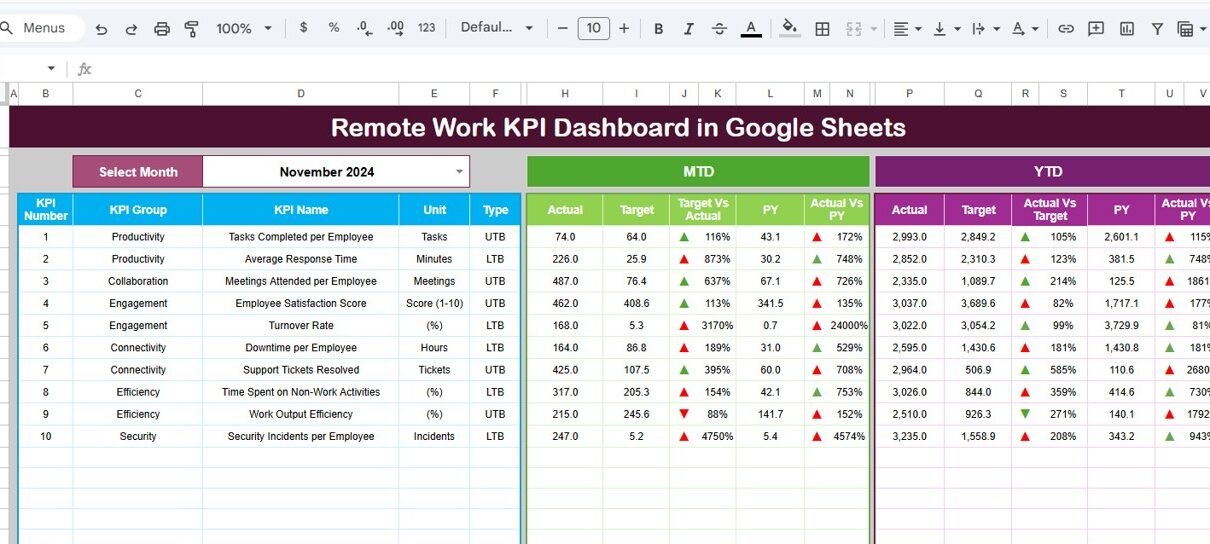
The Dashboard Sheet is the main interface of the KPI dashboard.
This page displays the overall KPI performance in an easy-to-read format.
Month Selection Feature
In cell D3, users can select the month from a dropdown list.
Once the user selects a month, the entire dashboard automatically updates the numbers for that selected period.
This feature allows managers to analyze performance month by month.
KPI Performance Metrics
The dashboard displays the following data:
MTD (Month-to-Date) Metrics
-
MTD Actual
-
MTD Target
-
MTD Previous Year
-
Target vs Actual comparison
-
Previous Year vs Actual comparison
YTD (Year-to-Date) Metrics
-
YTD Actual
-
YTD Target
-
YTD Previous Year
-
Target vs Actual comparison
-
Previous Year vs Actual comparison
Conditional formatting uses up and down arrows to indicate KPI performance trends.
For example:
-
Green upward arrow indicates performance improvement.
-
Red downward arrow indicates performance decline.
Therefore, managers can quickly identify which KPIs perform well and which require attention.
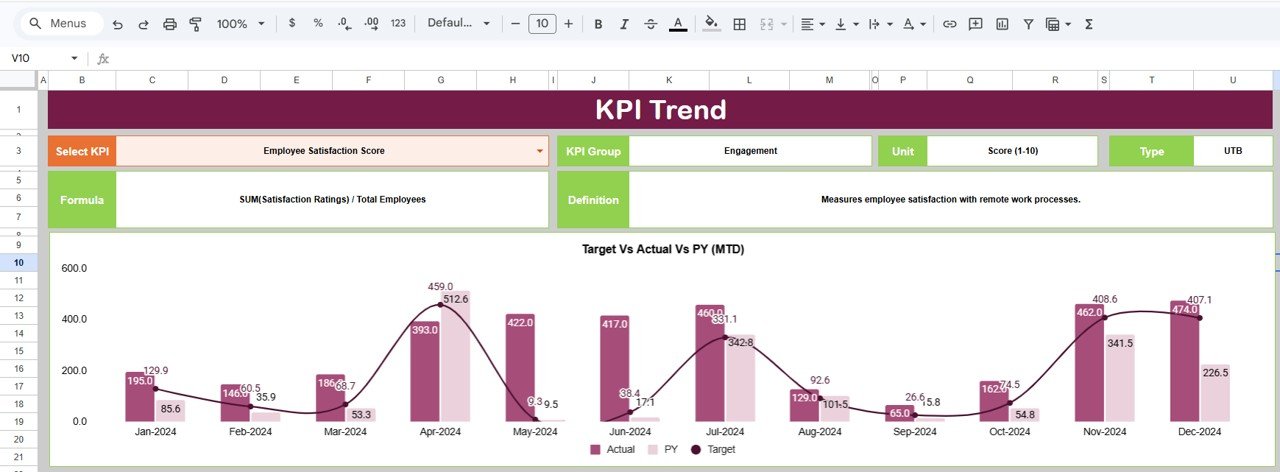
2. KPI Trend Sheet Tab
Click to Buy Remote Work KPI Dashboard in Google Sheets
The KPI Trend Sheet allows users to analyze the historical trend of a specific KPI.
In cell C3, users can select a KPI name from the dropdown list.
Once selected, the sheet displays important KPI information such as:
-
KPI Group
-
KPI Unit
-
KPI Type (Lower the Better or Upper the Better)
-
KPI Formula
-
KPI Definition
This sheet helps users understand the logic and purpose of each KPI.
For example:
-
Upper the Better KPIs: Productivity rate, task completion rate, employee engagement score.
-
Lower the Better KPIs: Response delay time, project delay rate, absenteeism rate.
Therefore, the KPI Trend sheet provides both analytical insights and KPI documentation.
Click to Buy Remote Work KPI Dashboard in Google Sheets
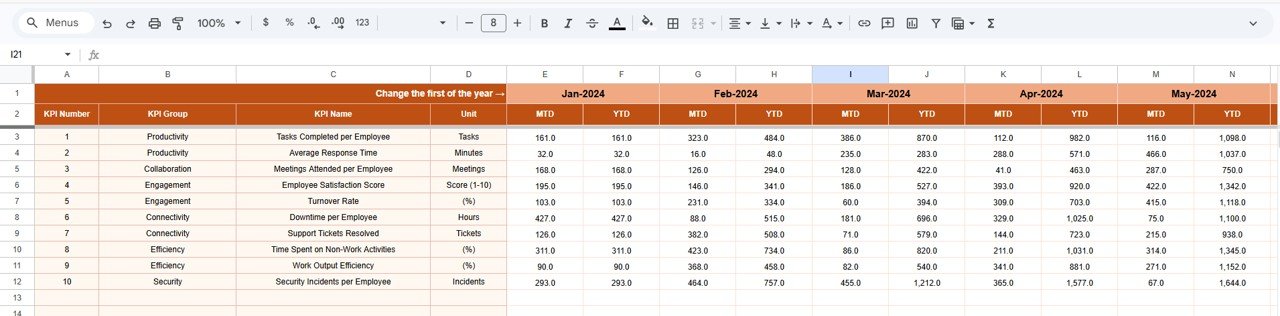
3. Actual Number Sheet Tab
The Actual Number Sheet is where users enter the actual performance data.
Users must input the actual values for:
-
MTD (Month-to-Date)
-
YTD (Year-to-Date)
Month Selection
In cell E1, users can select the starting month of the year.
Once the month is selected, the sheet updates the data entry structure accordingly.
This sheet ensures accurate recording of actual KPI values for each month.
Click to Buy Remote Work KPI Dashboard in Google Sheets
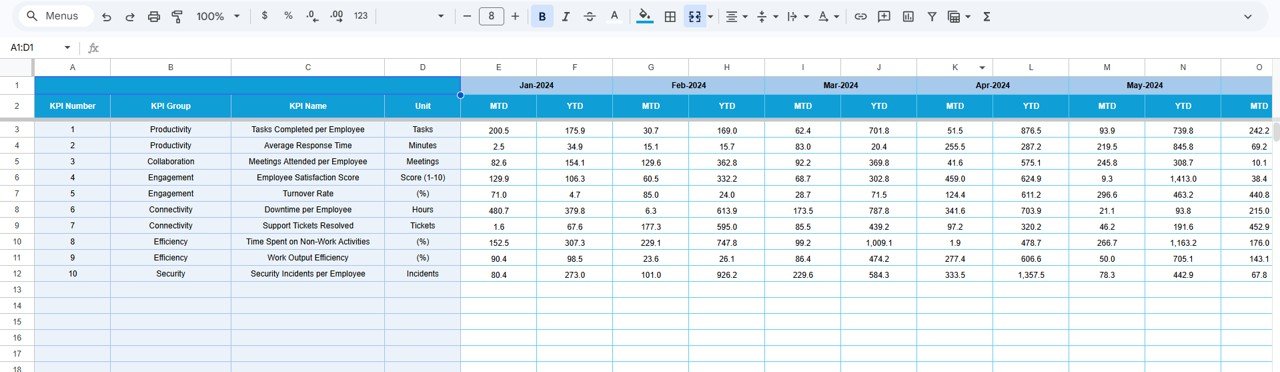
4. Target Sheet Tab
The Target Sheet stores the expected performance values for each KPI.
Users must enter:
-
Monthly Target Values (MTD)
-
Year-to-Date Target Values (YTD)
These targets allow the dashboard to compare expected performance with actual results.
Therefore, managers can easily identify performance gaps.
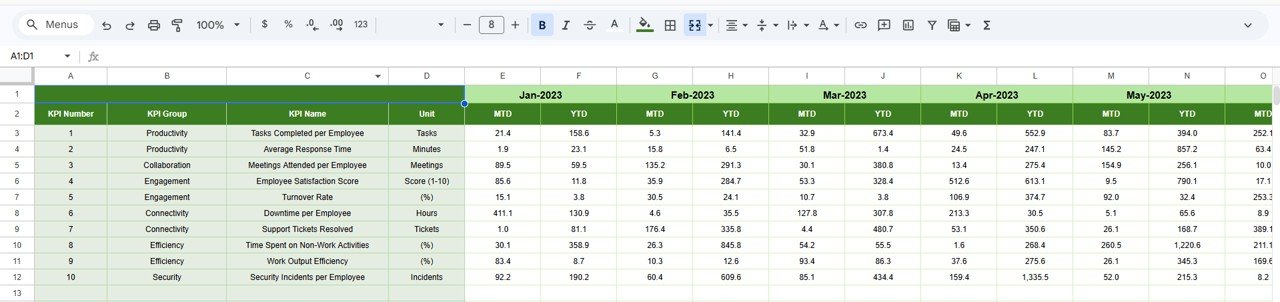
5. Previous Year Number Sheet Tab
This sheet stores historical data from the previous year.
Users enter previous year KPI values similar to the current year data.
These numbers allow the dashboard to calculate:
-
Previous Year vs Actual comparison
-
Year-over-year performance trends
As a result, businesses can analyze long-term performance improvements.
Click to Buy Remote Work KPI Dashboard in Google Sheets
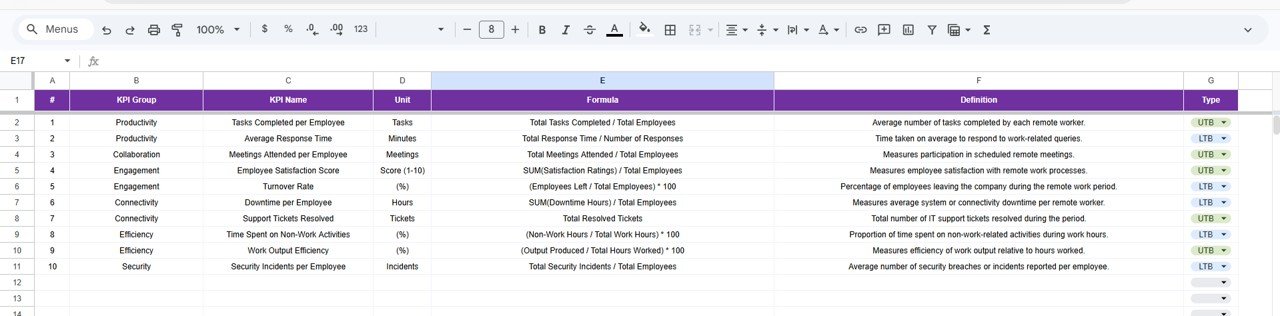
6. KPI Definition Sheet Tab
The KPI Definition Sheet acts as the documentation center of the dashboard.
Users must enter the following information:
- KPI Name
- KPI Group
- KPI Unit
- KPI Formula
- KPI Definition
This sheet ensures that every KPI remains clearly defined and standardized across the organization.
Because teams understand KPI calculations and objectives, reporting accuracy improves.
Click to Buy Remote Work KPI Dashboard in Google Sheets
Advantages of Remote Work KPI Dashboard in Google Sheets
Using a KPI dashboard for remote work monitoring provides several benefits.
Real-Time Performance Tracking
Managers can monitor remote work performance continuously.
Data-Driven Decision Making
Visual insights help leaders make informed business decisions.
Improved Accountability
Employees understand how their performance contributes to business goals.
Better Productivity Monitoring
Managers can identify productivity trends across teams.
Easy Collaboration
Because Google Sheets supports real-time collaboration, teams can update KPI data easily.
Opportunities for Improvement
Although the dashboard provides powerful insights, organizations can enhance it further.
Integration with Project Management Tools
Connecting tools such as Jira, Asana, or Trello can automate data updates.
Automated Data Collection
APIs can pull real-time performance metrics automatically.
Employee Performance Segmentation
Segmenting employees by role, team, or department can reveal deeper insights.
Predictive Performance Analytics
Machine learning models can forecast productivity trends.
Best Practices for the Remote Work KPI Dashboard
Click to Buy Remote Work KPI Dashboard in Google Sheets
Organizations should follow best practices to maximize dashboard effectiveness.
Define Clear KPIs
Every KPI must have a clear definition, formula, and unit.
Update Data Regularly
Frequent updates ensure accurate performance monitoring.
Focus on Actionable Metrics
Avoid tracking too many KPIs. Instead, focus on metrics that drive decision-making.
Maintain Data Accuracy
Clean and validated data ensures reliable analytics.
Use Visual Indicators
Conditional formatting such as arrows and color indicators improves readability.
Conclusion
Click to Buy Remote Work KPI Dashboard in Google Sheets
The Remote Work KPI Dashboard in Google Sheets provides an effective way to monitor remote work performance using structured KPIs and visual analytics. Because remote teams operate across multiple locations and systems, organizations need a centralized dashboard to track productivity, collaboration, and operational efficiency.
This dashboard simplifies performance monitoring through six structured worksheets: Dashboard, KPI Trend, Actual Numbers, Target, Previous Year Data, and KPI Definitions. Together, these components provide a comprehensive view of remote work performance.
Moreover, Google Sheets enables real-time updates and collaboration, which allows teams to analyze performance continuously. By using this dashboard, organizations can improve productivity, enhance accountability, and make smarter business decisions.
Visit our YouTube channel to learn step-by-step video tutorials
Youtube.com/@NeotechNavigators
Watch the step-by-step video tutorial: