In today’s fast-paced software development world, Agile teams work in short sprints to deliver value quickly. However, tracking sprint performance, team productivity, and delivery efficiency becomes challenging without proper tools.
Many teams still rely on scattered spreadsheets. As a result, they struggle to monitor KPIs, compare targets, and improve performance.
Therefore, organizations now adopt smart dashboards to simplify Agile tracking. That’s where the Agile Sprint KPI Dashboard in Google Sheets becomes a powerful solution.
In this comprehensive guide, you will learn everything about this dashboard. Moreover, you will understand its structure, features, advantages, best practices, and how it helps Agile teams deliver better results.
What is an Agile Sprint KPI Dashboard in Google Sheets?
An Agile Sprint KPI Dashboard in Google Sheets is an interactive reporting tool designed to track Agile performance using key metrics.
It helps you monitor:
-
Sprint velocity
-
Task completion rate
-
Bug resolution
-
Team productivity
-
Target vs actual performance
-
Monthly and yearly trends
Instead of using multiple reports, you can manage all KPIs in one centralized dashboard. As a result, you gain better visibility and control over your Agile processes.
Why Do Agile Teams Need KPI Dashboards?
Agile teams generate data in every sprint. However, without structured tracking, teams cannot measure success properly.
Therefore, a KPI dashboard helps you:
-
Track sprint performance in real time
-
Identify bottlenecks quickly
-
Improve team productivity
-
Compare targets vs actual results
-
Make faster decisions
Moreover, it eliminates manual reporting and saves time.
Key Features of Agile Sprint KPI Dashboard in Google Sheets
Click to Buy Agile Sprint KPI Dashboard in Google Sheets
This dashboard includes 6 well-structured worksheets, each designed for specific functionality.
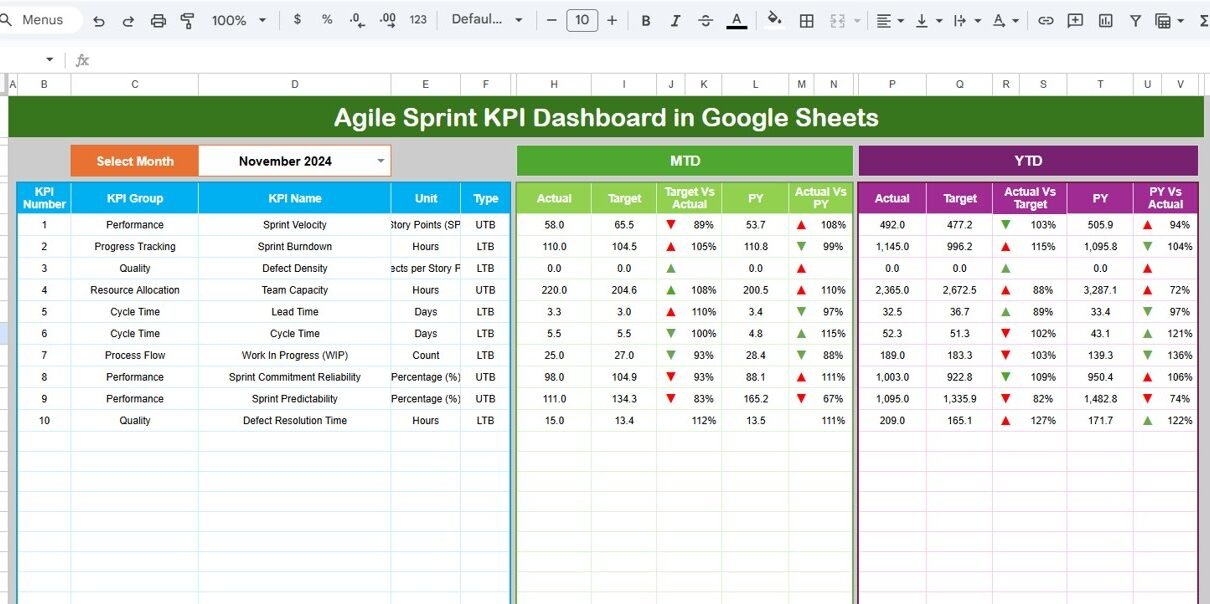
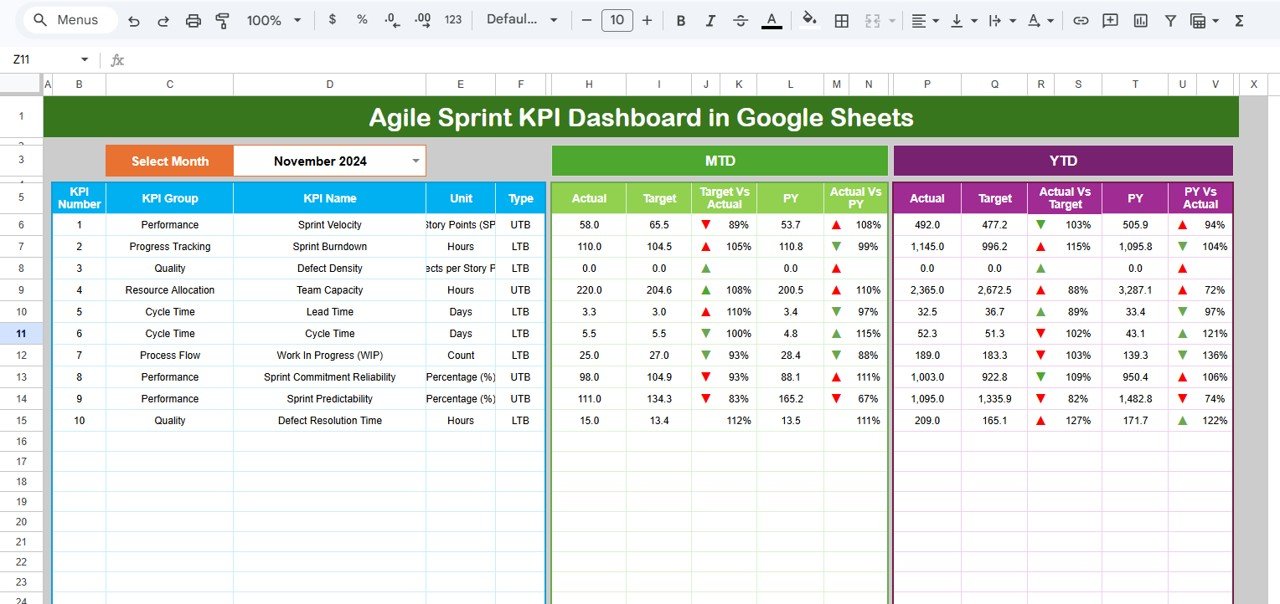
📌 1. Dashboard Sheet – Central Performance View
This is the main sheet tab where all KPI insights are displayed.
🔹 Key Features:
-
Month selector (Cell D3 dropdown)
-
Dynamic dashboard updates
📊 Metrics Displayed:
✅ MTD (Month-to-Date):
-
Actual
-
Target
-
Previous Year
-
Target vs Actual (%)
-
PY vs Actual (%)
-
Conditional formatting (▲ ▼ arrows)
✅ YTD (Year-to-Date):
-
Actual
-
Target
-
Previous Year
-
Target vs Actual (%)
-
PY vs Actual (%)
-
Conditional formatting
🎯 Why It Matters:
Because this sheet gives a complete snapshot, you can instantly evaluate sprint performance.
Click to Buy Agile Sprint KPI Dashboard in Google Sheets
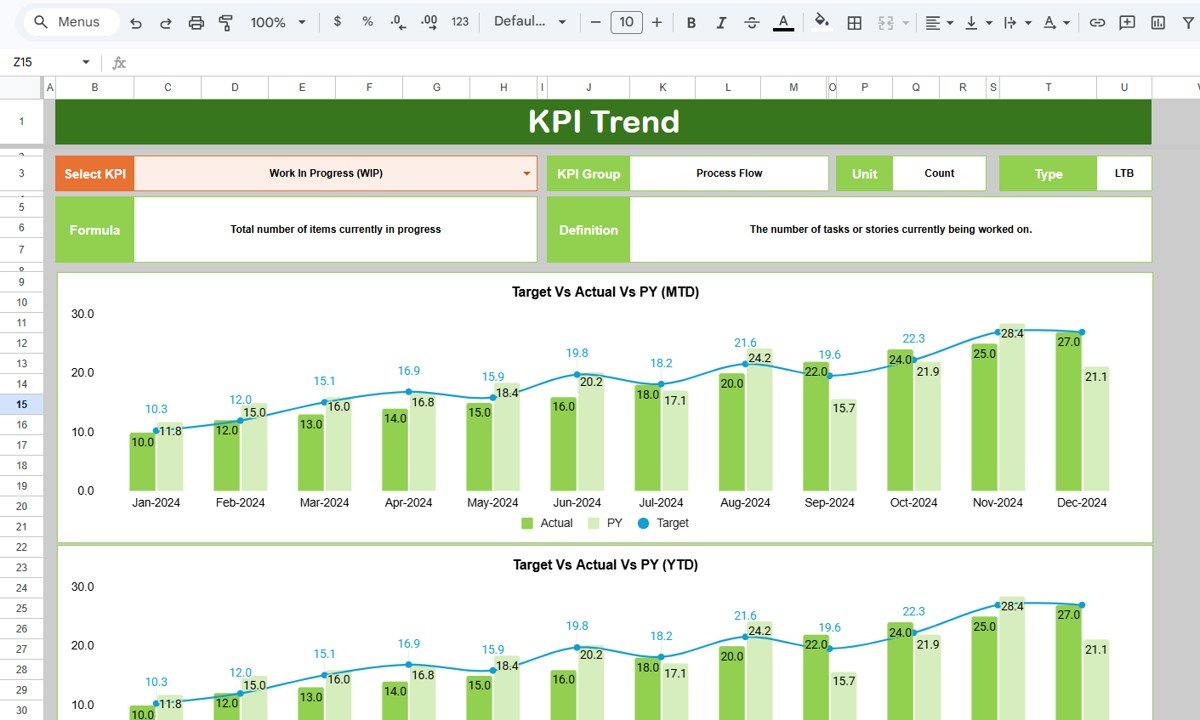
📈 2. KPI Trend Sheet – Analyze KPI Behavior
This sheet helps you analyze trends for individual KPIs.
🎛️ Key Feature:
-
KPI selection dropdown (Cell C3)
📊 Information Displayed:
-
KPI Group
-
KPI Unit
-
KPI Type (LTB or UTB)
-
KPI Formula
-
KPI Definition
🔍 Insights:
-
Performance trends over time
-
KPI behavior analysis
-
Improvement opportunities
🚀 Why It Matters:
Because trends reveal patterns, this sheet helps teams improve sprint planning.
Click to Buy Agile Sprint KPI Dashboard in Google Sheets
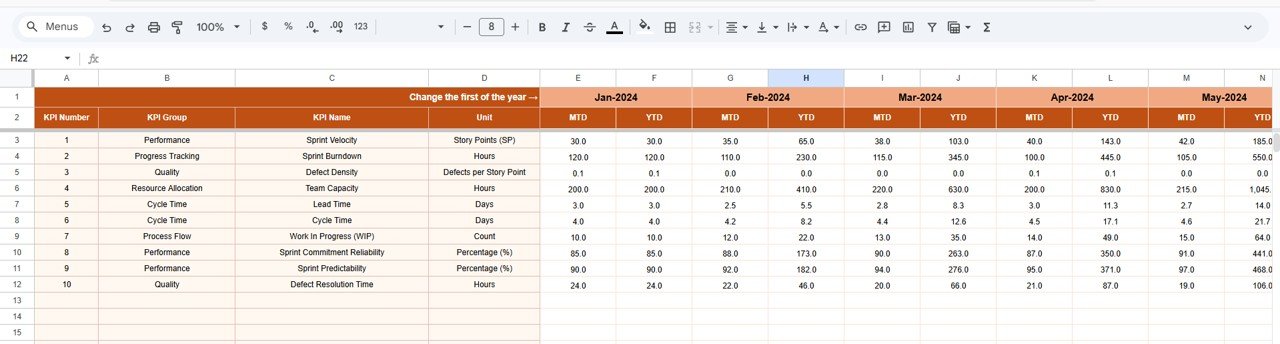
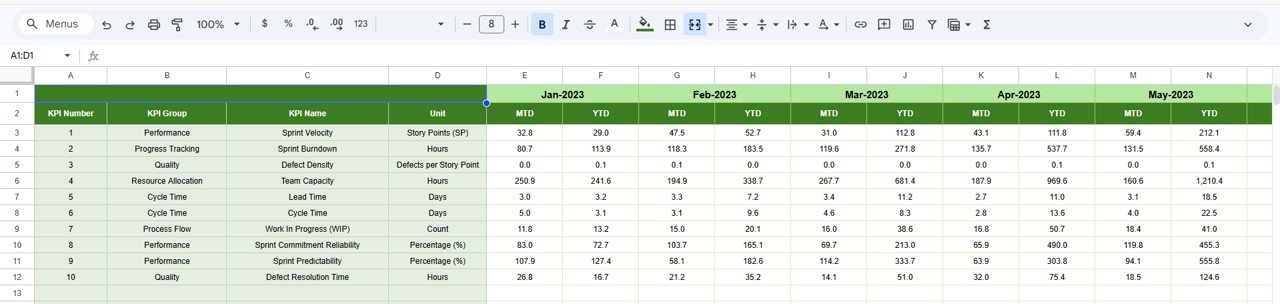
📊 3. Actual Number Sheet – Input Current Data
This sheet captures actual KPI values.
✏️ Data Entry Includes:
-
MTD values
-
YTD values
-
Month selection (Cell E1)
📌 Important Note:
You must enter the first month of the year in Cell E1 to ensure proper calculations.
Click to Buy Agile Sprint KPI Dashboard in Google Sheets
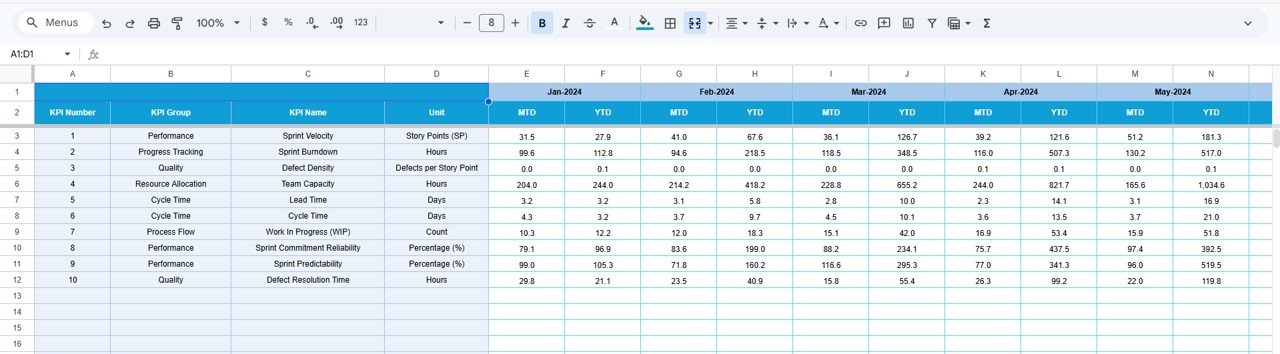
🎯 4. Target Sheet – Define KPI Goals
This sheet stores target values.
📊 Data Includes:
-
Monthly targets
-
MTD and YTD targets
🎯 Why It Matters:
Because targets define success, this sheet helps measure performance accurately.
Click to Buy Agile Sprint KPI Dashboard in Google Sheets
📉 5. Previous Year Sheet – Historical Comparison
This sheet stores past data for comparison.
📊 Data Includes:
-
Previous year MTD values
-
Previous year YTD values
🔍 Why It Matters:
Because comparison drives insights, this sheet helps analyze growth trends.
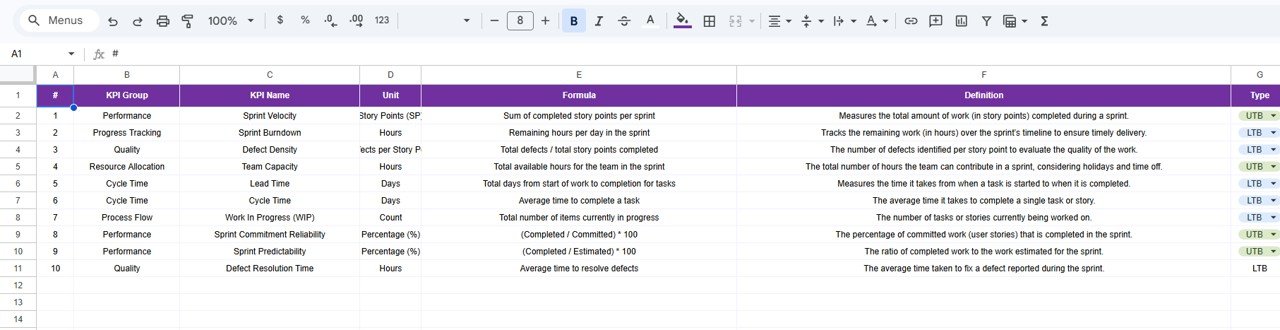
📘 6. KPI Definition Sheet – Define Metrics Clearly
This sheet defines each KPI.
📊 Data Includes:
-
KPI Name
-
KPI Group
-
Unit
-
Formula
-
Definition
-
KPI Type (LTB or UTB)
🎯 Why It Matters:
Because clarity is essential, this sheet ensures everyone understands KPIs.
Click to Buy Agile Sprint KPI Dashboard in Google Sheets
Advantages of Agile Sprint KPI Dashboard in Google Sheets
Using this dashboard provides multiple benefits.
🚀 Key Advantages:
-
📊 Centralized KPI Tracking
Track all sprint metrics in one place. -
⚡ Real-Time Updates
Get instant insights after data entry. -
📈 Better Performance Tracking
Compare actual vs target easily. -
🧠 Improved Decision-Making
Use data-driven insights. -
🔄 Easy Customization
Modify KPIs based on your needs. -
💡 Cost-Effective Solution
Use Google Sheets without extra tools.
Opportunities for Improvement
Click to Buy Agile Sprint KPI Dashboard in Google Sheets
You can enhance this dashboard further.
💡 Suggested Improvements:
-
Add automation using Google Apps Script
-
Integrate Jira or project tools
-
Include burndown charts
-
Add team-wise analysis
-
Enable real-time API integration
Best Practices for the Agile Sprint KPI Dashboard
Follow these best practices for maximum efficiency.
✅ Best Practices:
-
📊 Keep Data Clean and Consistent
Avoid incorrect inputs. -
🔄 Update Data Regularly
Ensure accurate insights. -
🎯 Focus on Key KPIs Only
Avoid clutter. -
📌 Use Simple Visuals
Improve readability. -
⚡ Optimize Formulas
Avoid heavy calculations. -
🔍 Review KPIs Regularly
Ensure relevance. -
🎨 Maintain Design Consistency
Use uniform formatting.
Conclusion
Click to Buy Agile Sprint KPI Dashboard in Google Sheets
The Agile Sprint KPI Dashboard in Google Sheets is a powerful tool for tracking Agile performance. It simplifies complex data and provides clear insights.
Moreover, it helps teams monitor KPIs, improve productivity, and make better decisions. As a result, Agile teams can deliver high-quality results consistently.
If you want to improve sprint performance, this dashboard is an essential solution.
Visit our YouTube channel to learn step-by-step video tutorials