E-commerce Dashboard in HTML is a modern, browser-based analytics tool that helps online store owners, sales teams, and business analysts track every aspect of their e-commerce performance from a single interactive interface. In today’s competitive online marketplace, relying on scattered spreadsheets and static reports slows down decision-making. This dashboard solves that problem by presenting sales data, product performance, customer behavior, shipping logistics, and time-based trends in one beautiful, easy-to-navigate HTML file.
Whether you run a small online shop or manage a multi-channel retail operation, this HTML dashboard gives you instant access to the KPIs that matter most. Just open the file in any modern browser, explore the pre-loaded demo data, and when you’re ready, upload your own Excel file to see your real business data come alive.
Click here to Purchase E-commerce Dashboard in HTML
Key Features of the E-commerce Dashboard in HTML
This dashboard packs a powerful set of features into a single HTML file. Here is what makes it stand out from typical reporting tools:
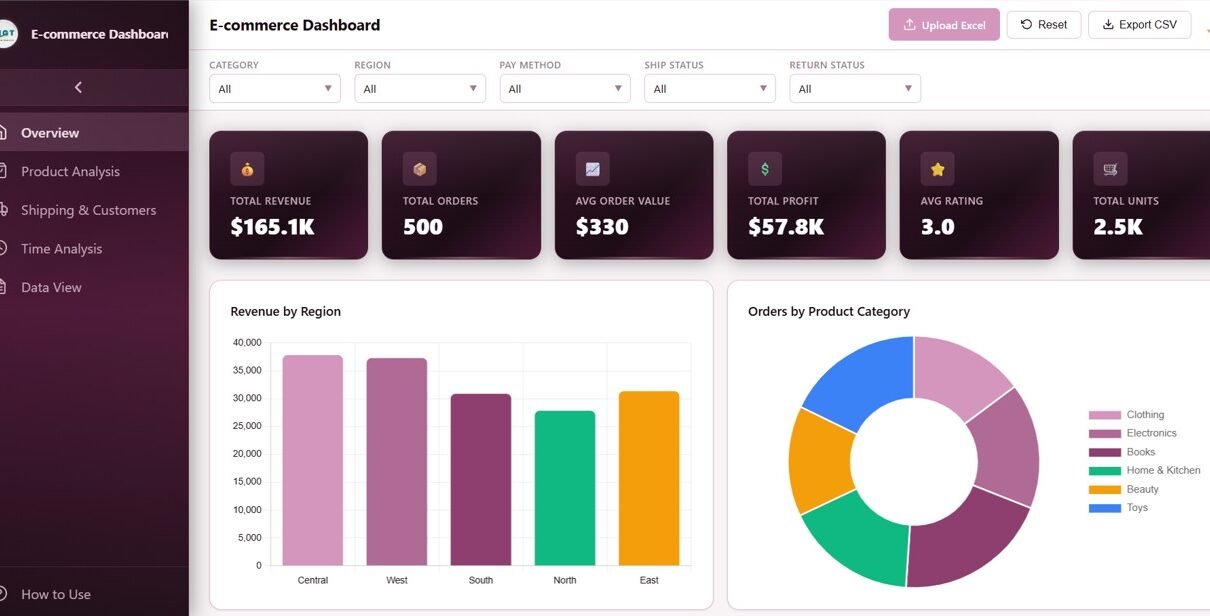
- Multi-Page Analytics – The dashboard is organized into five distinct analysis pages: Overview, Product Analysis, Shipping & Customers, Time Analysis, and Data View. Each page focuses on a specific area of your e-commerce operations, keeping the interface clean and easy to navigate.
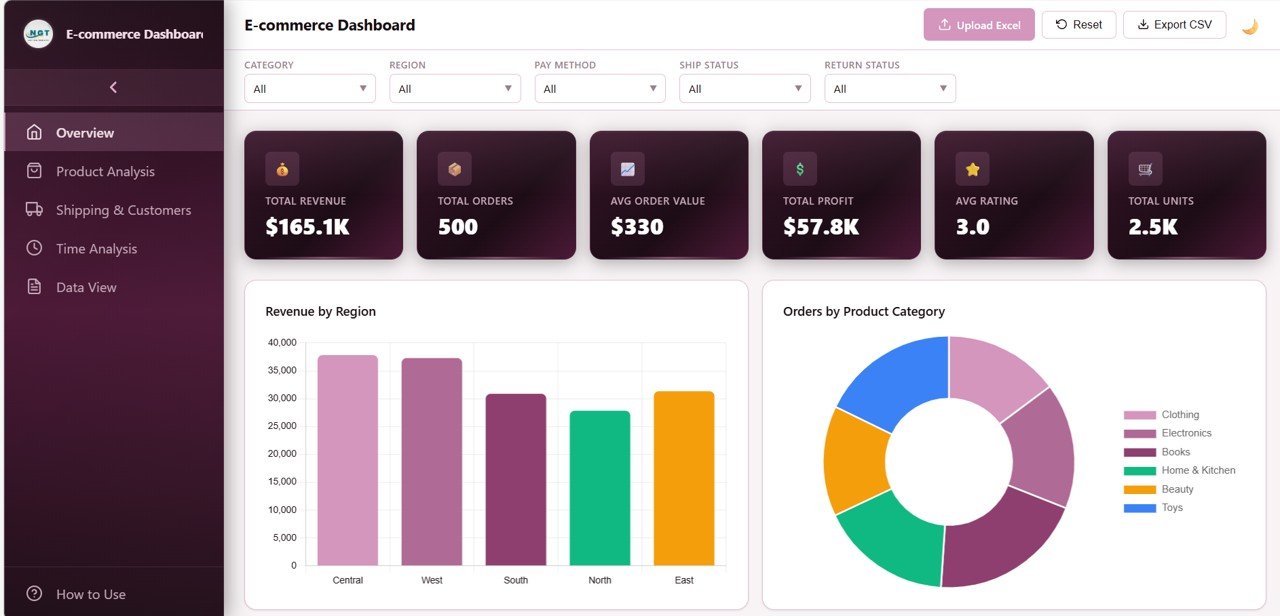
- Dynamic KPI Cards – The overview page displays headline metrics at a glance, including Total Revenue, Total Orders, Average Order Value, Total Profit, Average Rating, and Total Units. These KPI cards update dynamically when filters are applied.
- Interactive Chart Visualizations – Explore bar charts, line trends, donut charts, and grouped comparisons that respond to filter changes in real time. Every chart is designed to highlight patterns, trends, and outliers in your data.
- Global Slicers & Filters – Apply multiple slicers to filter the entire dashboard and see filtered results quickly. This makes it easy to drill down into specific segments of your business.
- Excel File Upload – The dashboard comes with realistic demo data, but you can replace it instantly by uploading your own .xlsx or .xls file. The upload modal supports sheet selection and drag-and-drop functionality.
- CSV Export – Export filtered transaction-level data from the Data View page for further analysis in Excel or other tools.
- Light and Dark Theme – Toggle between light and dark modes for comfortable viewing. Your theme preference is saved automatically.
- Responsive Design – The dashboard adapts to desktops, tablets, and mobile devices. The sidebar auto-collapses on smaller screens for better usability.
- Built-in How to Use Guide – A dedicated help page explains the data format, upload process, navigation, filters, export options, and more.
Dashboard Pages Explanation
1 – Overview Page
The Overview page serves as the executive summary of your e-commerce performance. At the top, you will find KPI cards displaying Total Revenue, Total Orders, Average Order Value, Total Profit, Average Rating, and Total Units. We have also created multiple slicers to apply filters and see the filtered dashboard quickly. Below the cards, interactive charts provide visual breakdowns including:
- Revenue by Region – Understand which geographic areas contribute the most to your total revenue and identify untapped markets for growth.
- Orders by Product Category – See which product categories generate the highest order volumes and allocate marketing resources accordingly.
- Revenue by Payment Method – Discover which payment options are most popular among your customers and optimize checkout experiences.
- Shipping Status Distribution – Get a quick view of how many orders are delivered, pending, in transit, or returned at any given time.
- Monthly Revenue Trend – Track how your revenue evolves month over month to spot seasonal patterns and growth trajectories.
Click here to Purchase E-commerce Dashboard in HTML
2 – Product Analysis Page
The Product Analysis page dives deep into how individual products and product categories perform across your store. This page helps you understand which products drive the most revenue and which categories maintain the best margins. The charts on this page include:
- Revenue by Product Name – Identify your highest-earning individual products and focus promotional efforts on proven bestsellers.
- Profit Margin by Product Category – Compare profitability across different categories to prioritize high-margin product lines in your strategy.
- Average Rating by Product Category – See how customer satisfaction varies across categories and pinpoint areas needing quality improvements.
- Units Ordered by Product Category – Understand volume trends across categories to optimize inventory planning and restocking decisions.
- Top 10 Products by Revenue – Quickly spot your top performers and ensure they remain well-stocked and prominently featured.

3 – Shipping and Customers Page
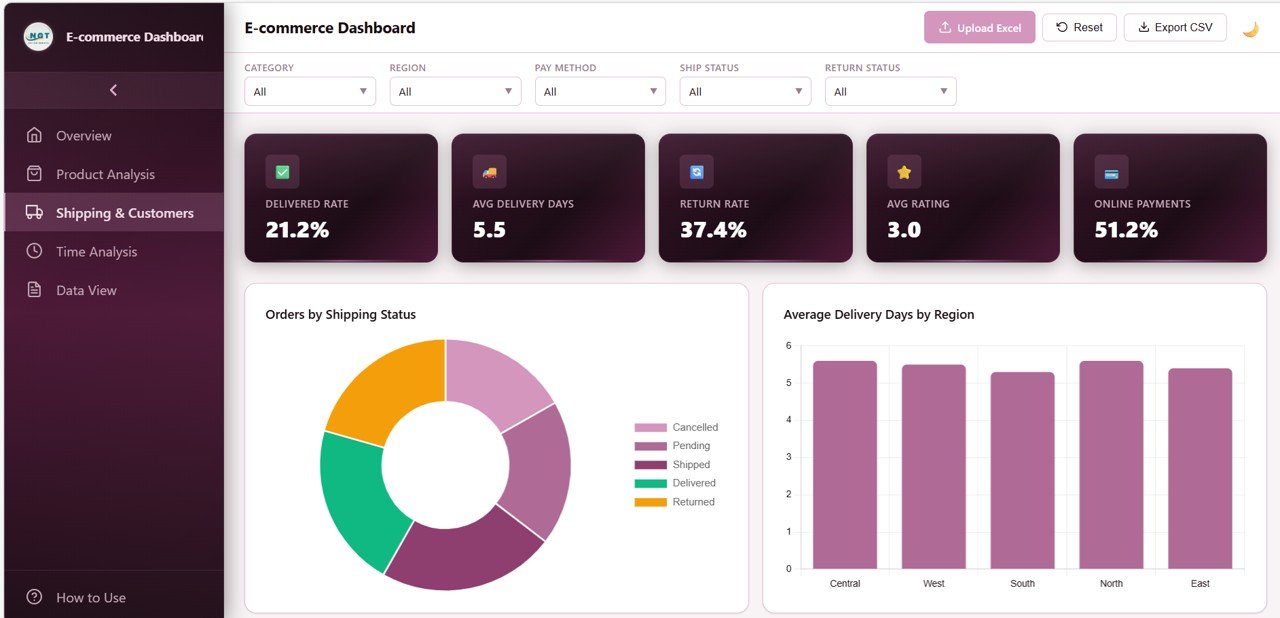
The Shipping and Customers page combines logistics insights with customer behavior analysis. This is a critical page for operations teams and customer experience managers who need to monitor delivery performance and understand how customers interact with the store. The charts include:
- Orders by Shipping Status – Monitor the distribution of orders across different shipping stages to identify fulfillment bottlenecks.
- Average Delivery Days by Region – Compare delivery speed across geographic areas and negotiate better terms with logistics partners in slower regions.
- Return Status Distribution – Analyze the proportion of returned versus non-returned orders to detect product quality or description issues.
- Orders by Customer Rating – See how customer satisfaction scores are distributed across your order base and identify trends in buyer happiness.
- Payment Type Distribution – Understand the split between different payment types to optimize your checkout flow and payment gateway offerings.
Click here to Purchase E-commerce Dashboard in HTML
4 – Time Analysis Page
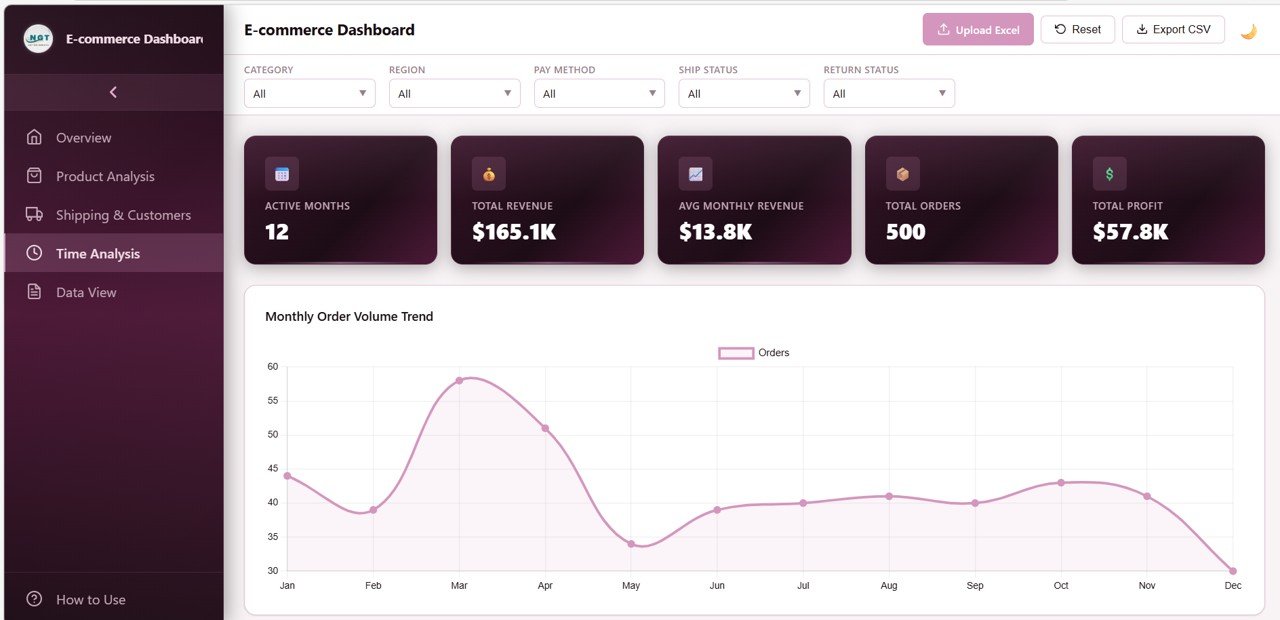
The Time Analysis page reveals how your e-commerce metrics evolve over time. This is one of the most valuable pages for strategic planning, as it helps you identify seasonal patterns, growth trends, and performance fluctuations. The charts include:
- Monthly Order Volume Trend – Track how the number of orders changes month over month to plan marketing campaigns around peak periods.
- Average Order Value by Month – Monitor whether customers are spending more or less per order over time and adjust pricing or bundling strategies.
- Profit Margin by Month – Understand how profitability fluctuates throughout the year and identify months where costs need tighter control.
- Revenue by Region and Month – See how different regions perform across time to align regional marketing and inventory decisions with seasonal demand.
- Average Delivery Days by Month – Detect whether shipping performance improves or deteriorates over time and hold logistics partners accountable.
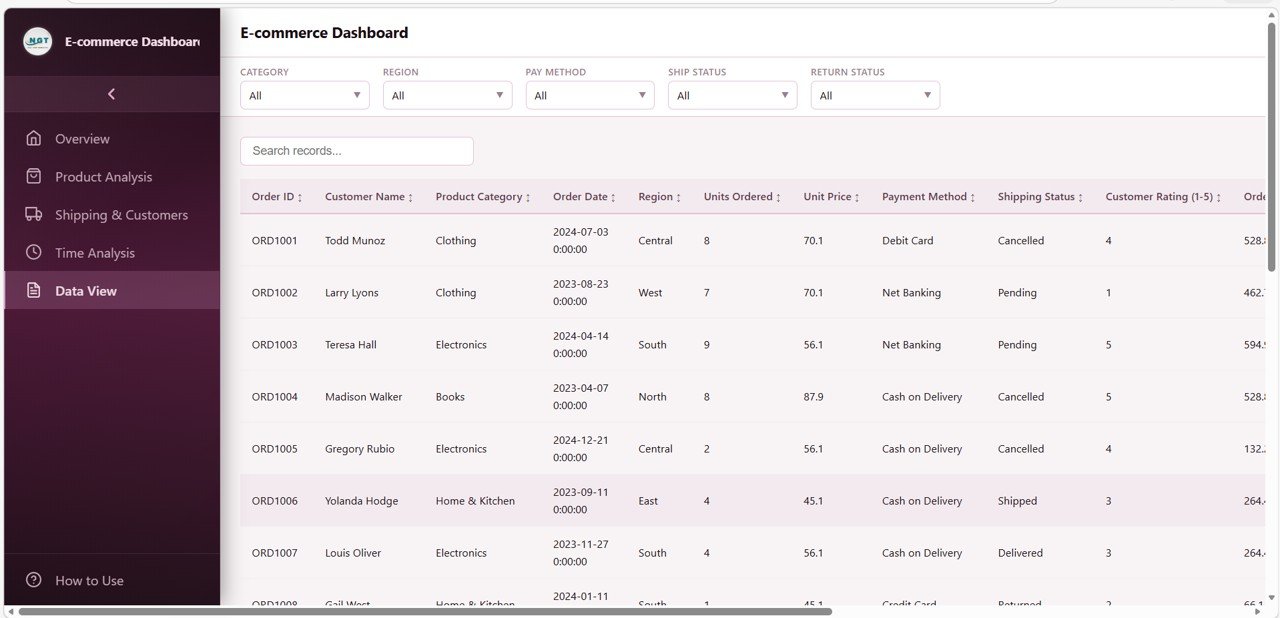
5 – Data View Page
The Data View page is the detailed data table section of the dashboard. Here you can see all the records with search, sort, and pagination features. You can also export the filtered data to CSV for offline analysis, further reporting, or sharing with team members. This page is essential for transaction-level validation and operational auditing.
Click here to Purchase E-commerce Dashboard in HTML
Advantages of the E-commerce Dashboard in HTML
- No Software Required – The dashboard runs entirely in a web browser. There is no need to install Power BI, Tableau, or any other software.
- Instant Setup – Download the file, open it, and start analyzing. The pre-loaded demo data lets you explore all features immediately.
- Complete Data Privacy – All data processing happens locally in the browser. No data is uploaded to any server, ensuring complete confidentiality.
- Professional SaaS-like Interface – The sidebar navigation, card-based KPIs, interactive charts, and theme toggle create a premium user experience.
- Flexible Data Input – Upload your own Excel file with your e-commerce data and the dashboard adapts automatically.
- Cross-device Access – Works on desktop, tablet, and mobile with fully responsive layout.
Opportunities for Improvement
- Customer Segmentation – Adding a dedicated customer analysis page with repeat purchase rates, customer lifetime value, and acquisition channel breakdown could further enhance the dashboard.
- Inventory Integration – Connecting stock levels with sales data would enable inventory optimization directly from the dashboard.
- Year-over-Year Comparisons – Adding comparison charts that show current year performance against previous year would strengthen time-based analysis.
- Saved Filter Views – Allowing users to save frequently used filter combinations would improve workflow for regular reporting.
- Email Report Scheduling – Automated report generation based on dashboard views could add enterprise-level value.
Click here to Purchase E-commerce Dashboard in HTML
Best Practices
- Keep Your Data Clean – Ensure consistent column headers and standard date formats in your Excel file for smooth data loading.
- Review KPIs Weekly – Make it a habit to check the overview page at least once a week to catch trends early.
- Use Filters Strategically – Focus on specific product categories or regions to uncover hidden patterns in your data.
- Monitor Shipping Closely – Delivery performance has a direct impact on customer satisfaction and repeat purchases.
- Export Data for Deep Analysis – Use the CSV export feature to perform advanced analysis in Excel or share filtered reports with team members.
- Switch Themes for Presentations – Use dark mode for internal analysis and light mode for client-facing presentations.
Explore Relevant Templates
If you find this E-commerce Dashboard in HTML useful, you might also be interested in these related templates from NextGenTemplates.com:
- E-commerce Dashboard in Power BI – A similar e-commerce analytics dashboard built for Power BI with interactive slicers and drill-down capabilities.
- Retail Dashboard in HTML – Track retail sales, store performance, and category trends in an interactive HTML dashboard.
- Supply Chain Analytics Dashboard in HTML – Monitor supplier performance, logistics, and fulfillment metrics.
- Inventory Management Dashboard in HTML – Manage stock levels, reorder points, and warehouse performance visually.
Frequently Asked Questions
What is an E-commerce Dashboard in HTML?
An E-commerce Dashboard in HTML is a browser-based analytics tool that visualizes online store data including sales, product performance, customer ratings, shipping logistics, and time-based trends through interactive charts and KPI cards. It requires no software installation and runs entirely in a web browser.
Can I upload my own data into this dashboard?
Yes. The dashboard includes an Excel upload feature that supports .xlsx and .xls files. You can replace the demo data with your own e-commerce dataset and the dashboard will automatically update all charts and KPIs.
Do I need any coding skills to use this dashboard?
No. The dashboard is completely ready to use out of the box. Simply download the HTML file, open it in a browser, and start exploring. A built-in How to Use guide explains everything step by step.
Is my data safe when using this HTML dashboard?
All data processing happens locally in your browser. No data is sent to any external server, making this one of the most privacy-friendly dashboard solutions available.
Does this dashboard work on mobile devices?
Yes. The dashboard features fully responsive design that adapts to desktops, tablets, and mobile phones. The sidebar navigation auto-collapses on smaller screens for optimal usability.
What are the five pages in this dashboard?
The dashboard includes five main pages: Overview (KPI cards and high-level charts), Product Analysis (revenue and margins by product), Shipping & Customers (logistics and customer behavior), Time Analysis (monthly trends), and Data View (searchable transaction table with CSV export).
Conclusion
The E-commerce Dashboard in HTML is a game-changing tool for anyone who manages or analyzes online store performance. With its five dedicated analysis pages, interactive charts, dynamic KPI cards, global slicers, Excel upload support, and privacy-first approach, this dashboard delivers enterprise-level analytics in a single, lightweight HTML file.
Whether you are an e-commerce store owner looking for quick daily insights, a business analyst performing deep product profitability analysis, or a consultant building reports for clients, this dashboard adapts to your workflow. The combination of professional design, powerful features, and zero software requirements makes it one of the best e-commerce analytics solutions available today.
Click here to Purchase E-commerce Dashboard in HTML
Visit our YouTube channel to learn step-by-step video tutorials
Youtube.com/@NeoTechNavigators