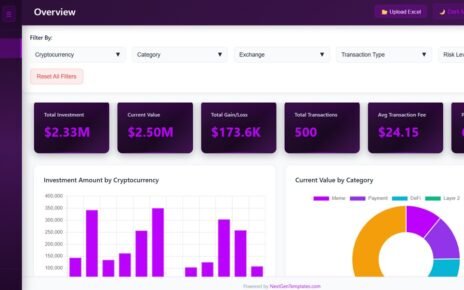
SaaS Metrics Dashboard in HTML is a professional, browser-based analytics template built for SaaS founders, product managers, revenue operations teams, and customer success leaders who want to monitor subscription revenue, customer health, and churn risk from a single interactive interface. This HTML Dashboard transforms raw SaaS data into actionable visual insights without requiring any software installation. Simply open the HTML file in Chrome, Firefox, or Edge and start exploring your SaaS metrics instantly.
This template includes 5 interactive dashboard pages covering Overview, Revenue Analysis, Customer Health, Churn Analysis, and a detailed Data View — making it one of the most comprehensive SaaS analytics solutions available. Whether you are tracking MRR growth, monitoring NPS scores, analyzing churn risk, or evaluating expansion revenue, this dashboard gives you complete visibility into your SaaS business operations with dynamic charts, KPI cards, and smart filtering options.
 SaaS Metrics Dashboard in HTML – Overview Page
Click here to Purchase SaaS Metrics Dashboard in HTML
Key Features of SaaS Metrics Dashboard in HTML
The SaaS Metrics Dashboard in HTML is packed with powerful features that make it the ideal tool for subscription business analytics. Here is what makes this template stand out:
- 5 Interactive Dashboard Pages — Navigate between Overview, Revenue Analysis, Customer Health, Churn Analysis, and Data View tabs to explore SaaS data from every angle.
- 6 Dynamic KPI Cards — Track high-level metrics at a glance including Total MRR, Total ARR, Avg NPS Score, Total Seats, Avg CSAT, and Total Accounts.
- Advanced Slicers and Filters — Filter the entire dashboard instantly by industry, region, plan type, billing cycle, account manager, and more for targeted SaaS analysis.
- Revenue Deep-Dive Analytics — Analyze MRR by Plan Type, ARR by Account Manager, Expansion Revenue by Industry, MRR by Billing Cycle, and Avg Seat Price by Plan Type.
- Customer Health Scoring — Monitor NPS Score by Region, CSAT Score by Plan Type, Support Tickets by Industry, Feature Adoption by Industry, and NPS vs CSAT comparisons.
- Churn Risk Identification — Spot at-risk accounts with Churn Risk Distribution, Renewal Status by Industry, At-Risk Accounts by Region, and Churned Accounts by Industry.
- Data View with CSV Export — Browse all records with search, sort, and pagination features plus one-click CSV export for offline analysis.
- Zero Installation Required — Works instantly in any modern browser without plugins, extensions, or desktop software installation.
Dashboard Pages Explanation
The SaaS Metrics Dashboard in HTML contains 5 fully interactive pages that provide comprehensive coverage of subscription business analytics. Let us walk through each page in detail.
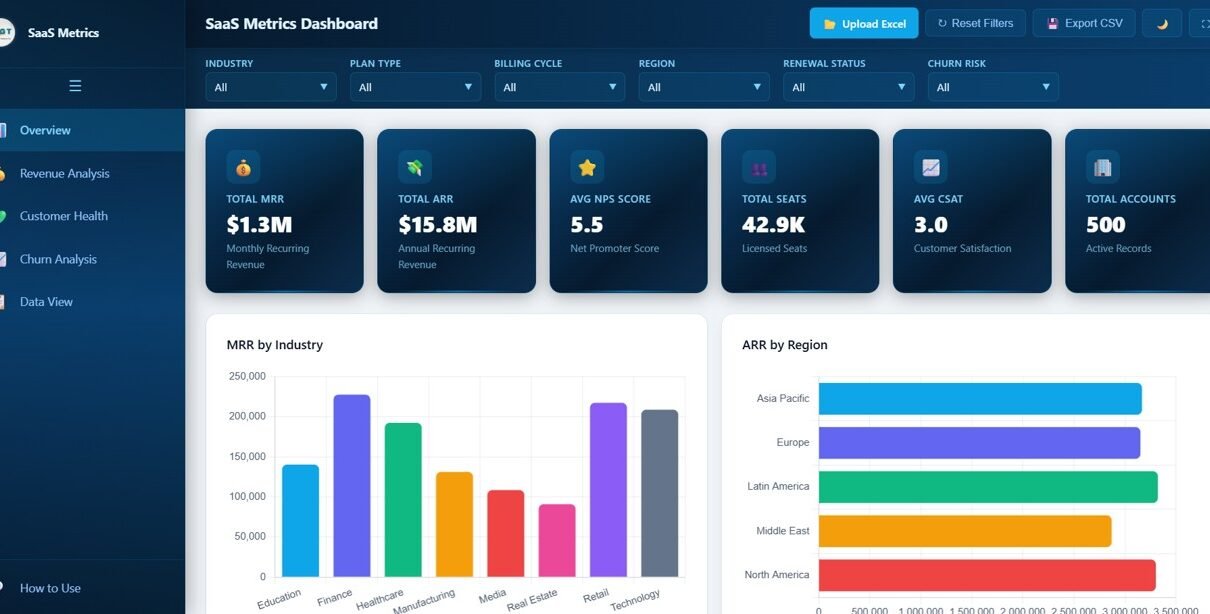
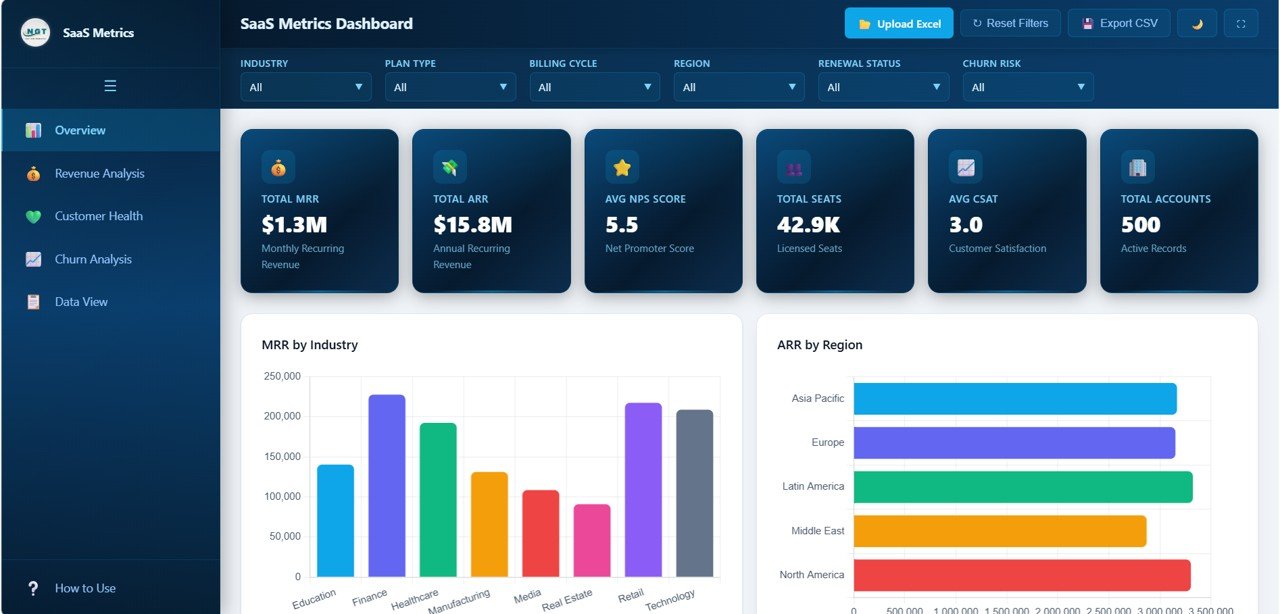
1. Overview Page
The Overview page is the main landing page of the SaaS Metrics Dashboard in HTML. At the top, you will find 6 high-level KPI cards that instantly display the most critical SaaS metrics — Total MRR, Total ARR, Avg NPS Score, Total Seats, Avg CSAT, and Total Accounts. These cards give you a quick snapshot of your subscription business health at a glance.
Below the KPI cards, the dashboard presents several interactive charts for deeper analysis. The MRR by Industry chart shows how your monthly recurring revenue is distributed across different industry verticals. The ARR by Region chart breaks down annual recurring revenue by geographical regions. The Accounts by Plan Type chart visualizes the distribution of customer accounts across your pricing plans. The Renewal Status Distribution chart helps you understand where your accounts stand in terms of renewal likelihood. Finally, the Monthly MRR Trend chart tracks the growth trajectory of your monthly recurring revenue over time. Multiple slicers allow you to filter the entire dashboard for quick, focused analysis.
SaaS Metrics Dashboard Overview2. Revenue Analysis
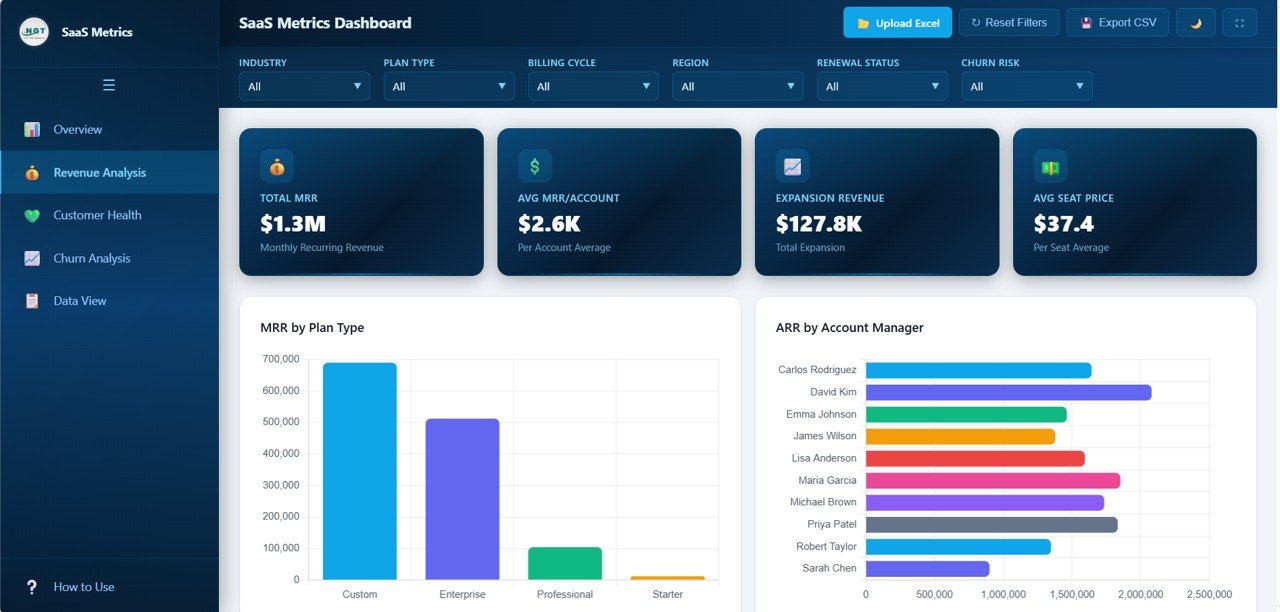
The Revenue Analysis page dives deep into your revenue streams to help you understand where your money is coming from and how to maximize it. This page features 5 analytical charts that break down revenue from multiple perspectives.
The MRR by Plan Type chart reveals which subscription plans contribute the most to your monthly recurring revenue. The ARR by Account Manager chart helps you evaluate the revenue performance of individual account managers. The Expansion Revenue by Industry chart shows which industries are generating the most upsell and cross-sell revenue. The MRR by Billing Cycle chart compares revenue from monthly, quarterly, and annual billing cycles. The Avg Seat Price by Plan Type chart helps you understand pricing efficiency across different plans. Together, these charts provide a complete picture of your revenue dynamics.
 Revenue Analysis
3. Customer Health
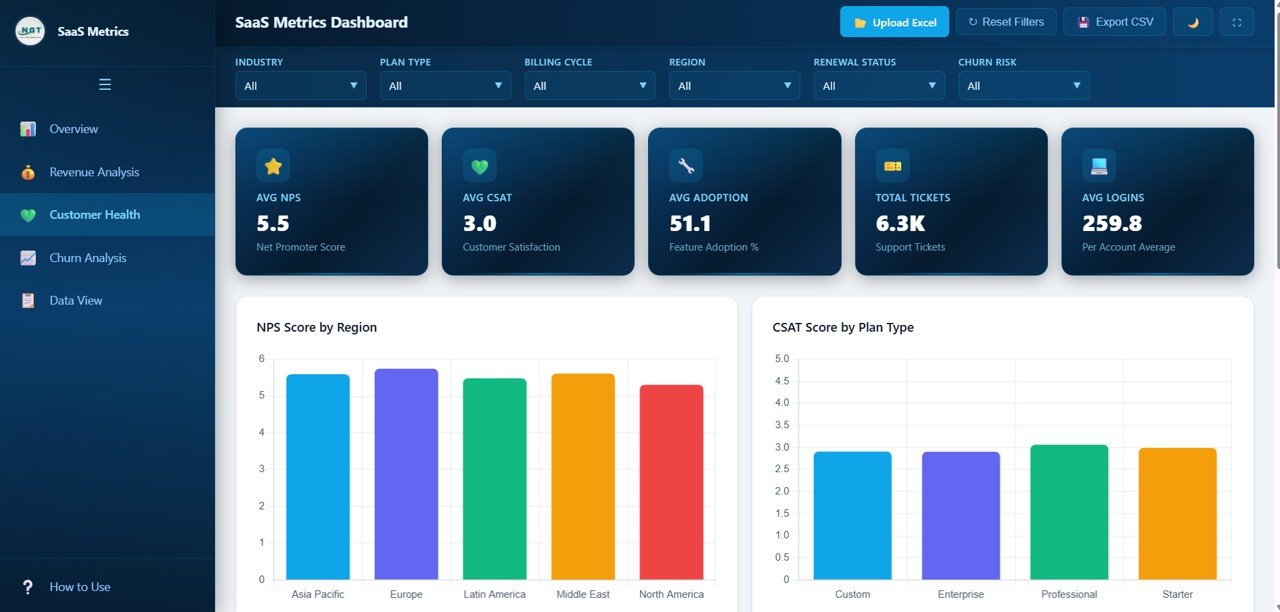
The Customer Health page is your command center for monitoring customer satisfaction and engagement. Understanding customer health is critical for reducing churn and increasing lifetime value in any SaaS business.
This page presents NPS Score by Region to identify geographical areas where customer sentiment is strongest or weakest. The CSAT Score by Plan Type chart reveals satisfaction levels across different subscription tiers. Support Tickets by Industry helps you understand which verticals require the most support attention. Feature Adoption by Industry shows how well customers in different sectors are utilizing your product features. The NPS vs CSAT by Plan Type comparison chart helps you correlate net promoter scores with customer satisfaction across plans, giving you actionable insights for improving customer experience.
 Customer Health
4. Churn Analysis
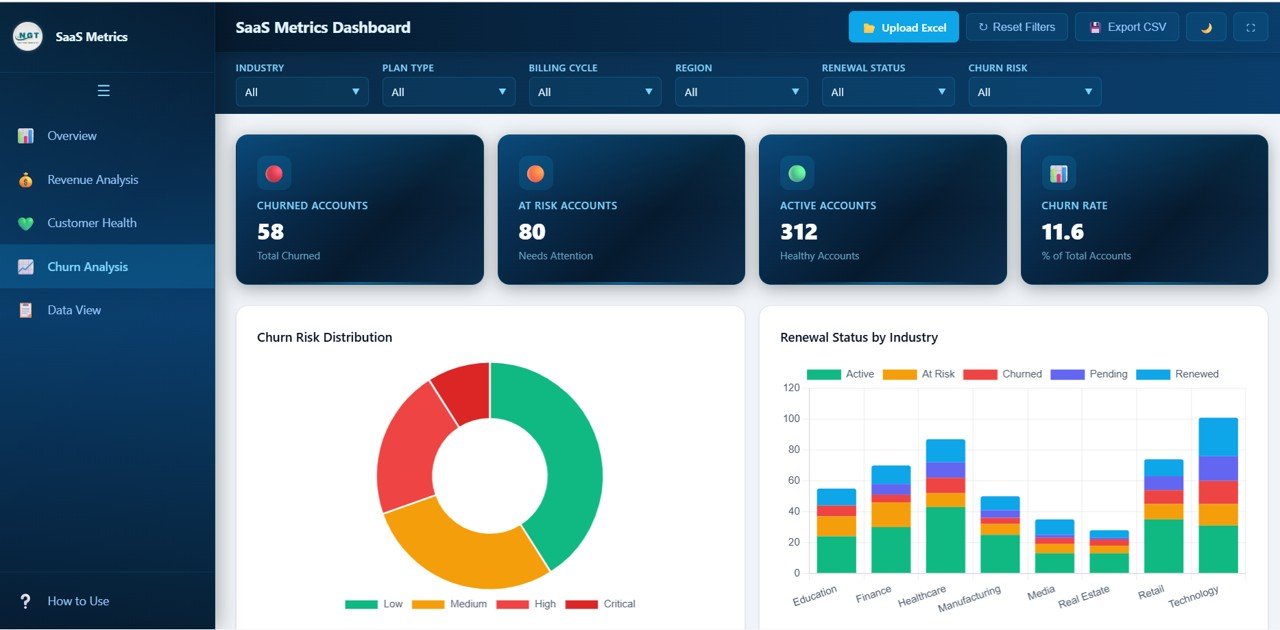
The Churn Analysis page is essential for protecting your revenue and proactively identifying customers who may be at risk of leaving. Churn is one of the most critical metrics for any subscription business, and this page gives you all the intelligence you need to address it.
The Churn Risk Distribution chart provides an overview of how your accounts are distributed across different risk levels. Renewal Status by Industry shows which industry verticals have the healthiest renewal pipelines. At-Risk Accounts by Region identifies geographical areas where customer retention may be declining. Churned Accounts by Industry reveals which sectors have experienced the most customer losses. The Churn Risk by Plan Type chart helps you determine if certain pricing plans are more prone to customer attrition than others. These insights enable you to take proactive steps to retain customers and reduce churn before it impacts your bottom line.
 Churn Analysis
5. Data View
The Data View page is a detailed data table that displays all the records powering the dashboard. This page is designed for users who want to explore the raw data behind the visualizations. It includes search functionality to quickly find specific accounts, sortable columns to organize data by any field, and pagination for easy navigation through large datasets. You can also export the filtered data to CSV with a single click, making it easy to share data with colleagues or perform further analysis in Excel or Google Sheets.
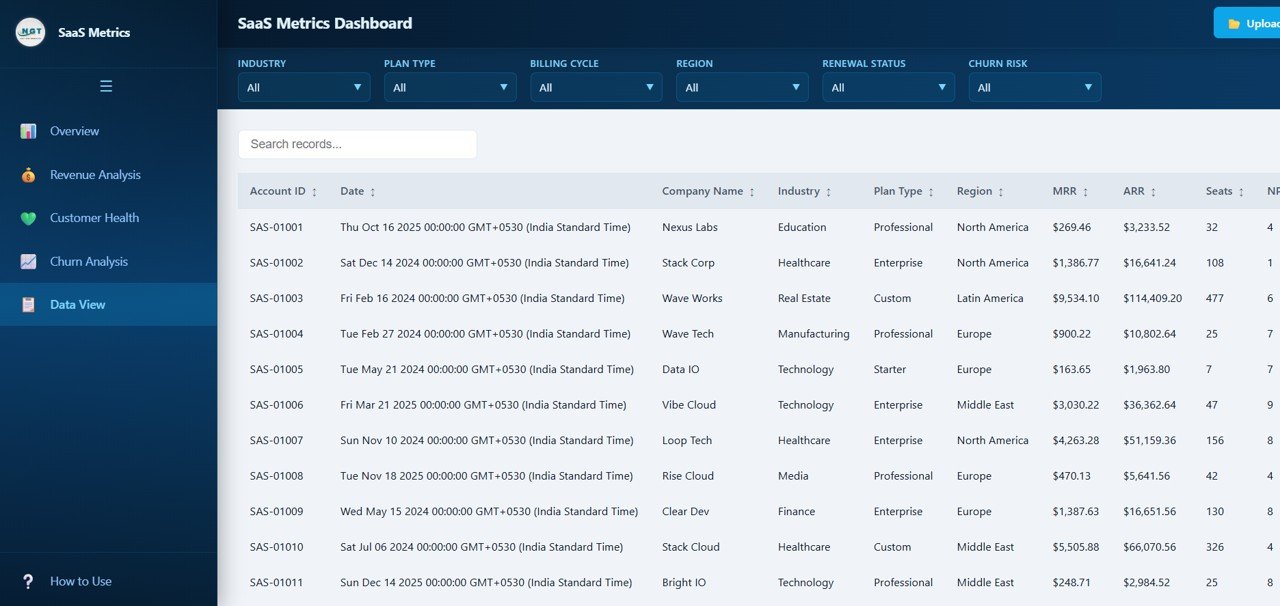 Data View
Advantages of SaaS Metrics Dashboard in HTML
The SaaS Metrics Dashboard in HTML offers several compelling advantages over traditional reporting methods and other dashboard tools:
- No Software Required — Unlike Excel or Power BI dashboards, this HTML template runs directly in your browser with zero installation. No licenses, no plugins, no compatibility issues.
- Instant Deployment — Download, unzip, and open. You can be reviewing your SaaS metrics within minutes of purchase.
- Platform Independent — Works on Windows, Mac, Linux, and even tablets. Any device with a modern browser can display this dashboard perfectly.
- Comprehensive SaaS Coverage — With 5 dedicated pages covering revenue, customer health, churn, and raw data, you get a 360-degree view of your subscription business.
- Interactive Filtering — Smart slicers let you drill down into specific segments without modifying any data, making ad-hoc analysis fast and effortless.
- Professional Design — The modern dark-theme interface with responsive charts looks stunning in presentations, board meetings, and investor updates.
- Data Privacy — Since the dashboard runs locally in your browser, your sensitive business data never leaves your machine. No cloud uploads or third-party data sharing required.
Opportunities for Improvement
While the SaaS Metrics Dashboard in HTML is a powerful analytics tool, there are a few areas where users might want to extend its capabilities:
- Real-Time Data Integration — Currently the dashboard works with static data files. Connecting it to a live database or API would enable real-time metric updates.
- Cohort Analysis — Adding cohort-based retention analysis would provide deeper insights into customer lifecycle patterns over time.
- Revenue Forecasting — Incorporating predictive models or trend projections for MRR and ARR could help with financial planning and budgeting.
- Custom Date Range Filters — Adding date-based filtering across all pages would allow users to analyze metrics for specific time periods more easily.
- Benchmark Comparisons — Including industry benchmark data alongside your own metrics would help contextualize performance against market standards.
Best Practices for Using This Dashboard
To get the maximum value from your SaaS Metrics Dashboard in HTML, follow these recommended best practices:
- Update Data Regularly — Refresh your data file weekly or monthly to keep the dashboard current. Stale data leads to poor decision-making.
- Start with the Overview — Always begin your analysis on the Overview page to spot high-level trends before drilling into specific pages.
- Use Filters Strategically — Apply slicers to compare performance across regions, industries, or plan types. This is where the most actionable insights emerge.
- Monitor Churn Proactively — Check the Churn Analysis page at least weekly. Early identification of at-risk accounts can save significant revenue.
- Cross-Reference Customer Health with Revenue — Low NPS or CSAT scores often precede churn. Use the Customer Health page alongside Revenue Analysis to spot warning signs.
- Export and Share Insights — Use the Data View CSV export to share filtered datasets with team members who prefer working in spreadsheets.
- Customize for Your Business — Replace the sample data with your own SaaS metrics to transform this template into a personalized business intelligence tool.
Explore Relevant Templates
If you found the SaaS Metrics Dashboard in HTML useful, you may also be interested in these related templates from NextGenTemplates:
- SaaS Metrics Dashboard in Excel — Prefer working in Microsoft Excel? This Excel version offers pivot-based SaaS analytics with the same comprehensive coverage of MRR, ARR, and churn metrics.
- Customer Relationship Management (CRM) Dashboard in HTML — Track customer interactions, sales pipeline, and relationship metrics with this browser-based CRM analytics template.
- IT Support Ticket Dashboard in HTML — Monitor support ticket volume, resolution times, and technician performance with this interactive IT dashboard.
- E-commerce Dashboard in HTML — Analyze sales performance, customer behavior, and product analytics with this browser-based e-commerce template.
- SaaS Renewal KPI Dashboard in Power BI — A Power BI alternative for tracking SaaS renewal rates, retention, and subscription lifecycle analytics.
Browse all HTML Dashboard Templates for more interactive analytics solutions.
Frequently Asked Questions
What KPIs does the SaaS Metrics Dashboard in HTML track?
The SaaS Metrics Dashboard in HTML tracks 6 key performance indicators including Total MRR, Total ARR, Avg NPS Score, Total Seats, Avg CSAT, and Total Accounts. It also includes 20+ analytical charts across revenue analysis, customer health, and churn analysis pages covering metrics like MRR by Plan Type, Expansion Revenue by Industry, NPS by Region, and Churn Risk Distribution.
Do I need any software to use this HTML dashboard?
No. The SaaS Metrics Dashboard in HTML requires zero software installation. Simply unzip the downloaded file and open index.html in any modern web browser like Chrome, Firefox, or Edge. It works on Windows, Mac, and Linux without any plugins or extensions.
What is the best dashboard template for tracking SaaS subscription metrics?
The SaaS Metrics Dashboard in HTML from NextGenTemplates is the best choice for tracking subscription revenue, customer health, and churn risk in a browser-based format. It includes 5 interactive pages with 6 KPI cards, 20+ charts, smart filters, and CSV export — all running locally without cloud dependencies. For Excel users, the SaaS Metrics Dashboard in Excel is an equally powerful alternative.
Can I customize the data in this SaaS dashboard?
Yes. The template comes pre-loaded with realistic sample data for immediate exploration. You can replace the sample data in the data file with your own SaaS business data, and all charts, KPIs, and filters will update automatically to reflect your actual metrics.
How does this dashboard help reduce SaaS churn?
The dedicated Churn Analysis page provides 5 analytical views including Churn Risk Distribution, Renewal Status by Industry, At-Risk Accounts by Region, Churned Accounts by Industry, and Churn Risk by Plan Type. These insights help SaaS teams identify at-risk customers early, understand churn patterns, and take proactive retention actions before revenue is lost.
Can I export data from this HTML dashboard?
Yes. The Data View tab includes a one-click CSV export feature that lets you download filtered data for further analysis in Excel, Google Sheets, or any other spreadsheet application. You can also use the search and sort features to narrow down specific records before exporting.
Conclusion
The SaaS Metrics Dashboard in HTML is a powerful, ready-to-use analytics template that helps SaaS businesses monitor their most critical metrics — from MRR and ARR to customer health and churn risk — all from a single browser-based interface. With 5 interactive pages, 6 dynamic KPI cards, 20+ analytical charts, and advanced filtering capabilities, this dashboard provides everything you need to make data-driven decisions about your subscription business.
Whether you are a SaaS founder tracking growth metrics, a customer success manager monitoring satisfaction scores, or a financial analyst forecasting revenue, this template delivers professional-grade analytics without any software installation or technical setup.
Click here to Purchase SaaS Metrics Dashboard in HTML
Visit our YouTube channel for step-by-step video tutorials and dashboard walkthroughs:
Youtube.com/@NeoTechNavigators