Amazon FBA Seller Dashboard in HTML is a powerful, browser-based interactive analytics template designed for Amazon FBA sellers, private label brands, wholesale distributors, and e-commerce managers who need a comprehensive view of their Amazon business performance without installing any software. This ready-to-use HTML dashboard covers 5 interactive pages — Overview, Sales Analysis, Marketplace Insights, Profitability, and Data View — giving you instant visibility into every aspect of your Amazon FBA operations from revenue and orders to profitability and customer ratings.
Whether you run a single-product private label brand or manage hundreds of wholesales ASINs across multiple Amazon marketplaces, tracking sales performance, monitoring profitability, and understanding marketplace dynamics is critical for sustainable growth. This Amazon FBA Seller Dashboard in HTML provides all the analytics you need in a single browser window — no Excel, no Power BI, no installations. Just open the file and start analyzing. You can also explore the Amazon FBA Seller Dashboard in Excel, Amazon FBA Seller Dashboard in Power BI, or Amazon FBA Seller Dashboard in Google Sheets if you prefer working in those platforms.
Click here to Purchase Amazon FBA Seller Dashboard in HTML
Key Features of Amazon FBA Seller Dashboard in HTML
This Amazon FBA Seller Dashboard in HTML includes 5 interactive dashboard pages with 6 KPI cards and over 12 charts and visualizations. The dashboard supports dynamic slicers and filters allowing you to drill down by category, marketplace, fulfillment method, order status, and time period. It works in all modern browsers including Chrome, Edge, Firefox, and Safari with zero software installation. The Data View page includes search, sort, pagination, and CSV export capabilities for detailed data analysis.
- 5 Interactive Dashboard Pages — Overview, Sales Analysis, Marketplace Insights, Profitability, Data View
- 6 KPI Cards — Total Revenue, Net Profit, Total Orders, Avg. Rating, Units Sold, Profit Margin
- 12+ Charts and Visualizations — covering revenue trends, category analysis, marketplace comparisons, fulfillment breakdowns, and profitability
- Dynamic Slicers and Filters — filter the entire dashboard by category, marketplace, fulfillment method, and time period
- CSV Data Export — export filtered data from the Data View page
- Browser-Based — no installation needed, works on desktop and mobile
- Plug-and-Play — replace sample data with your own Amazon FBA data and everything auto-updates
Dashboard Pages Explanation
1. Overview Page
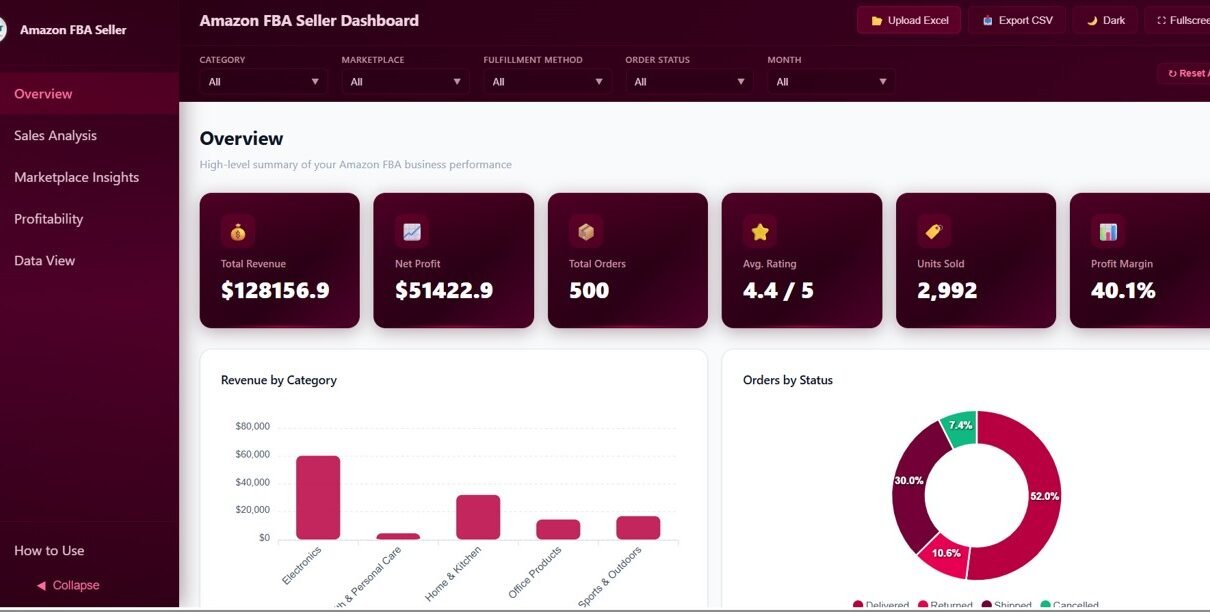
The Overview page is the central hub of the Amazon FBA Seller Dashboard in HTML. At the top, you will find 6 KPI cards displaying high-level metrics: Total Revenue, Net Profit, Total Orders, Avg. Rating, Units Sold, and Profit Margin. These cards give you an instant snapshot of your Amazon FBA business health at a glance.
Below the KPI cards, the Overview page features several analytical charts. Revenue by Category helps you identify which product categories generate the most income. Orders by Status breaks down your orders into shipped, pending, cancelled, and returned so you can monitor fulfillment efficiency. Monthly Revenue Trend tracks your income trajectory over time, helping you spot seasonal patterns and growth opportunities. Revenue by Marketplace compares performance across Amazon US, UK, Canada, Germany, and other global regions. Multiple slicers are available to filter the entire dashboard by different dimensions quickly.
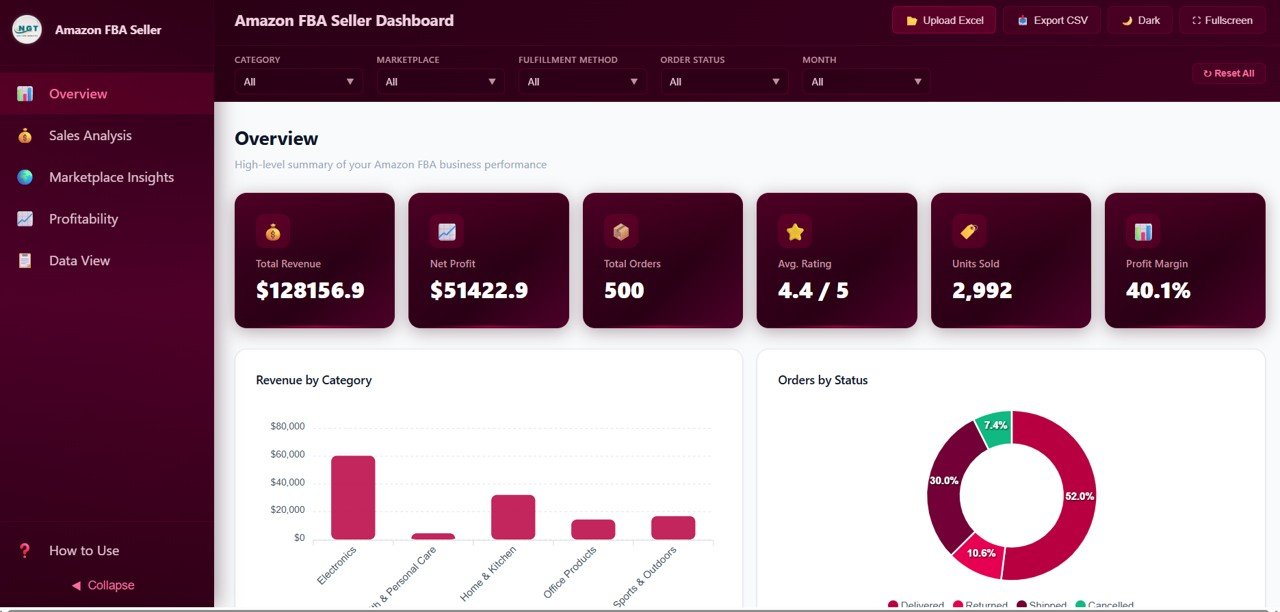
Amazon FBA Seller Dashboard – Overview
Click to buy Amazon FBA Seller Dashboard in HTML
2. Sales Analysis Page
The Sales Analysis page provides a deep dive into your Amazon FBA sales data. Top 10 Products by Revenue highlights your best-selling items so you can focus marketing efforts and inventory investment on your winners. Units Sold by Category reveals which product lines move the most volume, a critical insight for inventory planning. Average Unit Price by Category helps you analyze pricing strategy across different product groups. Revenue by Fulfillment Method compares performance between FBA (Fulfillment by Amazon), FBM (Fulfilled by Merchant), and SFP (Seller Fulfilled Prime), helping you decide the most profitable fulfillment strategy.
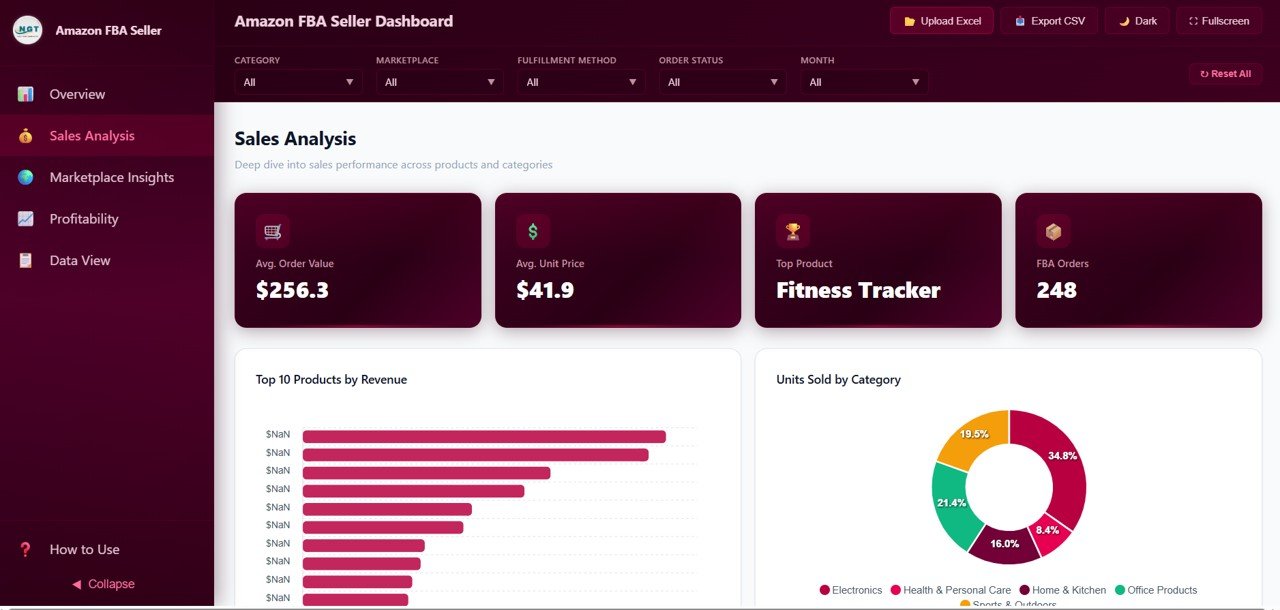
Amazon FBA Seller Dashboard – Sales Analysis
Click to buy Amazon FBA Seller Dashboard in HTML
3. Marketplace Insights Page
If you sell on multiple Amazon marketplaces globally, this page is essential. Revenue by Marketplace shows which regions generate the most revenue, while Average Customer Rating by Marketplace reveals how customer satisfaction varies across different countries. Orders by Marketplace and Status breaks down order volume and fulfillment status by region. Net Profit by Marketplace is the most valuable chart on this page — it shows exactly which marketplaces deliver the highest actual profit after all fees and costs. This analysis helps you decide where to invest more in advertising and inventory expansion.
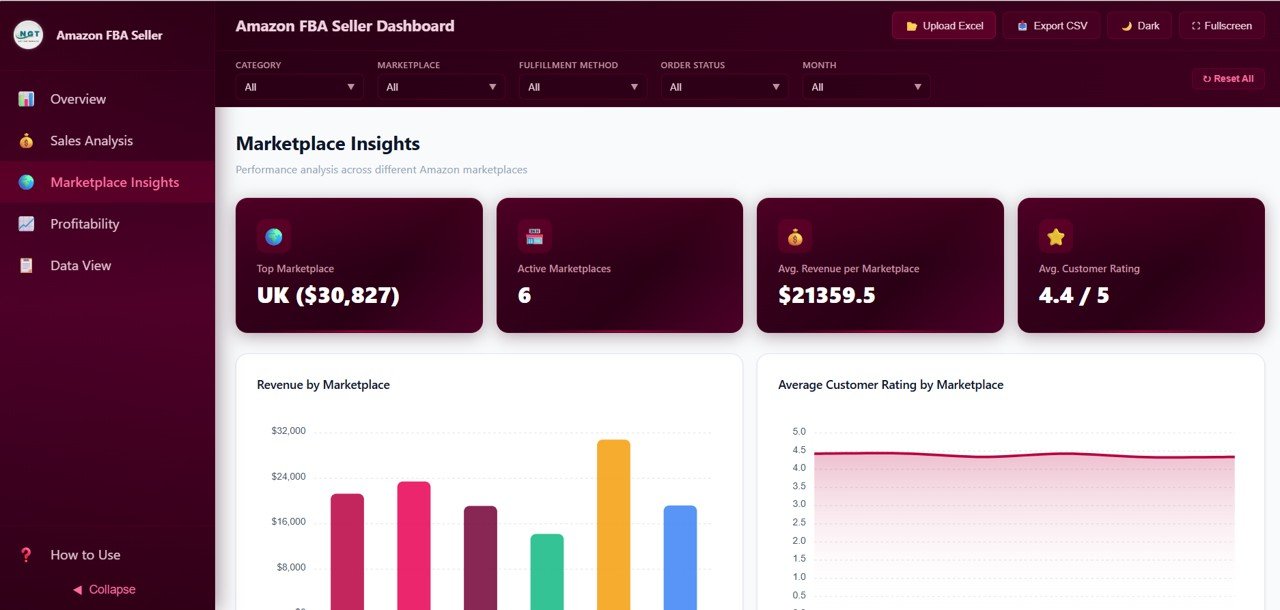
Amazon FBA Seller Dashboard – Marketplace Insights
Click to buy Amazon FBA Seller Dashboard in HTML
4. Profitability Page
Profitability is the true measure of Amazon FBA success, and this page gives you full financial transparency. Cost Breakdown categorizes your expenses into Amazon referral fees, FBA fees, shipping costs, COGS (cost of goods sold), and advertising spend so you can see exactly where your money goes. Net Profit by Category shows which product categories deliver the highest margins, while Monthly Profit Trend tracks your earnings trajectory over time. Profit Margin by Product pinpoints which individual SKUs deliver the highest returns — an essential analysis for optimizing your product portfolio and cutting underperformers.
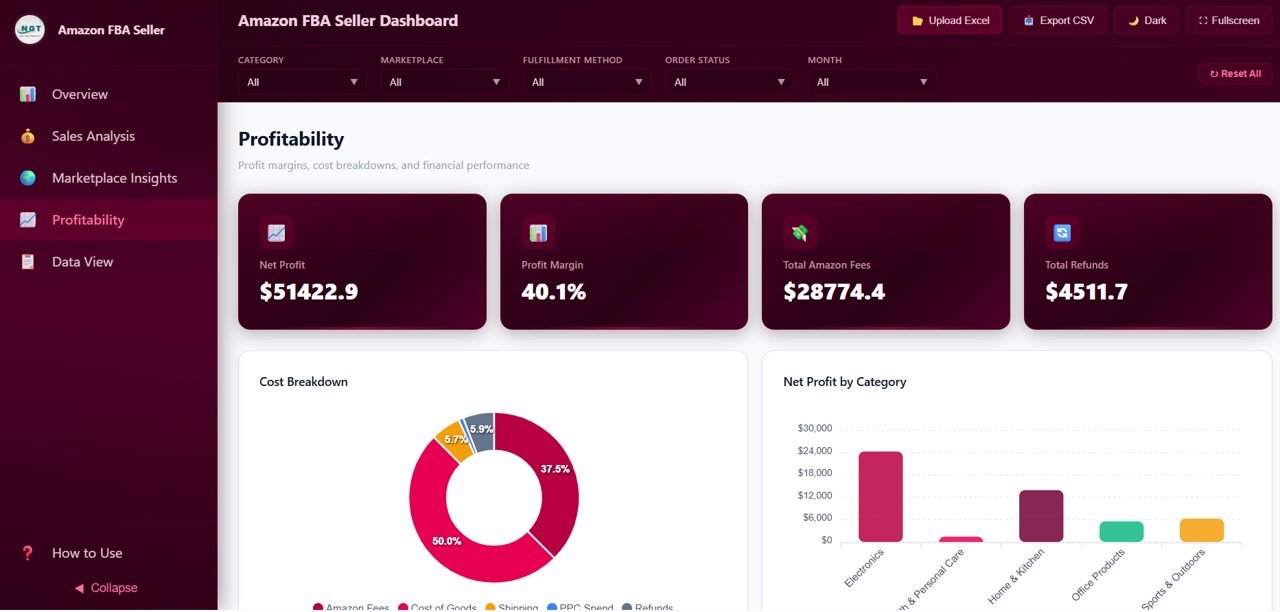
Amazon FBA Seller Dashboard – Profitability
Click to buy Amazon FBA Seller Dashboard in HTML
5. Data View Page
The Data View page is a detailed data table showing all records with full search, sort, and pagination capabilities. You can filter data by any column, sort ascending or descending, and navigate through pages of records. The CSV export feature lets you download filtered data for further analysis in Excel or Google Sheets. This page is perfect for detailed investigations, reconciling orders, or sharing raw data with accountants and business partners.
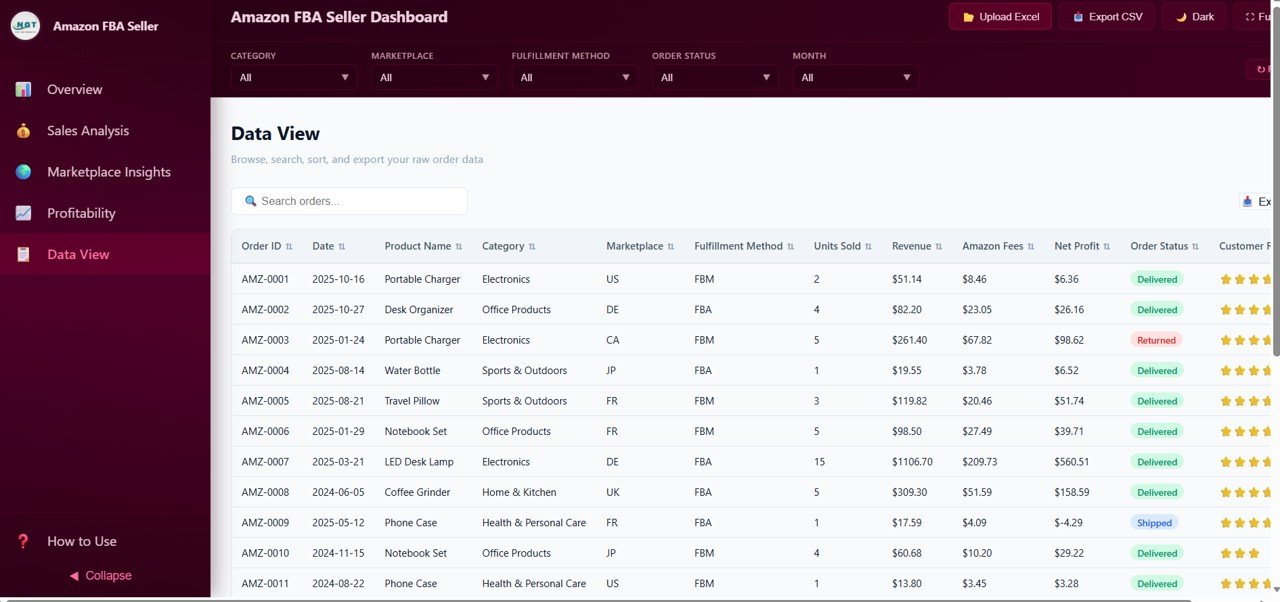
Data View
Click to buy Amazon FBA Seller Dashboard in HTML
Advantages of Amazon FBA Seller Dashboard in HTML
- Zero Installation Required — Unlike Excel or Power BI dashboards, this HTML template works directly in your browser with no software to download or configure.
- Complete Business Visibility — 5 dedicated pages cover every angle of your Amazon FBA business from high-level KPIs to granular data records.
- Multi-Marketplace Support — Compare revenue, orders, profitability, and ratings across all Amazon global marketplaces in one unified view.
- Cross-Platform Compatibility — Works on any operating system (Windows, Mac, Linux) and any modern browser.
- Mobile Responsive — Access your Amazon FBA analytics from your phone or tablet while on the go.
- Data Export Ready — Export filtered data to CSV for accounting, tax filing, or deeper analysis.
- Privacy-Focused — All data stays on your local machine. Nothing is uploaded to the cloud unless you choose to.
Opportunities for Improvement
- Adding a date range picker for custom time period comparisons would enhance the filtering capabilities.
- Integration with Amazon Seller Central API for automatic data refresh would eliminate manual data entry.
- An inventory health analysis page showing aging inventory, restock alerts, and storage fee projections could add deeper operational insights.
- Adding PPC advertising performance metrics like ACoS, ROAS, and ad spend by campaign would provide a more complete marketing picture.
Best Practices
- Update your data regularly — Import fresh Amazon order data weekly or bi-weekly to keep your dashboard current and actionable.
- Use marketplace filters strategically — Narrow down to specific marketplaces to identify regional trends and opportunities.
- Monitor profit margin by product closely — Identify and eliminate low-margin or negative-margin SKUs draining your profitability.
- Track fulfillment method performance — Compare FBA vs FBM economics to optimize your fulfillment strategy.
- Export data for tax season — Use the CSV export to share clean financial data with your accountant or bookkeeper.
Explore Relevant Templates
If you are looking for Amazon FBA analytics in other platforms or broader e-commerce tracking solutions, check out these related templates from NextGenTemplates:
- Amazon FBA Seller Dashboard in Excel — Spreadsheet-based Amazon FBA analytics with pivot tables, dynamic charts, and powerful data manipulation features.
- Amazon FBA Seller Dashboard in Power BI — Advanced interactive Power BI version with drill-through capabilities and DAX calculations for enterprise-level Amazon analytics.
- Etsy Seller Analytics Dashboard in HTML — Browser-based Etsy shop analytics covering sales, traffic, engagement, and profitability.
- Sales and Revenue Command Center Dashboard in HTML — Comprehensive HTML sales dashboard for tracking revenue, pipeline, and team performance across channels.
- Small Business CFO Dashboard in HTML — Financial overview dashboard for small business owners covering P&L, cash flow, and expense tracking.
Click here to Purchase Amazon FBA Seller Dashboard in HTML
Frequently Asked Questions
What is the best HTML dashboard template for tracking Amazon FBA sales?
The Amazon FBA Seller Dashboard in HTML by NextGenTemplates is one of the most comprehensive browser-based Amazon FBA analytics templates available. It includes 5 interactive pages, 6 KPI cards, and over 12 charts covering revenue, orders, marketplace performance, profitability, and customer ratings — all without requiring any software installation.
How do I use the Amazon FBA Seller Dashboard in HTML?
Simply download and unzip the template file, then open index.html in any modern browser like Chrome, Edge, Firefox, or Safari. Replace the sample data with your own Amazon FBA order data and all charts, KPI cards, and filters will update automatically. No coding or technical skills required.
Can I track multiple Amazon marketplaces with this dashboard?
Yes. The Marketplace Insights page compares revenue, orders, customer ratings, and net profit across all your Amazon marketplaces including US, UK, Canada, Germany, and more. You can instantly identify which regions deliver the best performance and highest margins.
Can I track Amazon FBA fees and profitability with this dashboard?
Yes. The Profitability page provides detailed analysis including Cost Breakdown showing Amazon fees, shipping, COGS, and advertising spend. Net Profit by Category and Profit Margin by Product help you understand exactly which product lines deliver the highest returns.
Does this Amazon FBA HTML dashboard work on mobile devices?
Yes. The Amazon FBA Seller Dashboard in HTML is mobile responsive and works on smartphones, tablets, and desktops across all modern browsers including Chrome, Edge, Firefox, and Safari.
Is there an Excel, Power BI, or Google Sheets version of this Amazon FBA dashboard?
Yes. NextGen Templates offers the Amazon FBA Seller Dashboard in four formats: HTML (browser-based), Excel (spreadsheet), Power BI (advanced analytics), and Google Sheets (cloud-based).
Conclusion
The Amazon FBA Seller Dashboard in HTML is the perfect solution for Amazon FBA sellers who want powerful analytics without the complexity of desktop software. With 5 interactive pages, 6 KPI cards, and 12+ charts, this dashboard gives you complete visibility into your revenue, orders, marketplace performance, profitability, and customer ratings — all from your web browser. Replace the sample data with your own Amazon FBA order data and start making data-driven decisions today.
Click here to Purchase Amazon FBA Seller Dashboard in HTML
For step-by-step tutorials and dashboard walkthroughs, visit our YouTube channel:
👉 Youtube.com/@NeoTechNavigators