Insurance Agency Dashboard in Google Sheets is a powerful, ready-to-use analytics template built for insurance agencies, brokers, underwriters, and risk managers who need to monitor policy performance, premium collection, claims activity, agent productivity, and risk levels from a single interactive Google Sheets dashboard. This comprehensive template from NextGenTemplates transforms raw insurance agency data into meaningful visual insights that support faster, smarter decision-making across every level of your organization.
Whether you run a solo brokerage or manage a multi-agent insurance operation, this dashboard delivers premium analytics covering 6 dedicated pages with 5 high-level KPIs, interactive charts, slicer-based filtering, policy search functionality, and a structured data sheet. No software installation is needed — just open the Google Sheets link, paste your data, and start analyzing your insurance portfolio instantly. If you prefer spreadsheet-based analytics, check out the Insurance Agency Dashboard in Excel, or for advanced reporting explore the Insurance Agency Dashboard in Power BI. Browse all Google Sheets Dashboard Templates from NextGen Templates.
Key Features of Insurance Agency Dashboard in Google Sheets
This Insurance Agency Dashboard in Google Sheets comes packed with features designed for real-world insurance agency analytics. The dashboard offers multi-page interactive analytics across 6 sheet tabs that cover agency overview, policy analysis, claims analysis, agent performance evaluation, policy record search, and raw data management.
At the top of the Overview page, 5 dynamic KPI cards display Total Policies, Total Premiums, Total Coverage, Total Claims Paid, and Avg Premium per Policy — giving you an instant operational snapshot of your entire insurance portfolio. The dashboard includes global slicers that allow you to filter the entire dashboard by policy type, region, risk level, payment method, and other dimensions for focused analysis.
Interactive chart visualizations including bar charts, line trends, donut charts, and comparison analyses update dynamically based on your filter selections. The Google Sheets platform enables real-time collaboration, so multiple team members can view and analyze data simultaneously from any device. For a related HTML-based solution, explore the Insurance Agency Dashboard in HTML.
Dashboard Pages Explanation
Click here to Purchase Insurance Agency Dashboard in Google Sheets
1. Overview Page
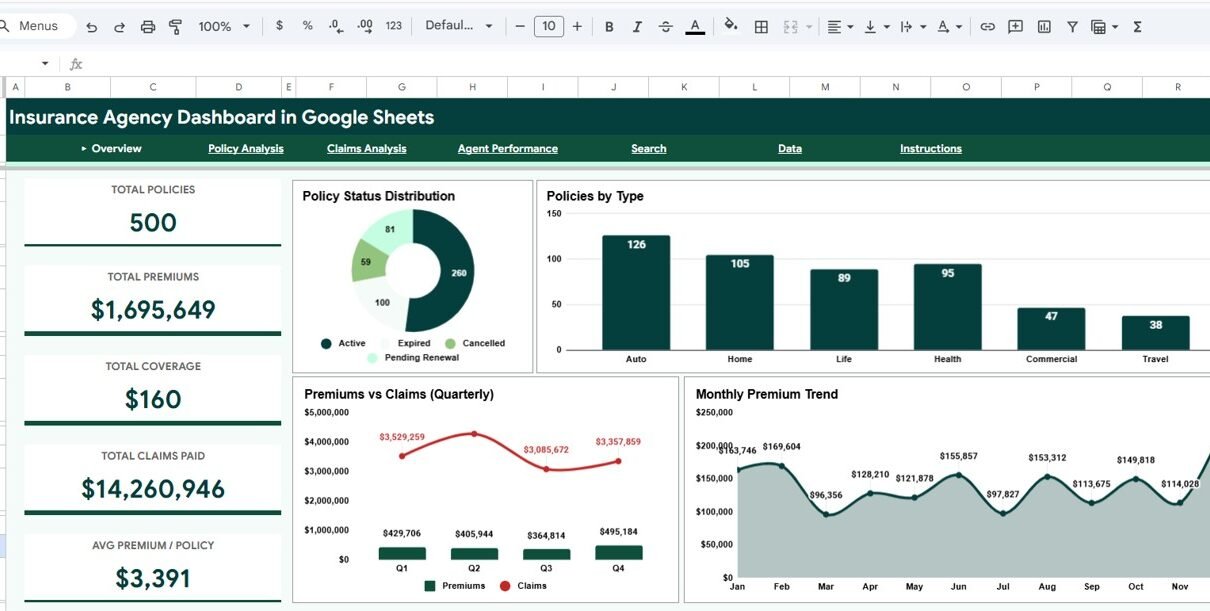
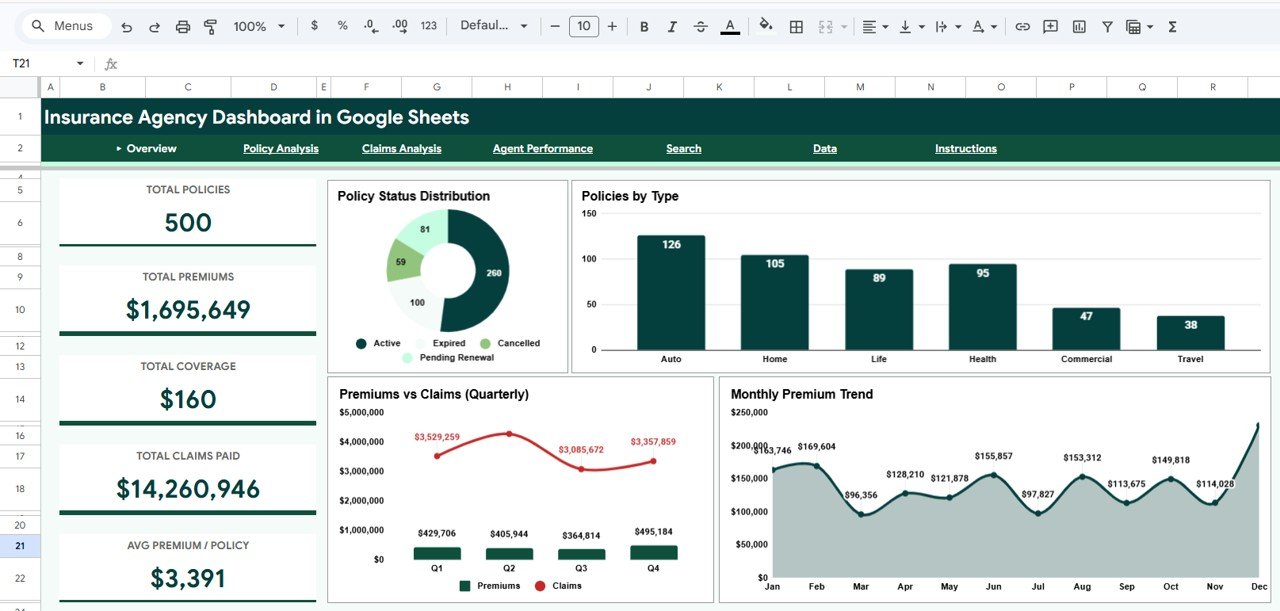
The Overview page serves as your command center for insurance agency operations. At the top, five high-level KPI cards display Total Policies, Total Premiums, Total Coverage, Total Claims Paid, and Avg Premium/Policy. These cards provide an immediate snapshot of your entire agency’s health and financial performance.
Below the KPI cards, you will find a rich collection of interactive charts. Policy Status Distribution by Status Category shows the breakdown of active, expired, cancelled, and pending policies across your portfolio. Policies by Type reveals which insurance product lines — auto, health, life, property, and others — have the highest policy count. Premiums vs Claims by Quarter compares total premiums collected against total claims paid each quarter, highlighting profitability trends and seasonal patterns. Monthly Premium Trend by Month tracks your premium collection trajectory over time, helping you identify growth momentum or potential declines. Multiple slicers are available to apply filters and see the filtered dashboard quickly.
Insurance Agency Dashboard in Google Sheets
2. Policy Analysis
The Policy Analysis page provides a deep dive into your insurance portfolio composition across multiple dimensions. Avg Coverage and Premium by Policy Type compares average coverage amounts and premium levels across insurance categories, helping you benchmark your pricing and underwriting strategies.
Risk Level Distribution by Region segments policies into low, medium, and high risk categories across geographic regions, providing risk exposure visibility critical for portfolio management. Payment Method Distribution by Payment Method shows how policyholders prefer to pay — cash, credit card, bank transfer, or check — giving insights into payment processing efficiency. Total Premiums by Region displays geographic premium distribution to support market expansion planning and territory performance evaluation.
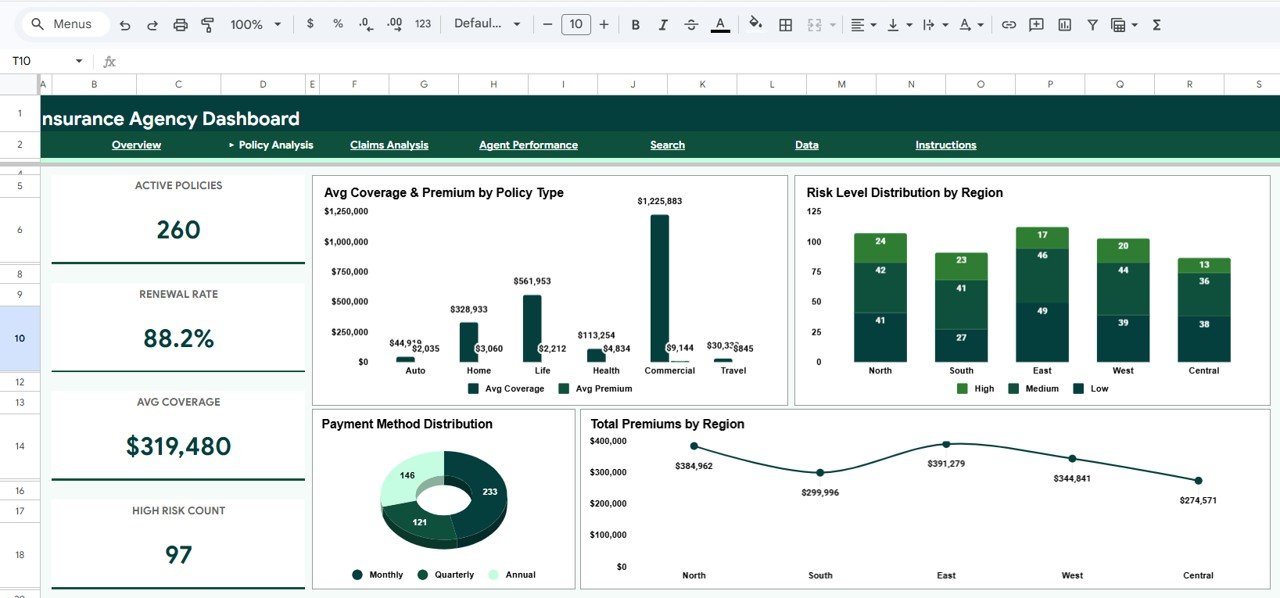
Policy Analysis
3. Claims Analysis
The Claims Analysis page is essential for understanding claims behavior and risk patterns across your insurance portfolio. Claims by Risk Level segments claims into low, medium, and high risk categories, helping risk managers identify where claims exposure is concentrated.
Claims by Policy Type breaks down claim volumes across insurance product categories to identify which lines generate the most claims activity. Monthly Claims Trend by Month tracks claims volume over time, revealing seasonal spikes and long-term patterns that inform reserve planning. Coverage vs Claim Amount compares coverage levels against actual claim amounts, helping underwriters evaluate the adequacy of coverage limits and identify potential loss ratios. For related insurance analytics in HTML format, explore the browser-based alternative.
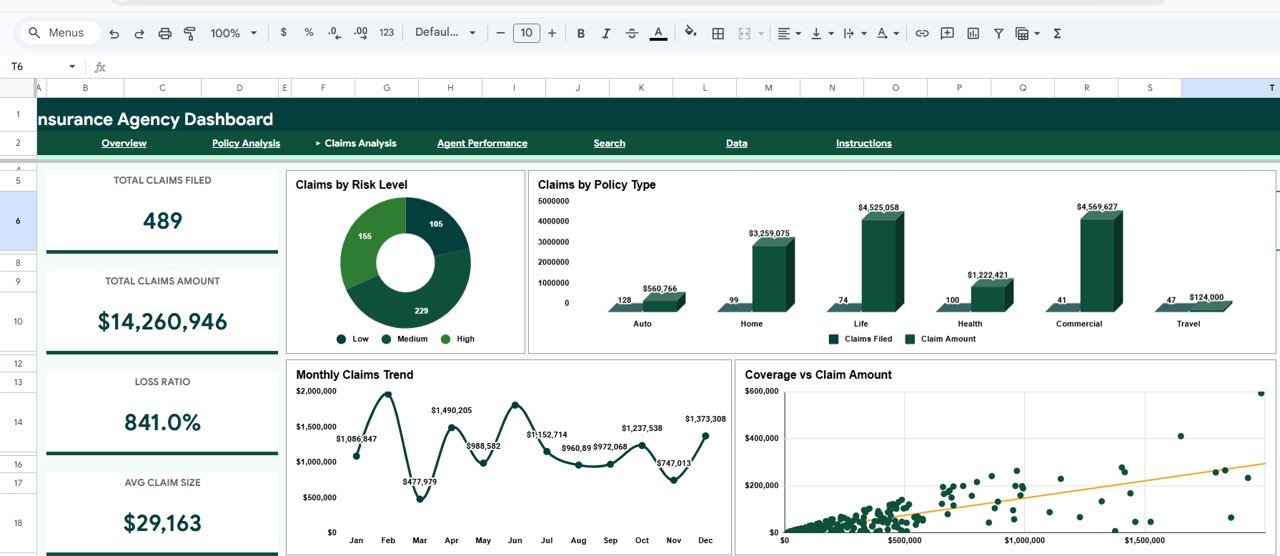
Claims Analysis
4. Agent Performance
The Agent Performance page evaluates individual agent productivity and effectiveness across three key dimensions. Agent Policies and Premiums by Agent ranks your agents by total policies managed and premiums generated, making it easy to identify your top revenue producers and underperforming team members.
Claims Amount by Agent shows total claims amounts per agent, helping managers spot agents whose portfolios generate disproportionately high claims. Active vs Other Policies by Agent compares the ratio of active policies to expired, cancelled, or pending policies for each agent, revealing retention effectiveness and policy lifecycle management quality across your sales team.
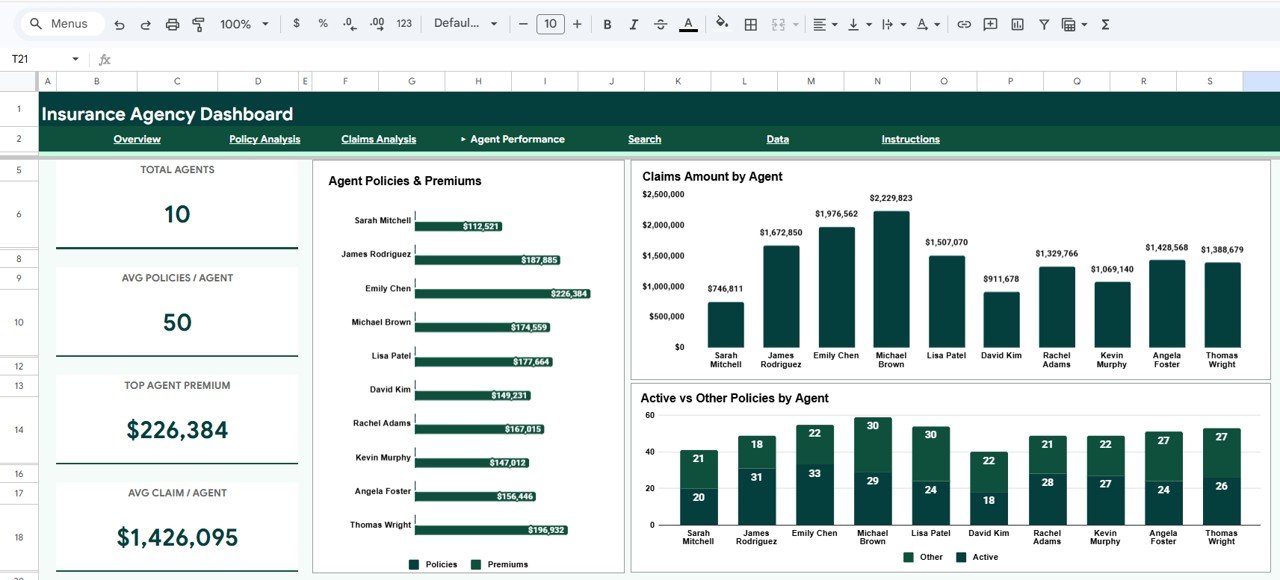
Agent Performance
5. Search Page
The Search Page provides a powerful policy record lookup feature. You can select any Policy ID from a dropdown and instantly view the complete policy details including Policy ID, Date Issued, Policy Type, Agent Name, Client Name, Region, Coverage Amount, Premium Amount, Claims Filed, Claim Amount, Policy Status, Payment Method, and Risk Level. This is invaluable for front-desk staff, billing teams, and agency managers who need to quickly access individual policy information without scrolling through hundreds of records.
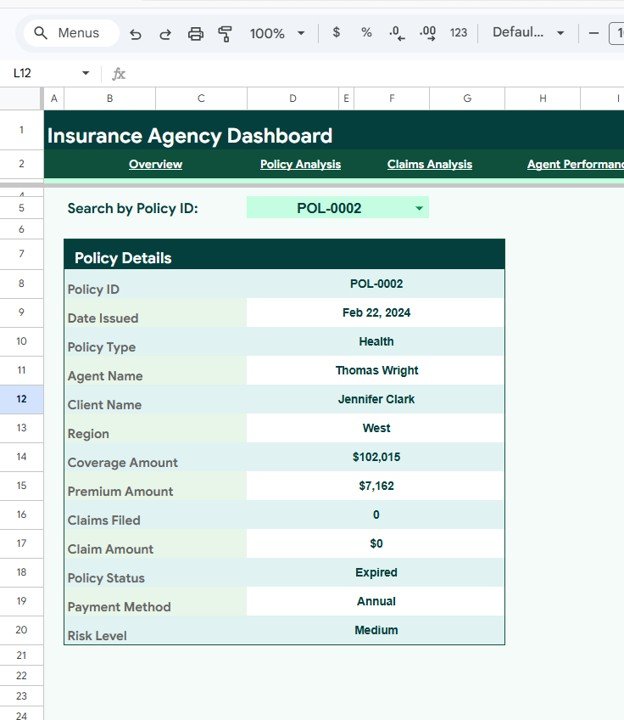
Search Sheet Tab
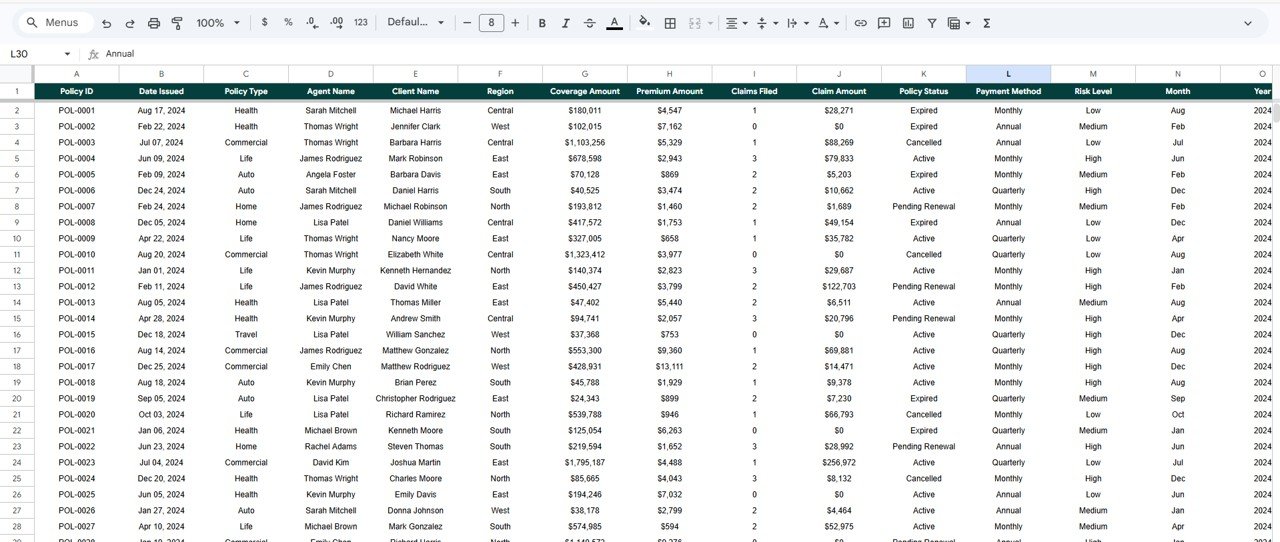
6. Data Sheet Tab
The Data Sheet is the structured data entry page where all insurance agency records are stored. It comes pre-loaded with sample records in a standardized format with columns for Policy ID, Date Issued, Policy Type, Agent Name, Client Name, Region, Coverage Amount, Premium Amount, Claims Filed, Claim Amount, Policy Status, Payment Method, and Risk Level. Simply replace the sample data with your own agency data in the same format, and the entire dashboard updates automatically across all pages.
Data Sheet Tab
Advantages of Insurance Agency Dashboard in Google Sheets
This dashboard offers several significant advantages for insurance professionals. First, it requires zero software installation — simply open the Google Sheets copy link from the PDF guide and create your own editable copy in Google Drive. This makes it ideal for insurance teams that need quick access to analytics without IT overhead or licensing costs.
The multi-page structure with dedicated analysis pages for agency overview, policy composition, claims intelligence, agent evaluation, and individual record search ensures that different stakeholders can find the insights most relevant to their role. The global slicer system means that a single selection cascades across all charts and metrics, saving time and ensuring consistency in analysis.
The cloud-based Google Sheets platform enables real-time collaboration, so agency managers, agents, underwriters, and administrative staff can all view and work with the same data simultaneously. The structured data sheet format makes monthly data updates straightforward — simply add new policy records and the dashboard recalculates everything automatically.
Opportunities for Improvement
While this dashboard provides excellent coverage of insurance agency analytics, there are areas where users might consider enhancements. Adding a dedicated renewal tracking page with upcoming renewal dates, expiration alerts, and retention rate calculations would strengthen lifecycle management capabilities. A customer segmentation page breaking down policyholders by demographics, tenure, and premium tiers could improve cross-sell and upsell targeting.
Integration with Google Apps Script could enable automated email alerts when claims exceed threshold amounts or when agent performance drops below benchmarks. A profitability analysis page calculating loss ratios by policy type and region would add financial depth for underwriting teams.
Best Practices for Using the Insurance Agency Dashboard
To get the most out of this Insurance Agency Dashboard in Google Sheets, follow these recommended practices. Update your data regularly — monthly or weekly uploads ensure that your KPIs and trend analyses reflect current operational reality. Use the global slicers strategically to isolate specific policy types, regions, or risk levels when investigating performance patterns.
Start each analysis session on the Overview page to get a high-level pulse check, then drill into the specific analysis page that addresses your current question. Leverage the Claims Analysis page for quarterly risk reviews and reserve planning. Use the Search Page for quick policy lookups during customer calls or billing discussions.
Share the dashboard with your team via Google Drive sharing — since it is a cloud-based Google Sheets file, anyone with access can open and explore the data independently from any device. For additional guidance on Google Sheets functionality, check the official Google Sheets Help Center for tips on using charts and filters.
Explore Relevant Templates
- Insurance Agency Dashboard in Excel — Pivot-driven Excel version with slicers, KPI cards, and automated formulas for insurance analytics.
- Insurance Agency Dashboard in Power BI — Interactive Power BI version with 5 pages and dynamic slicers for advanced insurance reporting.
- Insurance Agency Dashboard in HTML — Browser-based insurance analytics with zero software installation.
- Dental Practice Dashboard in Google Sheets — Cloud-based dental clinic analytics with patient metrics, revenue tracking, and satisfaction analysis.
- All Google Sheets Dashboard Templates — Browse the complete collection of Google Sheets dashboards.
Frequently Asked Questions
Click here to Purchase Insurance Agency Dashboard in Google Sheets
What KPIs does the Insurance Agency Dashboard in Google Sheets track?
The Insurance Agency Dashboard in Google Sheets tracks 5 key performance indicators: Total Policies, Total Premiums, Total Coverage, Total Claims Paid, and Average Premium per Policy. It also provides 15+ analytical charts across 4 analysis pages covering policy distribution, claims intelligence, agent performance, and premium trends.
Do I need any special software to use this Google Sheets dashboard?
No special software or installation is required. Simply open the Google Sheets copy link from the included PDF guide and the dashboard opens in your browser via Google Drive. It works on any device with internet access including desktops, laptops, tablets, and mobile phones.
Can I filter the dashboard by specific policy type or region?
Yes. The dashboard includes multiple interactive slicers on the Overview page that let you filter all charts and KPIs by policy type, region, risk level, payment method, and other dimensions. When you apply a filter, all visualizations across the dashboard update instantly.
Can I search for individual policy records in this dashboard?
Yes. The dedicated Search Page lets you select any Policy ID from a dropdown to instantly view complete policy details including date issued, policy type, agent name, client name, region, coverage amount, premium amount, claims filed, claim amount, policy status, payment method, and risk level — all without scrolling through the data sheet.
Is this dashboard available in Excel, Power BI, or HTML?
Yes. NextGenTemplates offers the Insurance Agency Dashboard in Excel with pivot tables and slicers, the Insurance Agency Dashboard in Power BI with interactive visuals, and the Insurance Agency Dashboard in HTML for browser-based analytics.
How many records can this dashboard handle?
The template comes with sample records and can scale to handle thousands of records in Google Sheets. Simply add your data rows in the Data Sheet tab and the entire dashboard recalculates and updates automatically across all 6 pages.
Conclusion
The Insurance Agency Dashboard in Google Sheets is a powerful, ready-to-use analytics tool that brings clarity to complex insurance agency operations. With six dedicated analysis pages covering agency overview, policy composition, claims intelligence, agent performance evaluation, policy record search, and structured data management, this dashboard equips insurance professionals with the insights they need to optimize premiums, manage risk, evaluate agents, and make data-driven operational decisions.
Whether you are an agency owner tracking premium trends, a risk manager monitoring claims exposure, or an operations lead evaluating agent productivity, this Google Sheets dashboard delivers professional-grade analytics with zero installation and maximum flexibility.
Click here to Purchase Insurance Agency Dashboard in Google Sheets
Visit our YouTube channel for step-by-step video tutorials and dashboard walkthroughs:
Youtube.com/@NeoTechNavigators