The Workforce Analytics Dashboard in Google Sheets tracks employee data across 6 interactive pages, covering salary analysis, training hours, performance scores, and attendance — with 3 KPI summary cards and dynamic slicers. According to Google’s official documentation, Google Sheets supports up to 10 million cells per spreadsheet, making it a capable platform for workforce analytics at small-to-mid-size organizations. This dashboard takes under 10 minutes to set up — paste your employee data and every chart, card, and analysis page recalculates automatically.Workforce Analytics Dashboard in Google Sheets
Whether you manage HR for a 30-person startup or a 500-employee company, tracking salary distribution, training investment, performance scores, and attendance patterns manually wastes hours every week. The Workforce Analytics Dashboard in Google Sheets eliminates that manual effort with pre-built charts, automatic calculations, and real-time collaboration that paid SaaS platforms like BambooHR charge $6-12 per employee per month to deliver.
Key Features of the Workforce Analytics Dashboard in Google Sheets
Click here to Purchase the Workforce Analytics Dashboard in Google Sheets
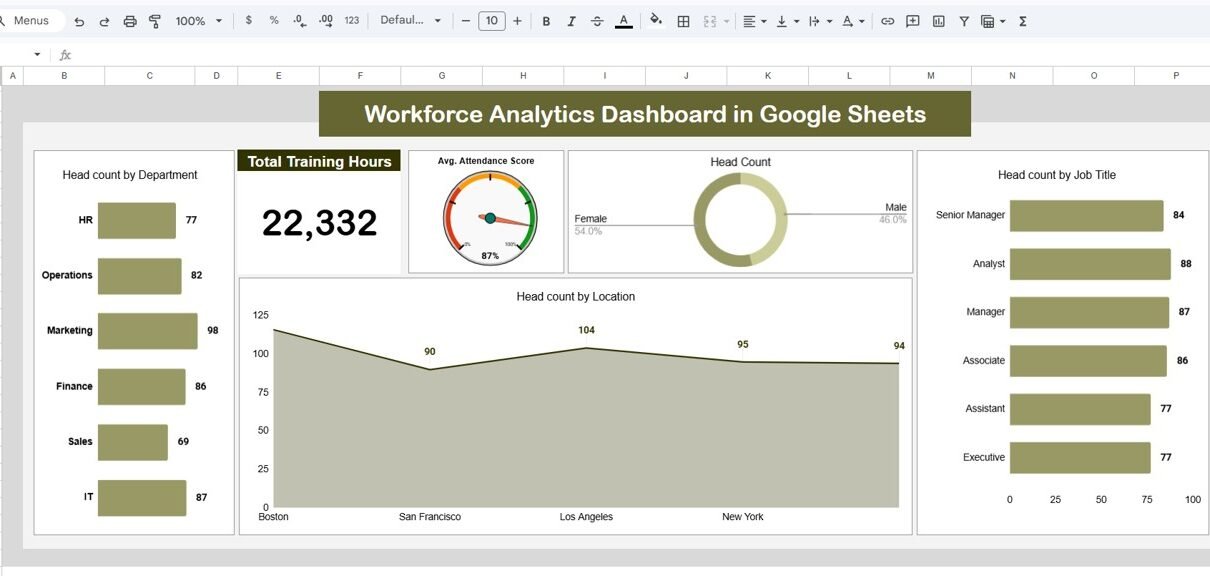
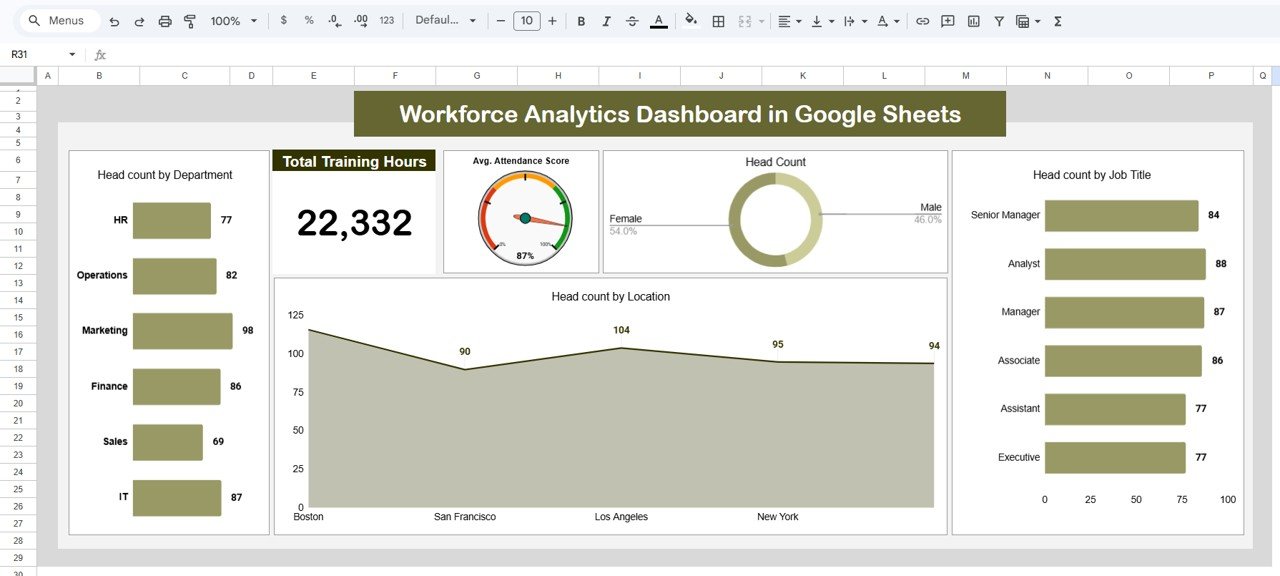
This dashboard packs 6 dedicated pages into a single Google Sheets file. The Overview page displays 3 KPI cards — Total Training Hours, Average Attendance Score, and Head Count — alongside charts showing headcount distribution by department, location, and job title. Dynamic slicers on the overview page let you filter every chart simultaneously by department, location, job title, or employee name.
The remaining 4 analysis pages each break down a specific workforce metric across 4 dimensions: Department, Location, Job Title, and Employee. This gives HR managers 16 distinct analytical views without writing a single formula. The Data Sheet tab holds all employee records in a structured format — add or update rows and the entire dashboard refreshes instantly.Workforce Analytics Dashboard in Google Sheets
The dashboard is fully unlocked and editable, so you can add new departments, rename job titles, change chart styles, or duplicate pages for custom analysis. Real-time collaboration is built into Google Sheets, letting multiple team members view and edit simultaneously from any device.Workforce Analytics Dashboard in Google Sheets
Dashboard Pages Explanation
Click here to Purchase the Workforce Analytics Dashboard in Google Sheets
Page 1 — Overview Dashboard
The overview page is the central command center for your workforce data. Three KPI cards at the top display Total Training Hours, Average Attendance Score, and Head Count. Below the cards, three charts visualize Head Count by Department, Head Count by Location, and Head Count by Job Title. Multiple slicers let you filter the entire dashboard by department, location, job title, or employee to see filtered results instantly.
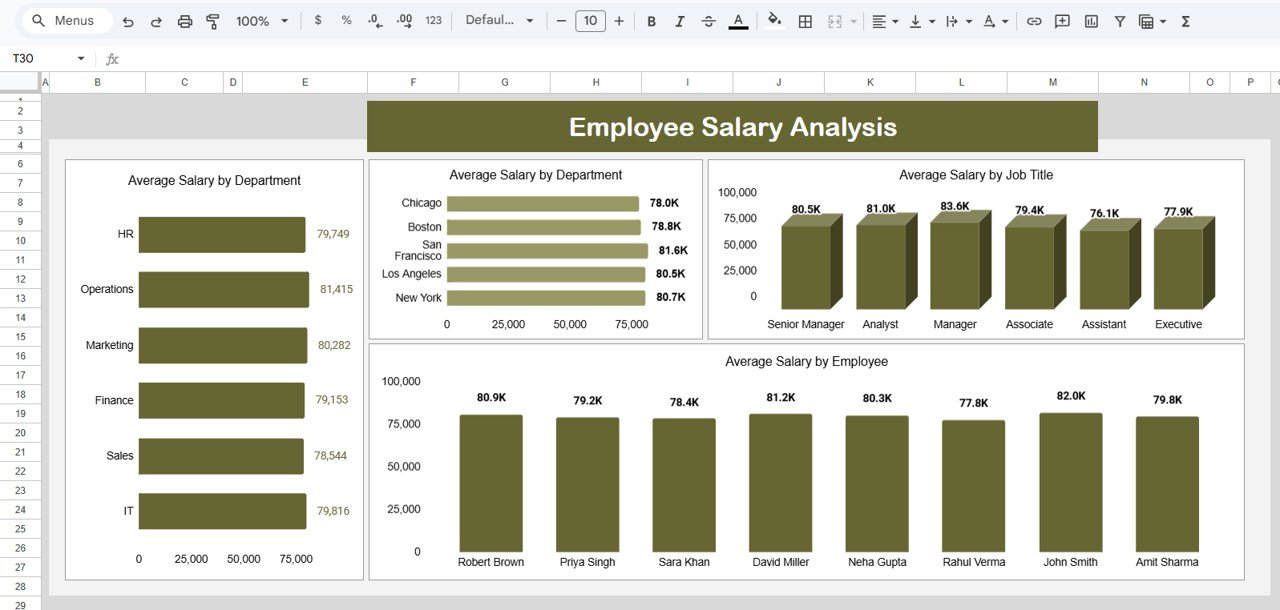
Workforce Analytics Dashboard in Google Sheets — Overview PagePage 2 — Employee Salary Analysis
This dedicated salary benchmarking page shows Average Salary by Department, Average Salary by Location, Average Salary by Job Title, and Average Salary by Employee. Use it to identify pay gaps across departments, compare compensation across office locations, and benchmark individual salaries against role averages.
 Employee Salary Analysis
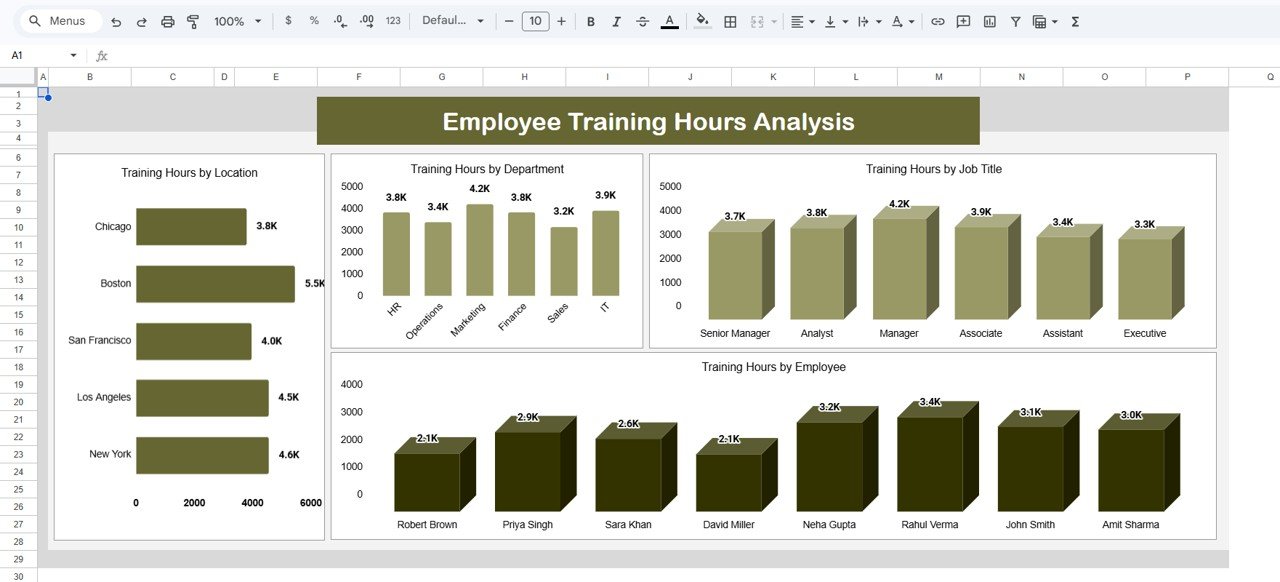
Page 3 — Employee Training Hours Analysis
Track training investment visibility with Training Hours by Location, Training Hours by Department, Training Hours by Job Title, and Training Hours by Employee. Identify which teams or locations are receiving the most development time, and which roles need additional investment.
 Employee Training Hours Analysis
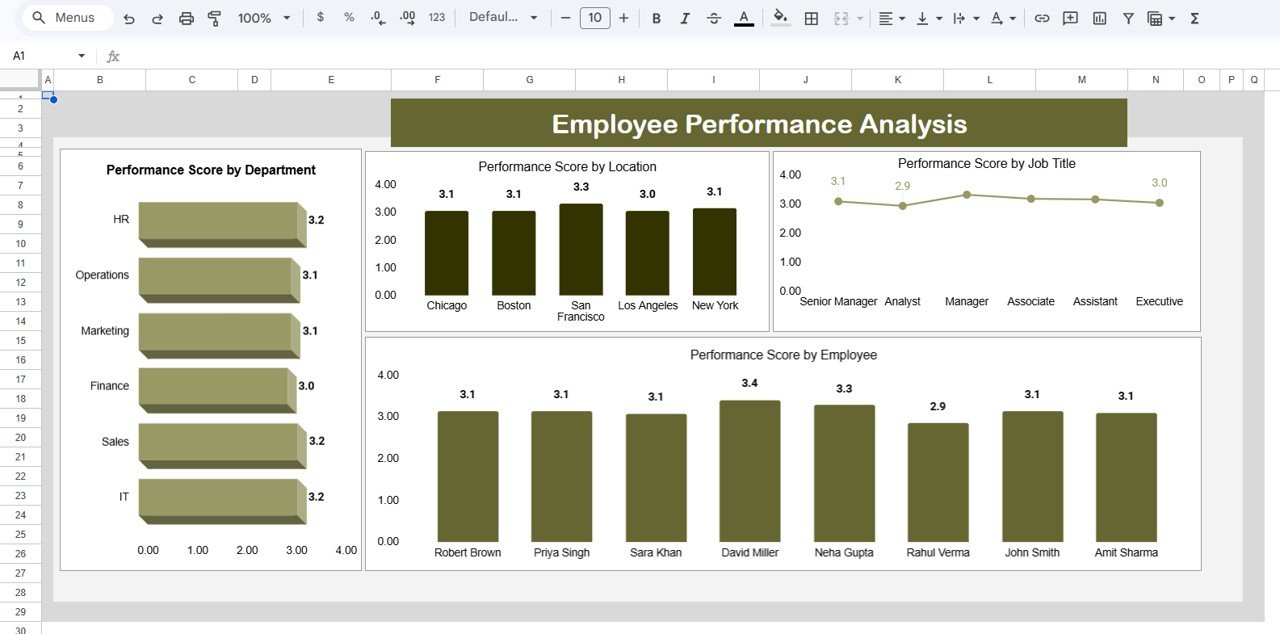
Page 4 — Employee Performance Analysis
Visualize performance scores with Performance Score by Department, Performance Score by Location, Performance Score by Job Title, and Performance Score by Employee. Quickly spot top-performing teams, identify departments that may need additional coaching, and compare individual scores against organizational averages.
 Employee Performance Analysis
Page 5 — Employee Attendance Analysis
Monitor attendance patterns with Attendance by Location, Attendance by Department, Attendance by Job Title, and Attendance by Employee. Spot absenteeism trends early, compare attendance scores across teams, and identify individuals who may need support before issues escalate.
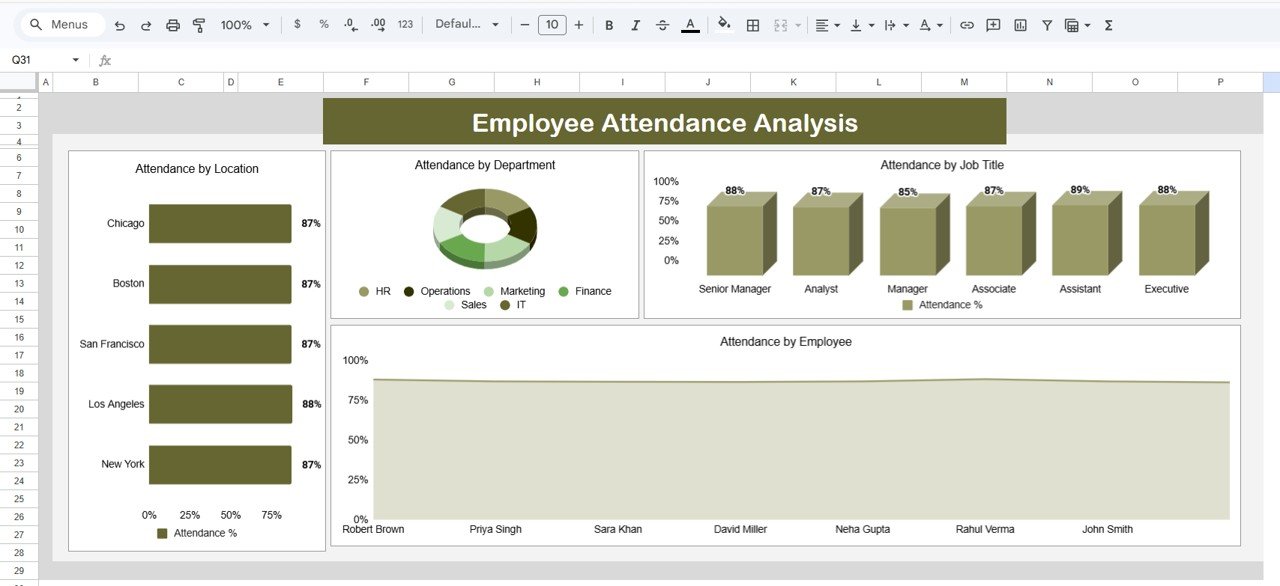 Employee Attendance Analysis
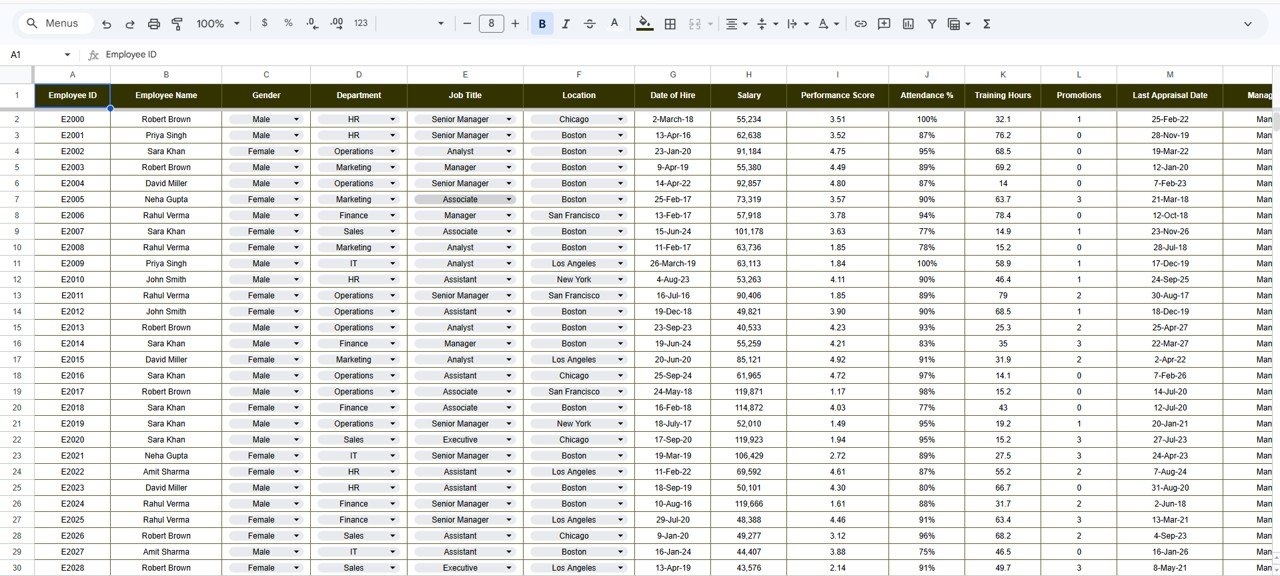
Page 6 — Data Sheet
The Data Sheet tab is where all employee records live. Columns include employee name, department, location, job title, salary, training hours, performance score, and attendance score. Add your data in the same format as the sample records, and every chart and KPI card across all 5 dashboard pages updates automatically.
 Data Sheet Tab
Click here to Purchase the Workforce Analytics Dashboard in Google Sheets
Perfect for:
- HR managers at companies with 10-500 employees tracking salary, training, performance, and attendance
- Small business owners who need a workforce overview without enterprise software costs
- HR consultants delivering analytics to multiple clients using a reusable template
- Startup founders who want workforce visibility in 10 minutes, not 4 weeks
Not a fit if:
- You need enterprise HRIS features — SSO, role-based access, audit trails, SOC 2 compliance
- You require automated payroll integration with ADP, Workday, or Gusto
- Your organization has 1,000+ employees needing EEOC compliance reporting
Real-World Use Cases
Priya manages HR for a 120-person logistics company. She uses the Workforce Analytics Dashboard to compare salary averages across 5 departments, identify which locations have the lowest attendance scores, and present quarterly training investment reports to leadership — all from a single Google Sheet her team can access on any device.
Carlos runs a 45-person SaaS startup across 3 offices. He needed a quick way to track performance scores by team and spot which departments were falling behind on training hours. The dashboard gave him that visibility in 10 minutes without signing up for BambooHR or Workday.
Amanda is an independent HR consultant serving 6 small-business clients. She duplicates this dashboard for each client, customizes the fields, and uses it as a standard analytics deliverable — saving 15+ hours per client on manual report building.
Advantages of the Workforce Analytics Dashboard
Click here to Purchase the Workforce Analytics Dashboard in Google Sheets
- Zero recurring costs — $9.99 one-time vs. $3,600-$7,200/year for BambooHR at 5 users
- No software installation — runs entirely in the browser on any device with a Google account
- Built-in collaboration — share view or edit access with team members via Google Sheets link
- 16 analytical views — 4 metrics (salary, training, performance, attendance) x 4 dimensions each
- Instant setup — under 10 minutes from download to a fully functional dashboard
- Fully customizable — add departments, rename fields, create new analysis pages
Opportunities for Improvement
- No automated data import — employee data must be entered or pasted manually into the Data Sheet tab. Organizations already using an HRIS may prefer an API-connected tool.
- No role-based access control — Google Sheets sharing is all-or-nothing. Sensitive salary data is visible to anyone with edit access unless you create separate restricted sheets.
- Static historical analysis — the dashboard shows current-state data. For trend analysis over months or years, you would need to archive snapshots or add date-stamped columns manually.
Best Practices
Click here to Purchase the Workforce Analytics Dashboard in Google Sheets
- Keep the Data Sheet clean — use consistent naming for departments, locations, and job titles. Typos create extra categories in the charts.
- Use the slicers on the Overview page to present filtered views during meetings instead of creating separate reports.
- Duplicate analysis pages if you want to track additional metrics — the chart structure is reusable.
- Archive quarterly snapshots by creating a copy of the file at the end of each quarter for historical trend analysis.
- Restrict salary page access by using Google Sheets’ “Protect sheets and ranges” feature to limit who can view or edit the Salary Analysis page.
Explore Relevant Templates
If you found this dashboard useful, check out these related HR templates on NextGenTemplates:
- Attendance Tracker in Google Sheets — Daily attendance tracking with color-coded status, annual summary, and KPI dashboard
- Employee Shift Schedule in Google Sheets — Weekly and monthly shift planning with employee directory and KPI cards
- HR & Workforce Analytics Bundle — 10 premium HR templates across Excel, Google Sheets & Power BI for $89.99 (save 47%)
Browse all Google Sheets Dashboard Templates or the full HR & Payroll Templates collection.
Frequently Asked Questions
Click here to Purchase the Workforce Analytics Dashboard in Google Sheets
What KPIs does the Workforce Analytics Dashboard track?
The Workforce Analytics Dashboard in Google Sheets tracks 3 KPI cards — Total Training Hours, Average Attendance Score, and Head Count — plus detailed breakdowns of salary, training, performance, and attendance across 4 dimensions each (Department, Location, Job Title, Employee).
Can I customize the departments and job titles?
Yes. The Data Sheet tab is fully editable. Add, rename, or remove departments, locations, and job titles as needed. All charts and analysis pages update automatically based on your data entries.
How does this compare to BambooHR for workforce analytics?
BambooHR charges $6-12 per employee per month and requires weeks of onboarding. This dashboard costs $9.99 one-time, sets up in 10 minutes, and covers salary, training, performance, and attendance analytics — without recurring fees or vendor lock-in.
Does it work on mobile devices?
Yes. The Workforce Analytics Dashboard works on any device with the Google Sheets app — phone, tablet, laptop, or Chromebook. Real-time collaboration is built in, so multiple team members can view or edit simultaneously.
How many employees can this dashboard handle?
Google Sheets supports up to 10 million cells. The dashboard comfortably handles 500-2,000 employee records with no performance issues. For larger datasets, consider the Power BI or Excel versions of our HR dashboards.
Do I need to know Google Sheets formulas?
No. All formulas, charts, and conditional formatting are pre-built. Simply replace the sample data in the Data Sheet tab with your own employee information. The dashboard handles everything else automatically.
About the Author
Built by PK — Microsoft Certified Professional with 15+ years of Excel, Google Sheets, and Power BI experience. Founder of NextGenTemplates, reaching 300K+ subscribers across YouTube channels. Every template is hand-built and tested before release.
Conclusion
The Workforce Analytics Dashboard in Google Sheets delivers salary benchmarking, training hours tracking, performance score analysis, and attendance monitoring across 6 interactive pages — all for a one-time cost of $9.99. With 3 KPI cards, dynamic slicers, 16 analytical views, and real-time collaboration built in, it gives HR managers everything they need to make data-driven workforce decisions without paying for enterprise SaaS tools.
Click here to Purchase the Workforce Analytics Dashboard in Google Sheets
Instant download · One-time payment · No subscription
Visit our YouTube channel for step-by-step tutorials: Youtube.com/@NeoTechNavigators