The coaching industry generates over $20 billion globally, yet most coaching businesses still track revenue and client data in disconnected spreadsheets. The Coaching Business Dashboard in Google Sheets consolidates 4 KPI cards, 8+ analysis charts, and multi-slicer filtering across 6 interactive pages — giving coaching professionals a single view of revenue, sessions, clients, and program performance. With 500 pre-loaded sample records and under 10 minutes to set up, this dashboard replaces hours of manual spreadsheet work with automated visual analytics.
Whether you run a solo executive coaching practice or manage a team of wellness coaches, tracking session revenue by coach, monitoring referral source effectiveness, and analyzing program profitability are essential for growth. The Coaching Business Dashboard in Google Sheets handles all of this in a browser-based, collaborative template that works on any device.
Key Features of Coaching Business Dashboard in Google Sheets
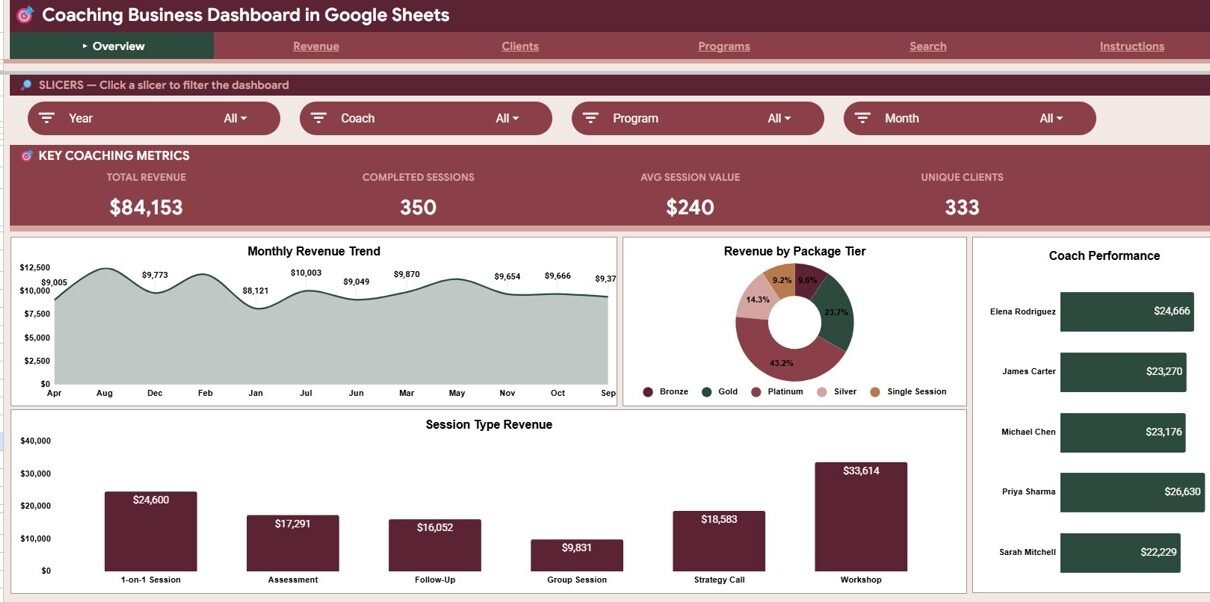
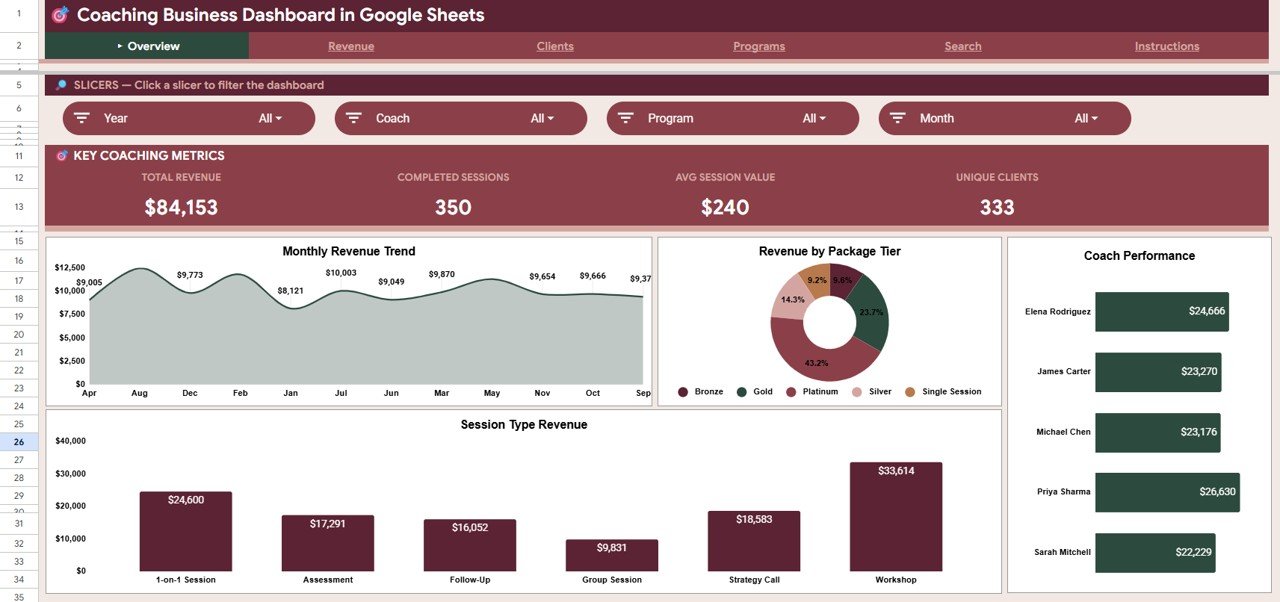
The Coaching Business Dashboard in Google Sheets includes 6 structured pages designed specifically for coaching businesses and consulting practices. The dashboard tracks Total Revenue, Completed Sessions, Average Session Value, and Unique Clients as primary KPI cards on the Overview page.
- 6 Dashboard Pages — Overview, Revenue, Clients, Programs, Search Sheet, and Data Sheet covering every angle of coaching business analytics
- 4 KPI Cards — Total Revenue, Completed Sessions, Avg Session Value, and Unique Clients displayed at the top of the Overview page
- 8+ Analysis Charts — Revenue by Month, Revenue by Package Tier, Revenue by Coach, Revenue by Session Type, Revenue by Payment Method, Revenue by Program, Revenue by Referral Source, Bookings by Referral Source, Sessions by Month, Sessions and Revenue by Coach, and Sessions by Status
- Multi-Slicer Filtering — Native Google Sheets slicers let you filter the entire dashboard by coach, program, date range, package tier, or referral source in one click
- Session Lookup — Dedicated Search Sheet for instant session retrieval by Session ID, displaying all 12 data fields
- 500 Sample Records — Pre-loaded realistic coaching data following real-world patterns for immediate exploration
Dashboard Pages Explanation
📌 Click here to Purchase the Coaching Business Dashboard in Google Sheets
Overview Page
The Overview page serves as the command center for your coaching business analytics. At the top, 4 KPI cards display Total Revenue, Completed Sessions, Average Session Value, and Unique Clients — giving you an instant snapshot of business health. Below the cards, 4 analysis charts break down Revenue by Month (trend tracking), Revenue by Package Tier (pricing analysis), Revenue by Coach (team performance), and Revenue by Session Type (format analysis). Multiple slicers across the top let you filter the entire page by any dimension instantly.
Overview PageRevenue Page
The Revenue page dives deeper into financial performance with 4 focused analyses: Revenue by Month and Package Tier (stacked view showing how different pricing tiers contribute each month), Revenue by Payment Method (cash, credit card, bank transfer distribution), Revenue by Program (comparing income across your coaching programs), and Revenue by Referral Source (identifying which marketing channels generate the most revenue).
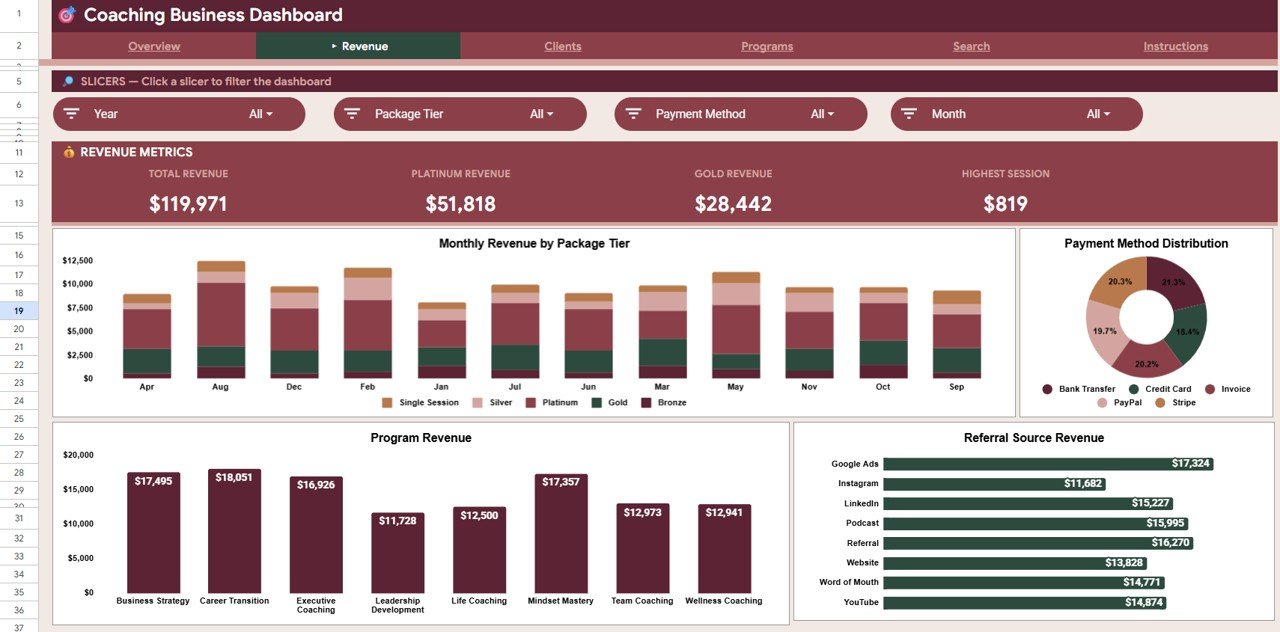 Revenue Page
Clients Page
The Clients page focuses on engagement and scheduling patterns. Bookings by Referral Source shows where your clients come from, Sessions by Month tracks volume trends over time, Sessions and Revenue by Coach compares team member performance side by side, and Sessions by Status (completed, cancelled, no-show, rescheduled) highlights operational efficiency.
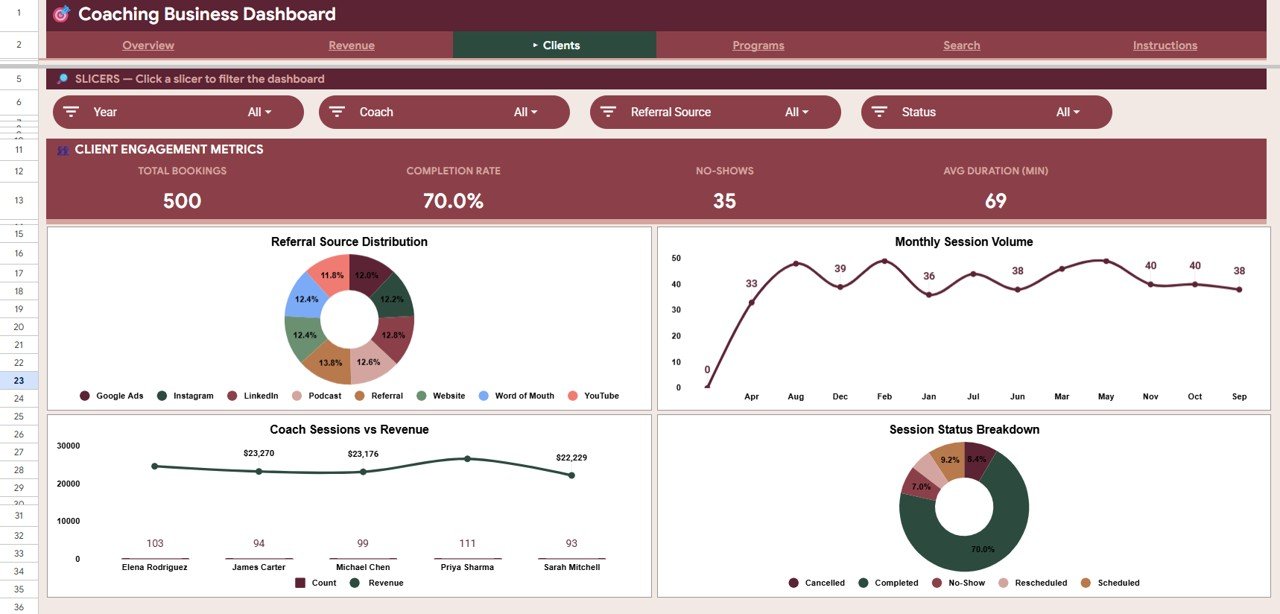 Clients Page
Programs Page
The Programs page evaluates your coaching offerings with Revenue by Program (comparing total income per program) and Revenue and Count by Session Type (showing which session formats — individual, group, workshop, assessment — generate the most revenue and volume). This helps you decide which programs to expand and which to retire.
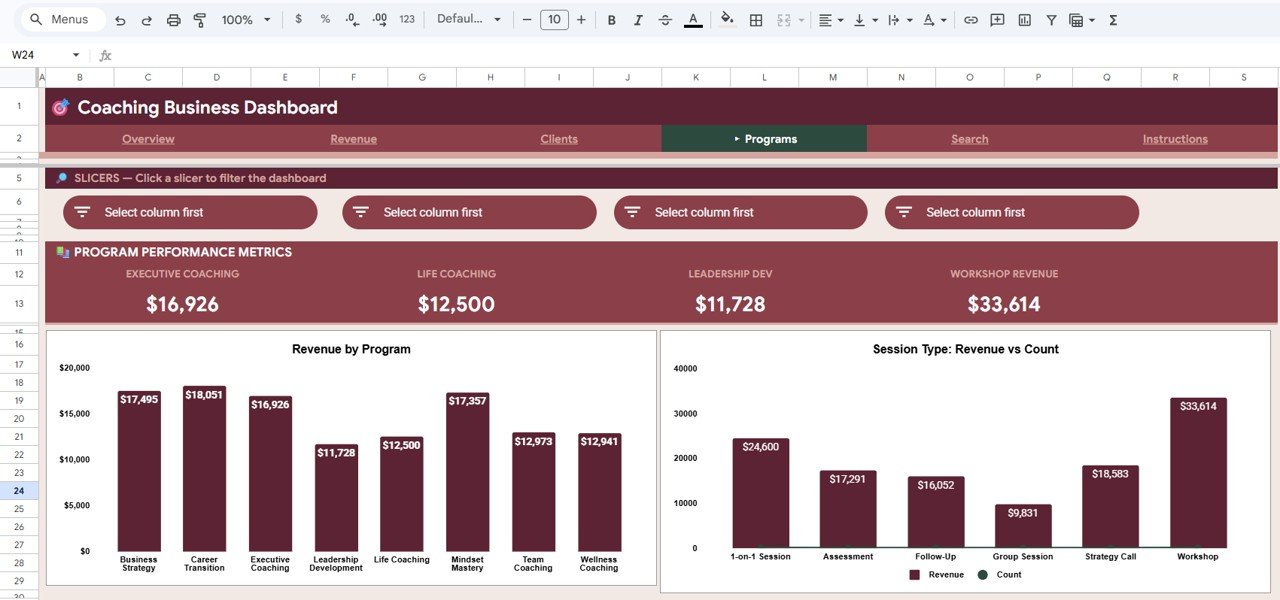 Programs Page
Search Sheet
The Search Sheet provides instant session lookup. Enter any Session ID and the dashboard immediately displays the complete record: date, coach name, client name, program, session type, package tier, revenue, duration, payment method, status, and referral source. This eliminates scrolling through hundreds of data rows to find a specific session.
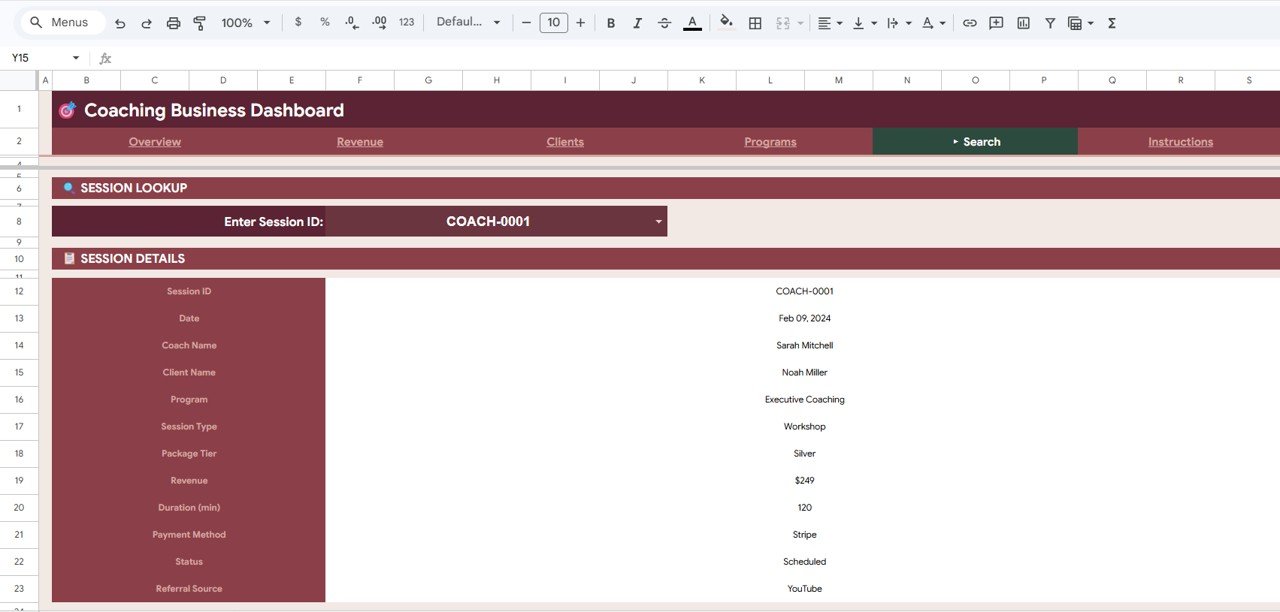 Search Sheet
Data Sheet
The Data Sheet is where all coaching session records are stored. It includes 500 pre-loaded sample rows with realistic coaching business data — varied coach names, client names, programs, session types, package tiers, payment methods, statuses, and referral sources. Replace this sample data with your own records in the same column format, and all dashboard pages update automatically.
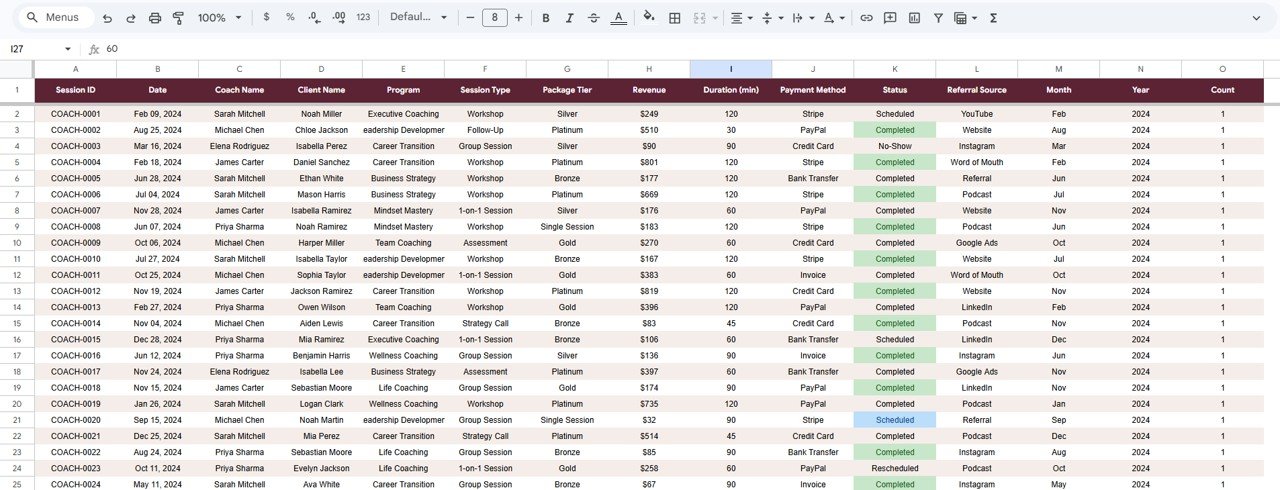 Data Sheet
Coaching Business Dashboard in Google Sheets vs. Microsoft Excel Dashboard vs. CoachAccountable — Feature Comparison
| Feature | Coaching Business Dashboard in Google Sheets | Excel Coaching Dashboard | CoachAccountable |
|---|---|---|---|
| Cost | $9.99 one-time | $15-25 one-time | $20-79/month |
| Platform | Google Sheets (browser-based) | Microsoft Excel (desktop) | Web SaaS |
| Setup Time | Under 10 minutes | 15-30 minutes | 1-2 hours |
| Real-Time Team Collaboration | ✅ Built-in (Google Sheets) | ❌ File sharing only | ✅ Yes |
| Mobile Access | ✅ Google Sheets app | Limited (Excel mobile) | ✅ Yes |
| Customizable Fields | ✅ Fully editable | ✅ Fully editable | Limited to presets |
| Share with Link | ✅ One click | ❌ Requires file send | ✅ Yes |
| Year-1 Cost (5 users) | $9.99 total | $15-25 total | $948-$2,370 |
| Session Lookup by ID | ✅ Dedicated search sheet | Manual filtering | ✅ Yes |
For coaching businesses that want detailed revenue and client analytics without paying $20-79/month for SaaS tools, the Coaching Business Dashboard in Google Sheets sits in the sweet spot.
Who Should Use This Template
✅ Perfect for:
- Solo coaches and coaching firms tracking 10-500 sessions per month across multiple programs
- Life coaches, business coaches, and wellness coaches who need revenue and client analytics in one place
- Coaching teams with 2-10 coaches who want a shared dashboard with real-time Google Sheets collaboration
- Freelance consultants and corporate trainers who bill by session and need financial visibility
❌ Not a fit if:
- You run an enterprise coaching platform with 50+ coaches needing SSO, API integrations, and automated billing — use CoachAccountable or Practice Better
- You need built-in scheduling, client portals, or automated session reminders — this is an analytics dashboard, not a booking system
Real-World Use Cases
📌 Click here to Purchase the Coaching Business Dashboard in Google Sheets
Priya runs a wellness coaching practice with 3 coaches. She uses the Coaching Business Dashboard in Google Sheets to compare monthly revenue by coach, track which referral sources bring the most clients, and present quarterly performance reports to her business partner — all without paying $79/month for CoachAccountable.
David is a solo executive coach billing $250-500 per session. He tracks session completion rates and cancellation patterns, monitors revenue by package tier (Bronze, Silver, Gold), and uses the Search Sheet to quickly pull up session details when clients ask about past meetings.
Megan manages a corporate training firm with 50+ programs. She uses the Programs page to identify which coaching programs generate the highest revenue per session, then reallocates her team’s time accordingly — saving 3 hours per week compared to manual spreadsheet analysis.
Advantages of Coaching Business Dashboard in Google Sheets
- Zero recurring costs — $9.99 one-time payment versus $240-948/year for SaaS alternatives
- Real-time collaboration — Multiple team members can view and edit simultaneously through Google Drive, unlike Excel which requires file sharing
- Browser-based access — Works on any device (desktop, tablet, phone) without installing software
- Full customization — Every formula, chart, slicer, and KPI card is editable, so you can adapt it to any coaching niche
- Instant session lookup — Dedicated Search Sheet eliminates scrolling through hundreds of rows
- Pre-loaded sample data — 500 realistic records let you explore the dashboard before adding your own data
Opportunities for Improvement
- The dashboard does not include built-in scheduling or calendar integration — you will need a separate booking tool like Calendly or Acuity for appointment management
- Google Sheets slicers work well for datasets under 5,000 rows, but performance may slow with very large datasets exceeding 10,000 records
- There is no automated email notification system — session reminders and follow-ups require external tools
- The template does not include client portal functionality — clients cannot self-serve their own session history
Best Practices
📌 Click here to Purchase the Coaching Business Dashboard in Google Sheets
- Update data weekly — Add new coaching sessions to the Data Sheet at least once per week to keep KPI cards and charts current
- Use consistent naming — Keep coach names, program names, and referral source labels consistent across all records for accurate chart aggregation
- Review the Revenue page monthly — Compare month-over-month trends to spot seasonal patterns and adjust pricing or marketing
- Share with view-only access — Give stakeholders (business partners, accountants) view-only access via Google Drive to prevent accidental edits
- Back up quarterly — Download a copy of the Google Sheet as an Excel file every quarter for offline backup
Explore Relevant Templates
📌 Bakery Business Dashboard in Google Sheets — Track revenue, orders, and operations for food businesses with a similar slicer-based Google Sheets layout.
📌 Employee Training KPI Dashboard in Power BI — Monitor training sessions, completion rates, and instructor performance in Power BI.
📌 Browse All Google Sheets Dashboard Templates — 290+ Google Sheets dashboards across every business department.
📌 Staffing Agency Dashboard in Google Sheets — Similar dashboard structure for staffing and recruitment businesses.
📌 Pricing Calculator in Google Sheets — Calculate session pricing and package rates with a dedicated Google Sheets calculator.
Frequently Asked Questions
📌 Click here to Purchase the Coaching Business Dashboard in Google Sheets
What KPIs does the Coaching Business Dashboard in Google Sheets track?
The Coaching Business Dashboard in Google Sheets tracks 4 key performance indicators: Total Revenue, Completed Sessions, Average Session Value, and Unique Clients. All metrics update automatically when you replace the sample data with your own coaching records.
Can multiple coaches use this dashboard at the same time?
Yes. Since it runs in Google Sheets, multiple team members can view and edit the dashboard simultaneously with real-time collaboration. Share the file via Google Drive and set view or edit permissions as needed.
How does this compare to CoachAccountable or Practice Better?
The Coaching Business Dashboard in Google Sheets costs $9.99 one-time versus $20-79/month for SaaS platforms. It focuses on analytics and reporting — if you need built-in scheduling or client portals, a SaaS tool may be a better fit.
How long does setup take?
Setup takes under 10 minutes. Open the copy link from the PDF guide, paste your data into the Data Sheet using the same column format, and all 6 dashboard pages update automatically with your coaching business metrics.
Can I customize the charts and KPI cards?
Yes. Every chart, KPI formula, and slicer in the Coaching Business Dashboard in Google Sheets is fully editable. You can add new metrics, change chart types, modify colors, or add additional analysis pages to match your specific coaching business needs.
Does this template work on mobile devices?
Yes. The Coaching Business Dashboard in Google Sheets works on any device with the Google Sheets app or a mobile browser. Charts and slicers are fully functional on tablets and smartphones for on-the-go coaching business analysis.
What data format do I need to enter?
The Data Sheet includes 500 sample rows showing the exact format: Session ID, Date, Coach Name, Client Name, Program, Session Type, Package Tier, Revenue, Duration, Payment Method, Status, and Referral Source. Match this column structure with your own data.
About the Author
Built by PK — Microsoft Certified Professional with 15+ years of Excel, Google Sheets, and Power BI experience. Founder of NextGenTemplates, reaching 300K+ subscribers across YouTube channels. Every template is hand-built and tested before release.
Conclusion
The Coaching Business Dashboard in Google Sheets gives coaching professionals a complete analytics solution — tracking revenue, sessions, clients, and programs across 6 interactive pages with native slicer filtering and instant session lookup. At $9.99 one-time with no recurring fees, it replaces manual tracking spreadsheets and avoids the $240-948/year cost of SaaS coaching platforms. Whether you are a solo life coach or managing a multi-coach consulting firm, this template provides the financial visibility and client analytics you need to grow your coaching business.
📌 Click here to Purchase the Coaching Business Dashboard in Google Sheets
✅ Instant download · One-time payment · No subscription
For more Google Sheets templates and tutorials, visit our YouTube channel:
👉 Youtube.com/@NeoTechNavigators
For additional resources on building dashboards in Google Sheets, see Google’s official guide to Slicers in Google Sheets.