Bakery businesses generate thousands of orders monthly across multiple sales channels. Without centralized analytics, bakery owners spend hours manually compiling revenue, profit, and cost data from separate spreadsheets. The Bakery Business Dashboard in Google Sheets solves this by consolidating 4 KPI cards, 16 analysis charts, and multi-slicer filtering across 6 interactive pages. Setup takes under 10 minutes.
In this detailed guide, you will learn everything about the Bakery Business Dashboard in Google Sheets including its structure, features, analysis capabilities, advantages, real-world use cases, and how it compares to paid alternatives.
What Is a Bakery Business Dashboard in Google Sheets?
A Bakery Business Dashboard in Google Sheets is an interactive analytics template that tracks bakery sales, profit, orders, product performance, and operational costs using pivot tables, charts, slicers, and formula-driven KPI cards.
Unlike traditional spreadsheets, this dashboard auto-updates all 6 pages when data changes. The slicer-based filtering system provides instant analysis across date range, product category, sales channel, and payment method.
Key Features of Bakery Business Dashboard in Google Sheets
Click here to Purchase Bakery Business Dashboard in Google Sheets
The dashboard includes 6 structured pages with 4 KPI cards and 16 analysis charts. The Overview page provides Total Revenue, Total Profit, Total Orders, and Average Order Value as KPI cards with charts showing Monthly Revenue vs Cost, Revenue by Sales Channel, Revenue by Product Category, and Profit by Category and Channel.
The Sales Analysis page tracks Monthly Revenue Trend, Revenue by Payment Method, Channel Revenue vs Profit, and Monthly Revenue by Channel. The Products Analysis page displays Top Products by Revenue, Category Quantity and Revenue, Products by Quantity Sold, and Monthly Revenue by Category. The Operations page monitors Monthly Profit Trend, Cost Distribution by Category, Order Status Distribution, and Revenue vs Cost vs Profit.
Interactive slicers let you filter the entire dashboard by date, category, channel, and payment method instantly. For KPI scorecard-style tracking, see Bakery KPI Dashboard in Google Sheets.
Dashboard Pages Explanation
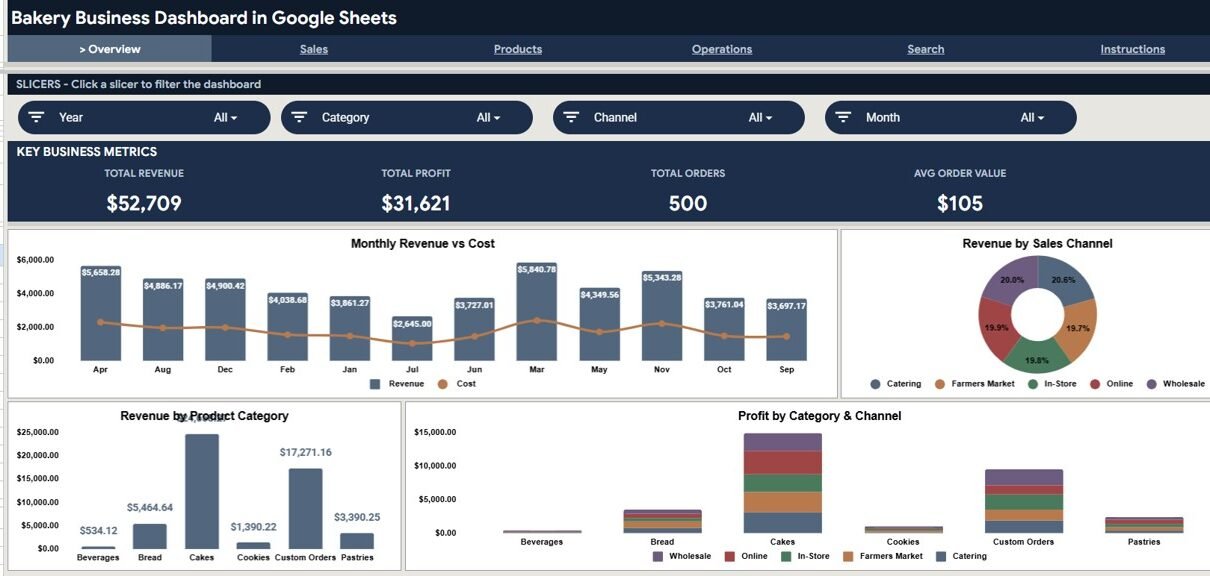
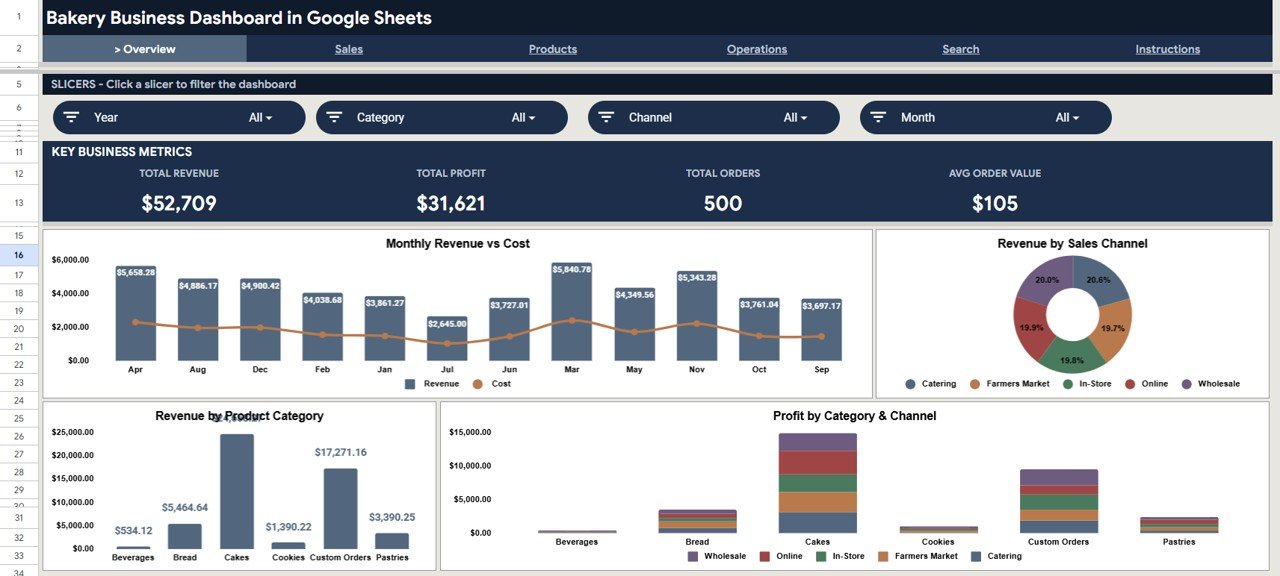
1. Overview Page
The Overview page displays 4 KPI cards (Total Revenue, Total Profit, Total Orders, Avg Order Value) with 4 analysis charts and multiple slicers for instant filtering. The Monthly Revenue vs Cost chart helps spot months where costs outpace revenue growth. The Revenue by Sales Channel chart compares in-store, online, and wholesale performance.
Overview Page2. Sales Analysis Page
Monthly Revenue Trend, Revenue by Payment Method, Channel Revenue vs Profit, and Monthly Revenue by Channel. This page helps identify which channels deliver the highest margins.
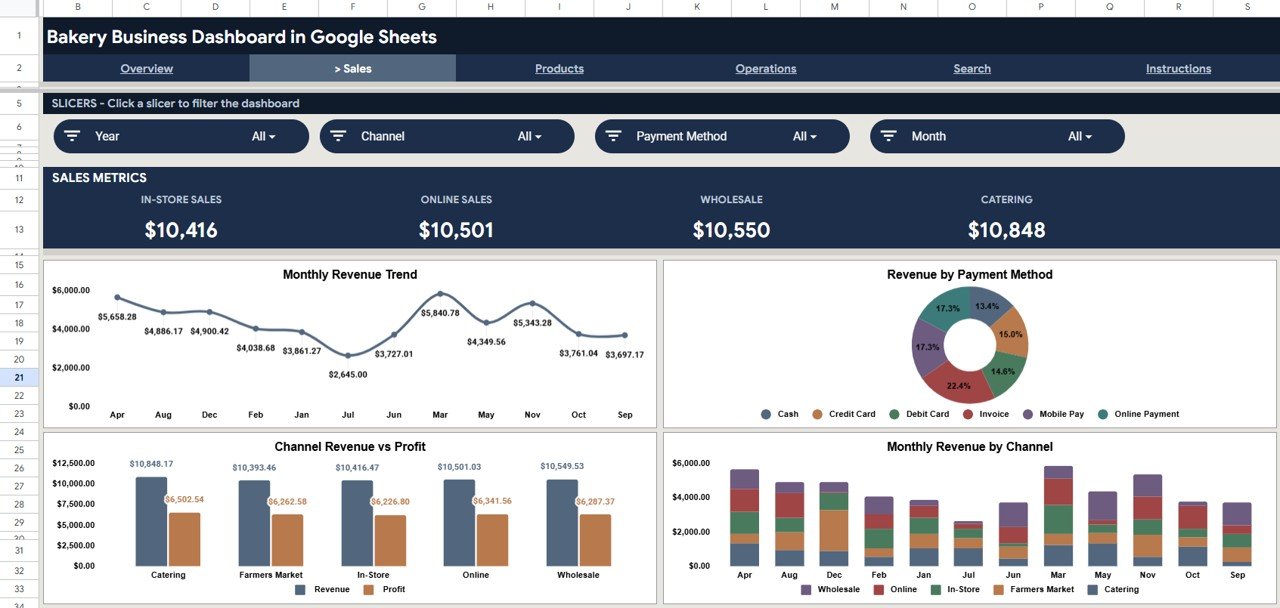 Sales Analysis Page
3. Products Analysis Page
Top Products by Revenue, Category Quantity and Revenue, Products by Quantity Sold, Monthly Revenue by Category. Reveals which bakery items sell the most. Similar capabilities in the Grocery Store KPI Dashboard.
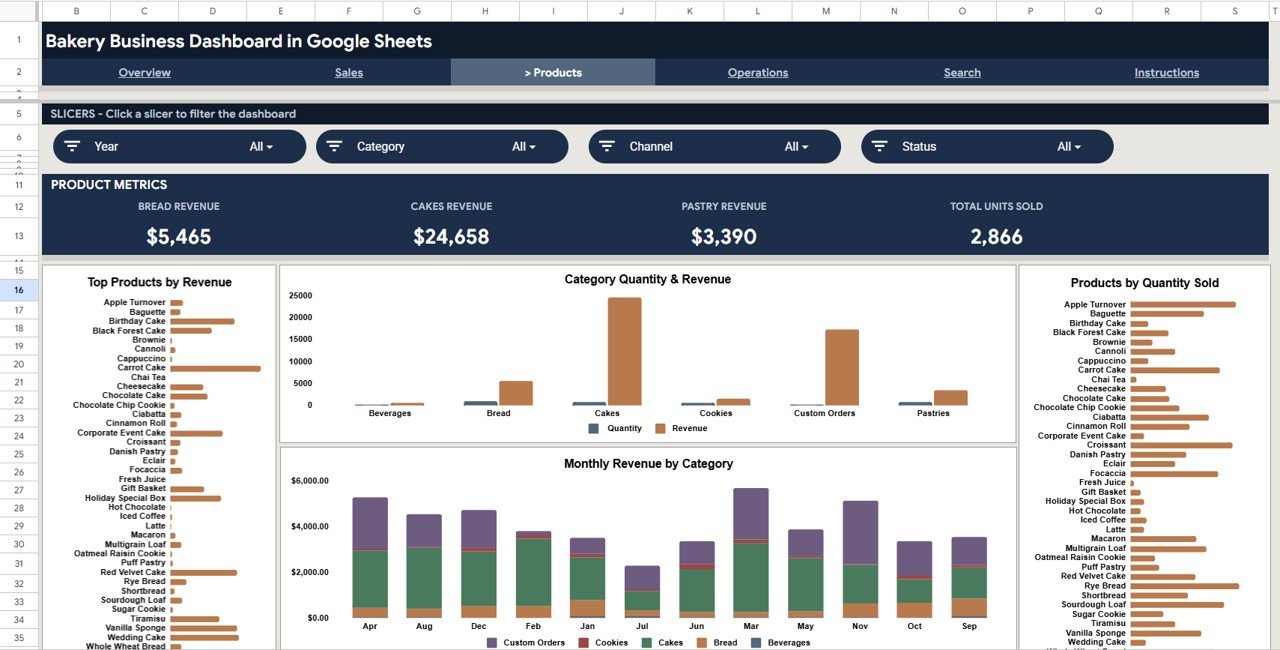 Products Analysis Page
Click here to Purchase Bakery Business Dashboard in Google Sheets
4. Operations Page
Monthly Profit Trend, Cost Distribution by Category, Order Status Distribution, Revenue vs Cost vs Profit. Provides visibility into where costs accumulate and how profit margins trend.
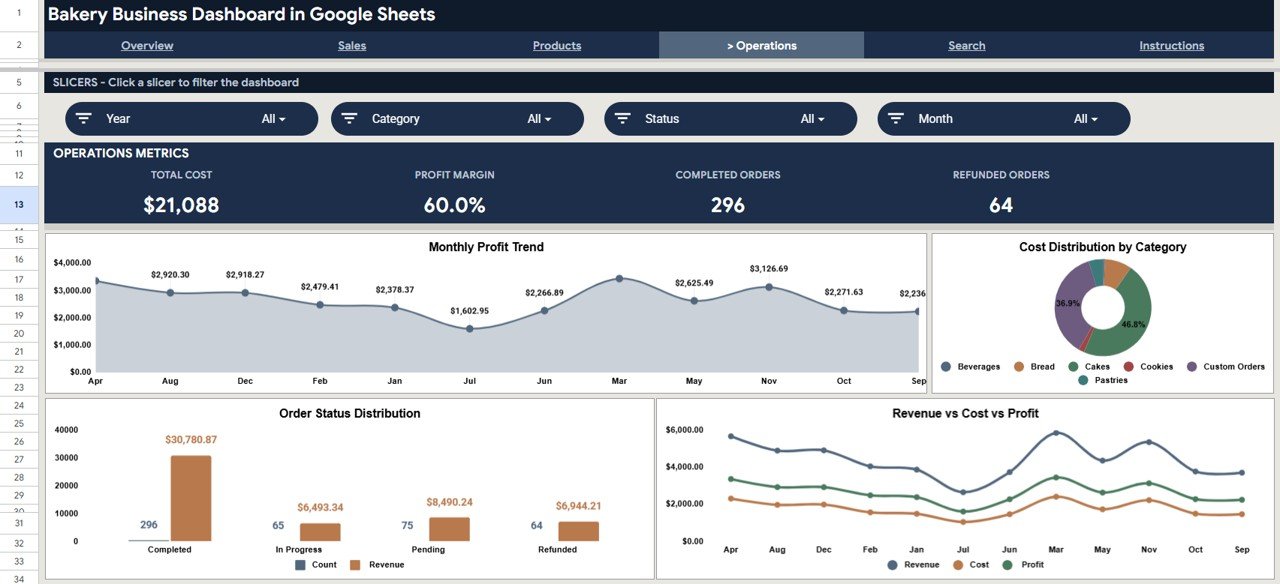 Operations Page
5. Search Sheet
Select any Order ID from the dropdown to instantly view all order details including date, category, product, channel, customer, quantity, unit price, revenue, cost, profit, and payment method.
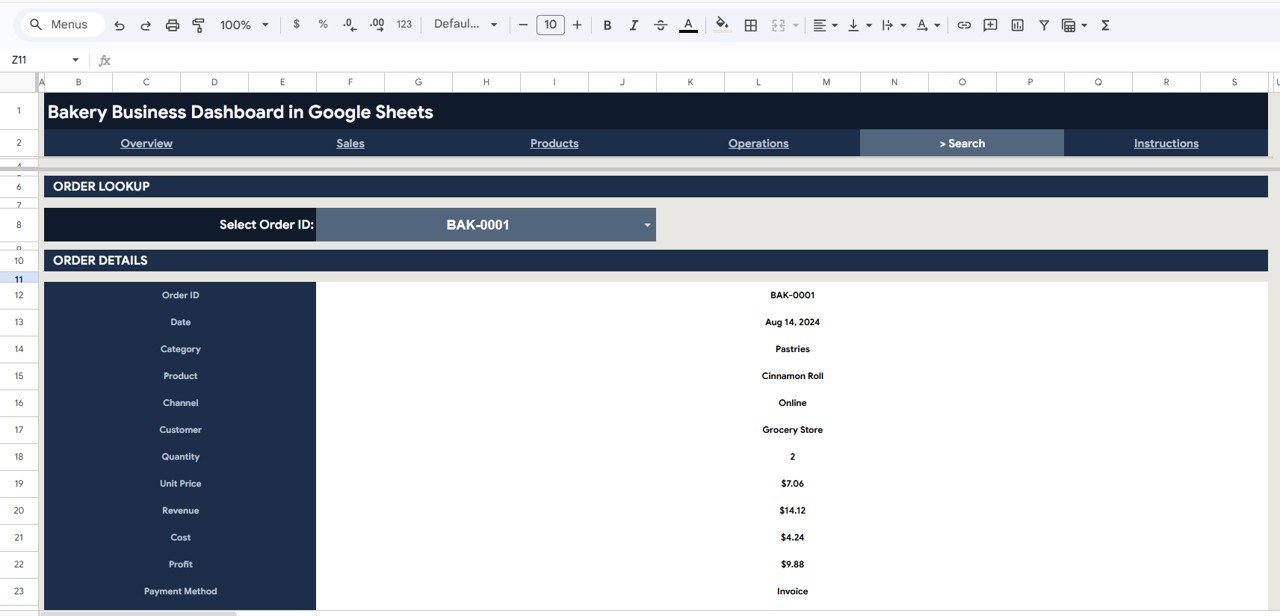 Search Sheet
6. Data Sheet
Enter bakery order data in the structured format. Replace the 500-row sample dataset with your own records and every page updates automatically.
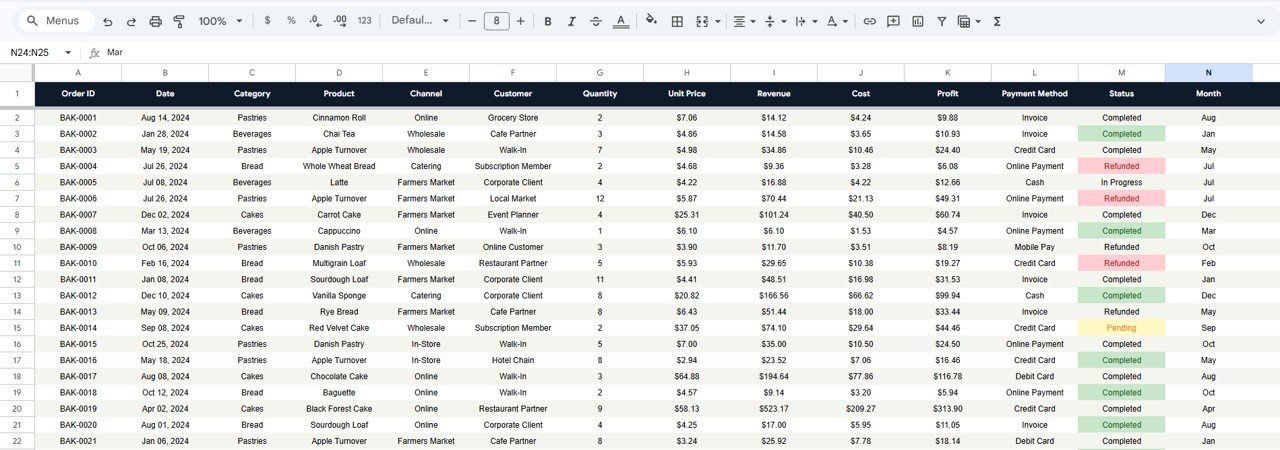 Data Sheet
Bakery Business Dashboard vs. Microsoft Excel Dashboard vs. Toast POS Analytics
| Feature | Bakery Business Dashboard | Excel Dashboard | Toast POS Analytics |
|---|---|---|---|
| Cost | $9.99 one-time | $14.99+ | $69-165/month |
| Platform | Google Sheets (free) | Excel (license) | Proprietary |
| Setup time | Under 10 min | 10-15 min | 1-2 weeks |
| Collaboration | Real-time | OneDrive needed | Yes |
| Mobile access | Yes | Limited | Yes |
| Year-1 at 5 users | $9.99 | $14.99+licenses | $828-1,980+ |
For bakeries wanting analytics without $69-165/month, this dashboard sits in the sweet spot.
Who Should Use This Template
Perfect for: Bakery owners running 1-10 locations, food business operators analyzing revenue by channel and category, small bakery startups tracking orders and margins.
Not a fit if: Enterprise chains needing real-time POS integration with 50+ locations, or businesses requiring automated barcode inventory management.
Real-World Use Cases
Maria runs a neighborhood bakery with 2 locations and an online store. She compares revenue across channels and adjusts production to reduce waste on low-demand items.
James manages operations for an artisan bread company. He tracks cost distribution by category and monitors profit trends for quarterly reviews.
Priya launched a home bakery selling through Instagram. She tracks average order value, best-selling products, and total profit replacing her notebook.
Advantages of Bakery Business Dashboard in Google Sheets
Real-time cloud collaboration for multiple team members. Auto-updating charts across 6 pages. Slicer filtering across date, category, channel, and payment method. At $9.99 vs $69-165/month for Toast POS, it delivers 95%+ cost savings. Fully customizable categories, channels, and layouts. According to Google Sheets documentation, Sheets supports up to 100 concurrent editors.
Opportunities for Improvement
No automated POS data import — manual export and paste required. No ingredient-level inventory tracking. No employee performance metrics built in. Future versions could integrate Google Apps Script for CSV auto-import.
Best Practices
Update data weekly or daily for accuracy. Use slicers during team meetings. Compare month-over-month trends for seasonal patterns. Review Operations page monthly to catch rising costs. Share with view-only access for staff and edit access for managers.
Explore Relevant Templates
Bakery Business Dashboard in Google Sheets | Bakery KPI Dashboard in Google Sheets | Bakery KPI Dashboard in Excel | Craft Brewery KPI Dashboard | Food and Beverage Report in Excel
Also see Craft Brewery KPI Dashboard guide.
Frequently Asked Questions
Click here to Purchase Bakery Business Dashboard in Google Sheets
What KPIs does the Bakery Business Dashboard track?
The Bakery Business Dashboard tracks Total Revenue, Total Profit, Total Orders, and Average Order Value with 16 analysis charts covering revenue by channel, category, product, and payment method across 4 dedicated pages.
Can I customize product categories?
Yes. Categories come from the Data Sheet. Add, rename, or remove categories and all charts and slicers update automatically without formula changes.
How does this compare to Toast POS?
Toast POS costs $69-165/month per location. This dashboard costs $9.99 one-time with no recurring fees and full data customization in Google Sheets.
Does it work on mobile?
Yes. Runs in Google Sheets on any device with the Google Sheets app installed.
How long does setup take?
Under 10 minutes. Open the PDF guide, click the copy link, replace sample data, and the dashboard updates instantly.
Can multiple people access it simultaneously?
Yes. Google Sheets supports real-time collaboration from any location.
Is coding required?
No. Uses native Google Sheets features — pivot tables, charts, slicers, and formulas.
About the Author
Built by PK — Microsoft Certified Professional with 15+ years of Excel, Google Sheets, and Power BI experience. Founder of NextGenTemplates, reaching 300K+ subscribers across YouTube channels. Every template is hand-built and tested before release.
Conclusion
The Bakery Business Dashboard in Google Sheets provides a complete analytics solution tracking revenue, profit, orders, product performance, and costs across 6 interactive pages. At $9.99 one-time, it replaces tools costing $69-165/month.
Click here to Purchase Bakery Business Dashboard in Google Sheets
Instant download. One-time payment. No subscription.
Visit our YouTube channel for tutorials: Youtube.com/@NeoTechNavigators