In this article we have created Product Reviews and Ratings KPI Dashboard in Google Sheets. This is a ready to use template in Google Sheets for tracking product reviews, ratings, customer feedback KPIs, targets, and previous year performance in one structured reporting file.
Product review data can quickly become scattered across ecommerce platforms, customer support exports, marketplaces, and manual trackers. This dashboard gives you a 6 worksheet reporting system with month selection, MTD and YTD views, Actual vs Target comparison, Previous Year comparison, KPI trend charts, and editable KPI definitions. It is built for teams that want a practical review analytics dashboard without setting up a paid analytics platform or building formulas from a blank spreadsheetProduct Reviews and Ratings KPI Dashboard in Google Sheets.
Get the template: Product Reviews and Ratings KPI Dashboard in Google Sheets
Why Product Reviews and Ratings KPIs Matter
Reviews are one of the clearest signals of product quality, customer satisfaction, and buying confidence. A product can have traffic and impressions, but weak ratings, rising negative reviews, or delayed response patterns can reduce conversion and damage brand trust. A good KPI dashboard helps you move from reading individual comments to managing the full review performance picture.
This Google Sheets KPI dashboard is designed for monthly performance review. It lets you compare Actual values against Target values and Previous Year values, so your team can quickly see whether customer perception is improving, declining, or staying flat. Because it is built in Google Sheets, the file can be copied, edited, shared, and updated by the people who already work with your product or customer feedback data. You can also reference Google’s own Google Sheets help documentation when sharing or collaborating inside Sheets.Product Reviews and Ratings KPI Dashboard in Google Sheets
Below are the Key Features of this KPI Dashboard
Product Reviews and Ratings KPI Dashboard in Google Sheets.
- 6 worksheet structure: Dashboard, KPI Trend, Actual Numbers Input, Target Number Input, Previous Year Number, and KPI Definition.Product Reviews and Ratings KPI Dashboard in Google Sheets
- Dashboard month selector: Select the month from the drop-down in range D3 and update the full dashboard view.Product Reviews and Ratings KPI Dashboard in Google Sheets
- MTD and YTD performance tracking: Track both month-to-date and year-to-date numbers for every KPI.Product Reviews and Ratings KPI Dashboard in Google Sheets
- Actual, Target, and Previous Year comparison: See current performance against the planned target and prior year baseline.Product Reviews and Ratings KPI Dashboard in Google Sheets
- Conditional formatting arrows: Quickly identify positive or negative movement for Target vs Actual and PY vs Actual.Product Reviews and Ratings KPI Dashboard in Google Sheets
- KPI trend charts: Review MTD and YTD trend charts for Actual, Target, and Previous Year values.
- Editable KPI definitions: Maintain KPI name, group, unit, formula, definition, and KPI type.
- UTB and LTB logic: Mark KPIs as Upper the Better or Lower the Better so performance direction is clear.
- Google Sheets format: Work online, collaborate with your team, and avoid macros or special software.
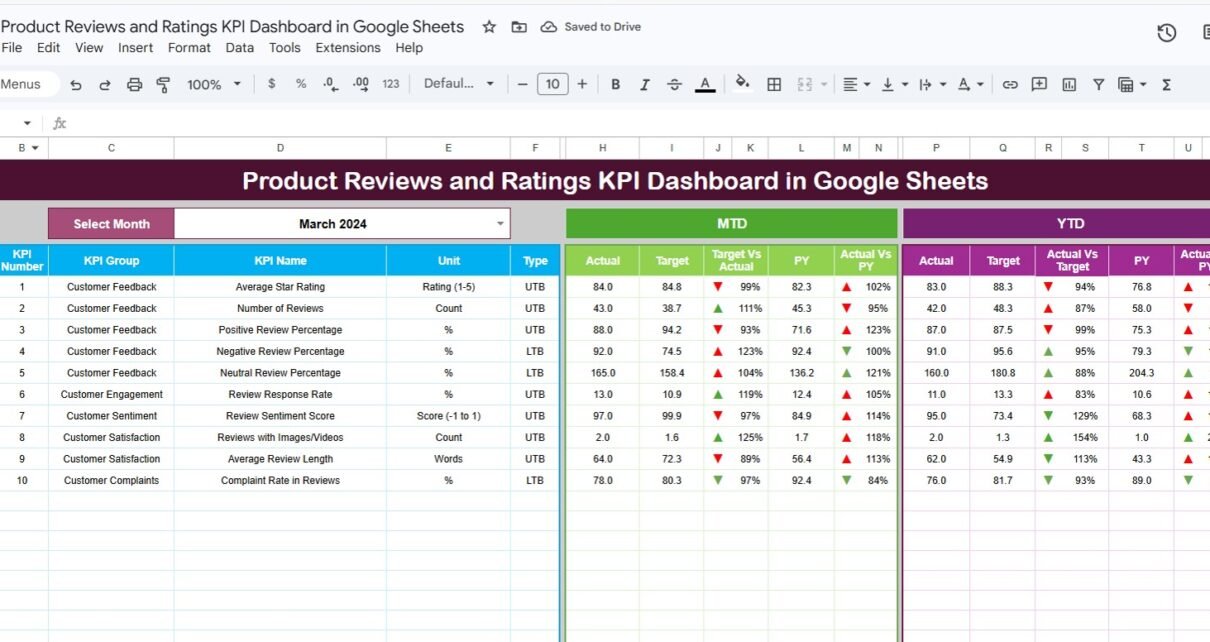
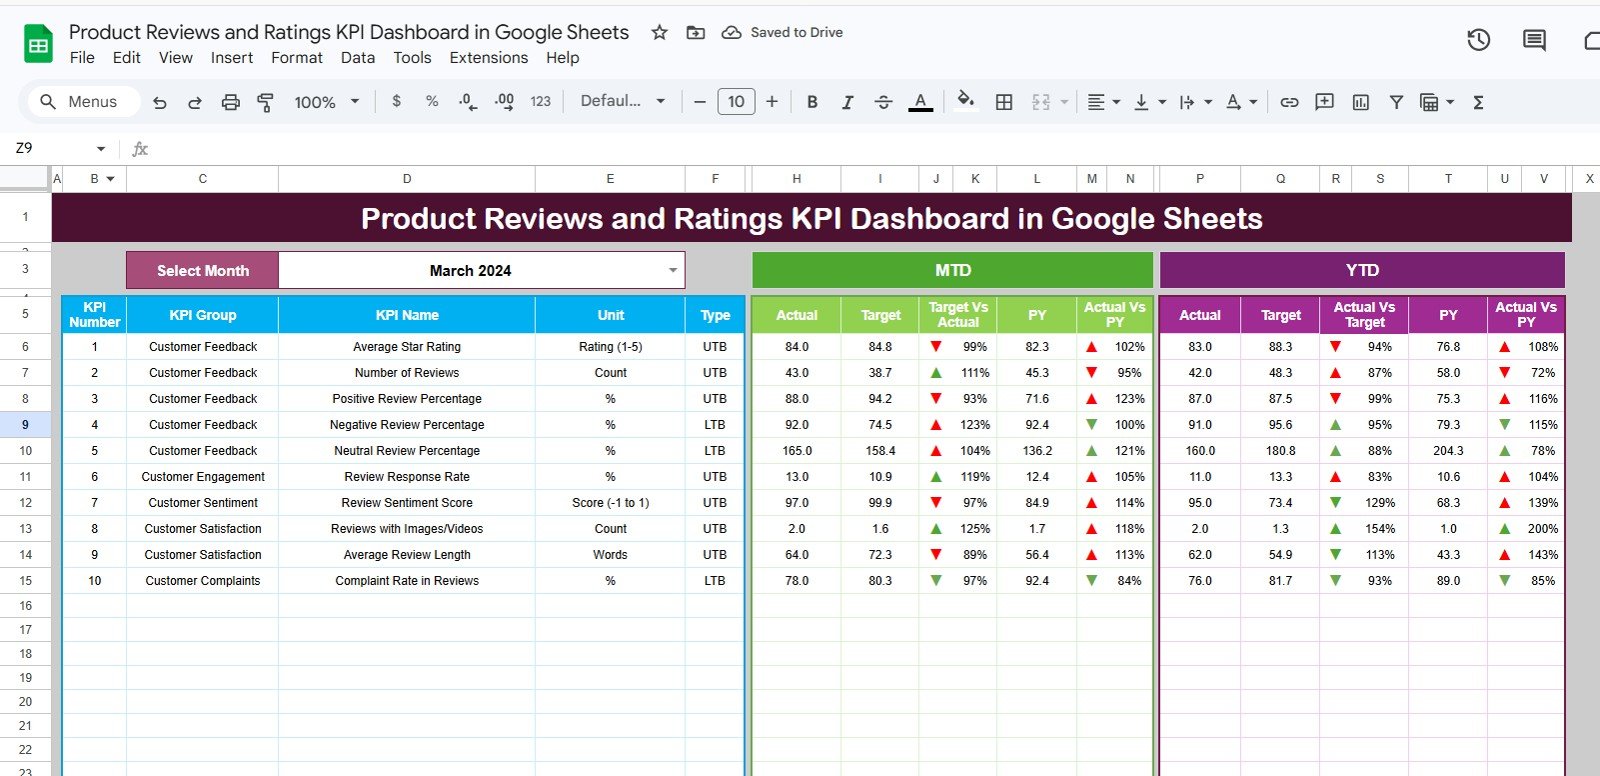
1. Dashboard Sheet Tab
This is the main sheet tab. Here, we are showing all information about all of the KPIs. On range D3, you can select the Month from the drop-down. Whole dashboard numbers will be changed for that month.
Here, we are showing the MTD Actual, Target, Previous Year data along with the Target Vs Actual and PY vs Actual with Conditional formatting up down arrow. We are also showing YTD Actual, Target, Previous Year data along with the Target Vs Actual and PY vs Actual with Conditional formatting up down arrow.
The Dashboard sheet is useful for leadership reviews, weekly team meetings, monthly product scorecards, and customer experience reporting. You can use it to identify which review metrics are ahead of target, which metrics are behind, and which KPIs need deeper analysis on the trend sheet.
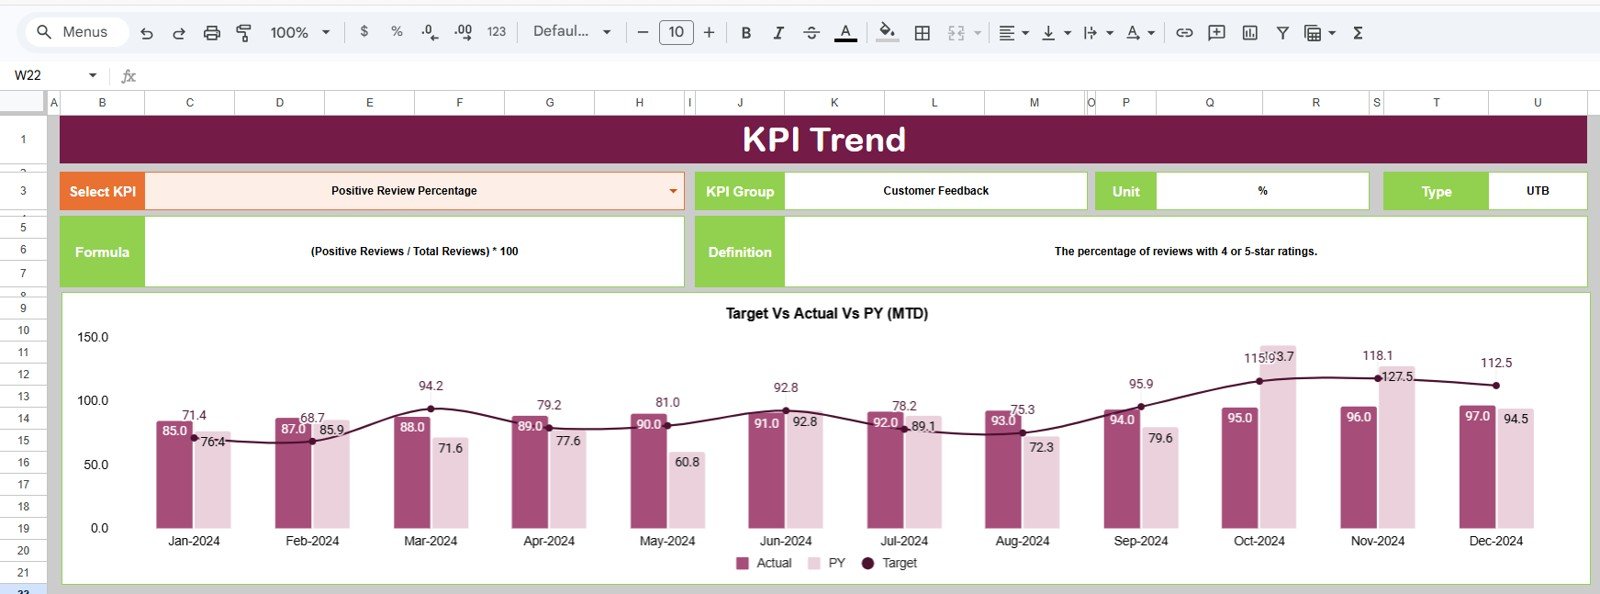
2. KPI Trend Sheet Tab
Product Reviews and Ratings KPI Dashboard in Google Sheets.
Here you can select the KPI name from the drop down available on range C3. We have displayed the KPI Group, Unit of KPI, Type of KPI, Formula of the KPI and Definition of the KPI.
We are also showing the MTD and YTD trend chart for Actual, Target and PY numbers. This sheet is helpful when one KPI needs more explanation than the dashboard summary can provide. For example, if average rating is below target, the KPI Trend sheet can show whether the issue is recent, seasonal, or part of a longer decline.
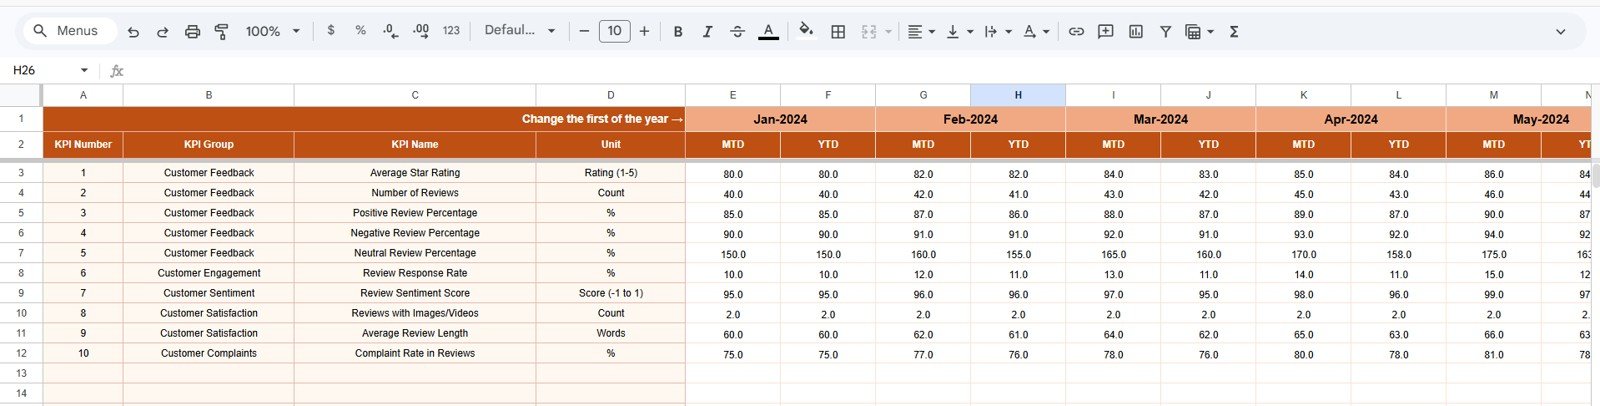
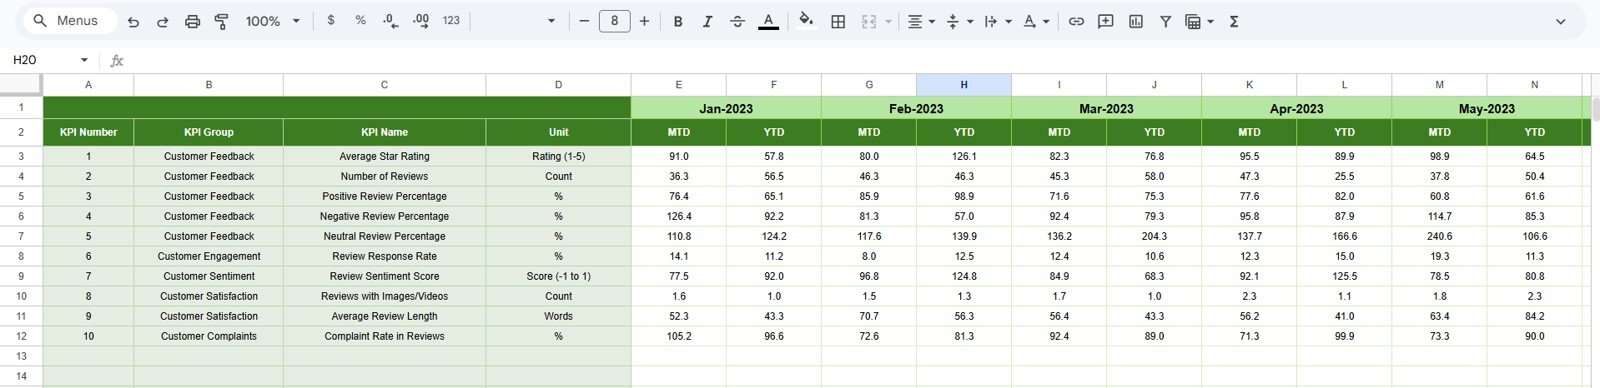
3. Actual Numbers Input Sheet
Product Reviews and Ratings KPI Dashboard in Google Sheets.
Here you have to enter the actual numbers for YTD and MTD for a particular month. You can change the months from range E1. Just input the first month of the Year on range E1.
This sheet is where your monthly product review and rating performance data is maintained. You can enter actual values for KPIs such as review count, average rating, negative review rate, positive review rate, complaint share, resolved feedback, response time, or any custom metric your team tracks.
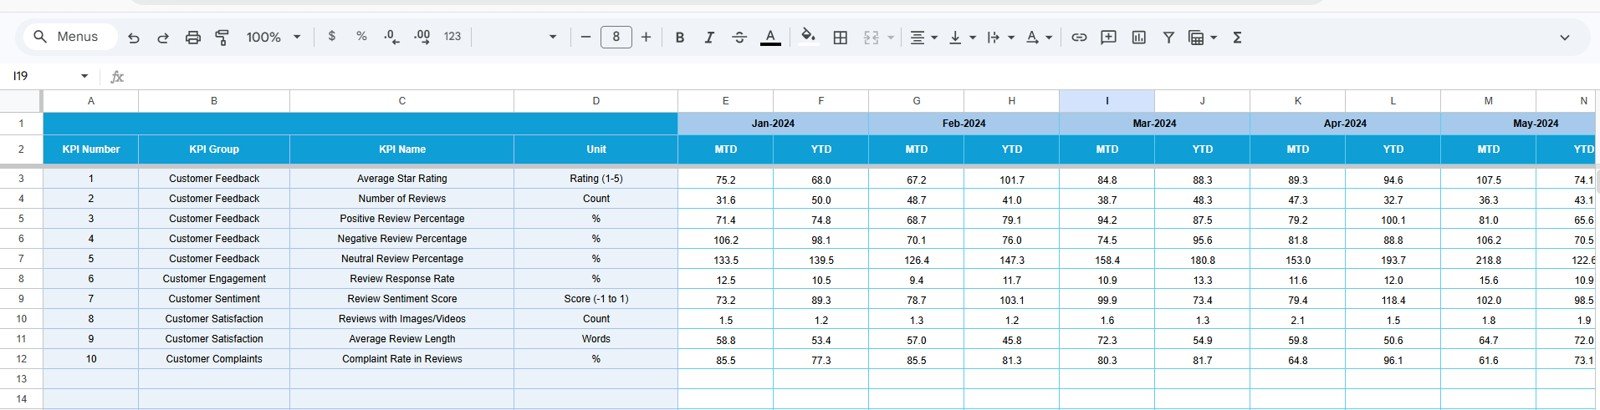
4. Target Number Input Sheet
In this sheet tab, you have to enter the Target numbers for each KPI for the particular month as MTD as well as YTD.
Targets help make the dashboard actionable. Without targets, review reporting can become descriptive only. With targets, your team can immediately see whether product quality, service recovery, or customer satisfaction goals are being met. This is especially useful for ecommerce brands, product teams, marketplace sellers, and customer experience managers who need a consistent performance benchmark.
5. Previous Year Number Sheet Tab
Product Reviews and Ratings KPI Dashboard in Google Sheets.
Enter the here the numbers for the previous year same as you have entered for the current year.
Previous Year comparison is important because reviews and ratings can change because of seasonality, product launches, pricing changes, campaign pushes, or support volume. By entering last year’s numbers, you can compare current performance with a more meaningful historical baseline instead of looking only at this month’s results in isolation.
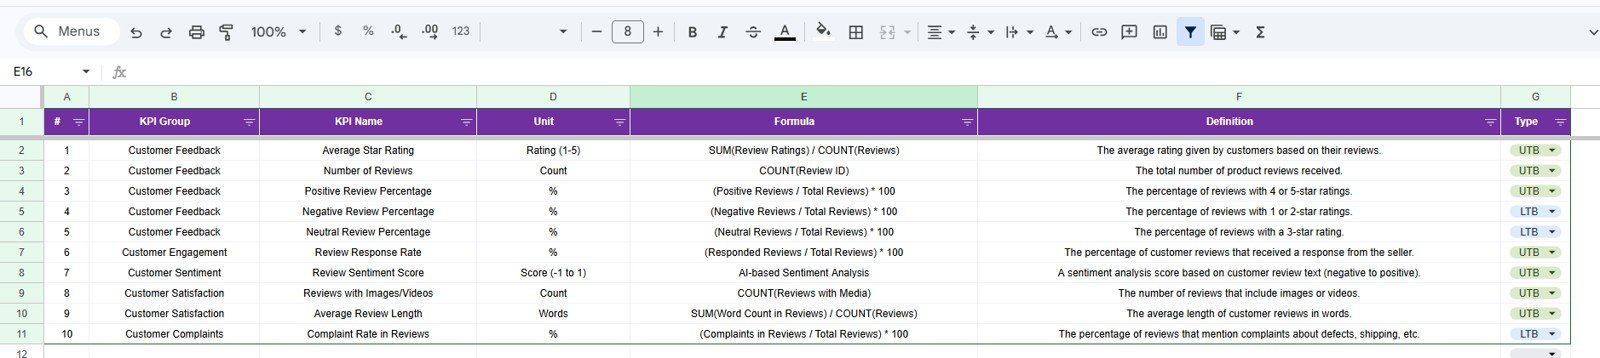
6. KPI Definition Sheet Tab
In this sheet tab, you have to enter the KPI Name, KPI Group, Unit, Formula and KPI definition. In the last column Enter the KPI type as LTB (Lower the better) or UTB (Upper the Better).
This sheet keeps your dashboard clean and easy to understand. It also reduces confusion when multiple people work with the file. Every KPI has a name, group, unit, formula, definition, and direction. If a lower value is better, such as complaint rate or negative review percentage, use LTB. If a higher value is better, such as average rating or positive review rate, use UTB.
Example KPIs You Can Track
- Average Product Rating
- Total Reviews Received
- Positive Review Percentage
- Negative Review Percentage
- Review Response Time
- Resolved Review Issues
- Verified Purchase Review Share
- Low Rating Product Count
- Review Volume Growth
- Customer Satisfaction Score
Who Should Use this Dashboard?
Product Reviews and Ratings KPI Dashboard in Google Sheets.
This dashboard is useful for ecommerce managers, Amazon and marketplace sellers, product managers, customer service leaders, CX analysts, founders, and operations teams. If you need to monitor product ratings and review-related KPIs every month, this template gives you a ready structure to work from.
It is also useful for agencies and consultants who report product feedback performance to clients. Instead of creating a new scorecard for every client, you can start from this dashboard and customize the KPI Definition sheet according to the client’s business model.
Product Reviews and Ratings KPI Dashboard vs Excel Dashboard vs Paid SaaS
| Option | Best For | Consideration |
|---|---|---|
| Google Sheets KPI Dashboard | Shared reporting, fast setup, online collaboration, and low-cost KPI tracking | Best when you can enter or paste KPI values manually |
| Excel Dashboard | Offline reporting, desktop analysis, and advanced workbook workflows | Collaboration may require OneDrive or file sharing discipline |
| Paid CX or Review SaaS | Automated integrations, enterprise workflows, and live review management | Usually higher cost and more implementation effort |
How to Use the Template
- Open the template and create your own editable copy in Google Drive.
- Go to the KPI Definition sheet and update KPI names, groups, units, formulas, definitions, and KPI type.
- Enter actual monthly values in the Actual Numbers Input sheet.
- Enter monthly and YTD target values in the Target Number Input sheet.
- Enter previous year values in the Previous Year Number sheet tab.
- Select the reporting month from the Dashboard sheet range D3.
- Use the KPI Trend sheet to investigate individual KPI movement.
- Share the dashboard with your team for review meetings and performance tracking.
Real-World Use Cases
Product Reviews and Ratings KPI Dashboard in Google Sheets.
- Monthly product review meeting: Review MTD and YTD review performance with product, support, and operations teams.
- Marketplace seller scorecard: Track product rating quality and identify SKUs that need attention.
- Customer feedback improvement plan: Monitor whether corrective actions are improving rating and review KPIs.
- Product launch tracking: Compare early review performance against monthly targets and previous benchmarks.
- Executive summary reporting: Present a clean dashboard instead of raw review exports.
Related Templates and Articles
- Ecommerce Conversion Rate KPI Dashboard in Google Sheets
- Customer Satisfaction Improvement KPI Dashboard in Google Sheets
- Mobile App Performance KPI Scorecard in Google Sheets
- Product Reviews and Ratings KPI Dashboard in Excel
- Product Reviews and Ratings KPI Dashboard in Power BI
Frequently Asked Questions
Is this dashboard ready to use?
Yes. It is a ready-to-use Google Sheets template. You can copy it to your Google Drive and start entering KPI data.
Can I change the KPI names?
Yes. You can update KPI names, groups, units, formulas, definitions, and KPI type from the KPI Definition sheet.
Does this dashboard include MTD and YTD views?
Yes. The dashboard includes MTD and YTD Actual, Target, and Previous Year views.
Can I compare actual results with targets?
Yes. Target vs Actual comparison is included for both MTD and YTD values.
Can I compare performance with previous year?
Yes. The Previous Year Number sheet lets you enter prior year data for comparison.
Do I need any add-on or script?
No. The template is designed to work in Google Sheets without special add-ons.
About the Author
This dashboard is created by PK AnExcelExpert, founder of NextGenTemplates.com. He creates practical Excel, Google Sheets, Power BI, and dashboard templates for business reporting, KPI tracking, and operational performance management.
Final Thoughts
The Product Reviews and Ratings KPI Dashboard in Google Sheets helps you turn review data into a structured monthly performance system. Instead of only reading customer comments one by one, you can track review KPIs, compare targets, review previous year performance, and explain trends through a clean dashboard.
You can purchase the ready-to-use template here: Product Reviews and Ratings KPI Dashboard in Google Sheets.
For more dashboard tutorials and Google Sheets templates, visit NeoTechNavigators on YouTube.
Last updated: May 2026