In today’s fast-paced financial environment, companies must stay on top of their performance by continuously monitoring key metrics. The most effective way to manage these metrics is through a Finance KPI Dashboard. In this article, we’ll explore how a Finance KPI Dashboard in Google Sheets can streamline financial tracking, making it easier for businesses to assess their financial health. This guide will cover everything from the key features of the dashboard to the essential KPIs and best practices for maintaining a robust finance tracking system.
What is a Finance KPI Dashboard?
A Finance KPI Dashboard is a powerful tool that provides a comprehensive view of a company’s financial performance. By centralizing key financial metrics, such as revenue, profit margins, and expenses, it enables financial managers to make data-driven decisions. Google Sheets, being a free and easily accessible tool, offers a cost-effective solution for building and maintaining a finance dashboard.
This template allows you to track your financial goals, compare actual performance with targets, and analyze trends over time. Using Google Sheets ensures that multiple team members can access and update the dashboard in real-time, providing an effective collaboration environment for financial planning and reporting.
Click to buy Finance KPI Dashboard in Google Sheets
Key Features of the Finance KPI Dashboard in Google Sheets
The Finance KPI Dashboard in Google Sheets consists of six main worksheets, each with specific functions to support efficient tracking of financial performance. Let’s dive deeper into the features of each sheet:
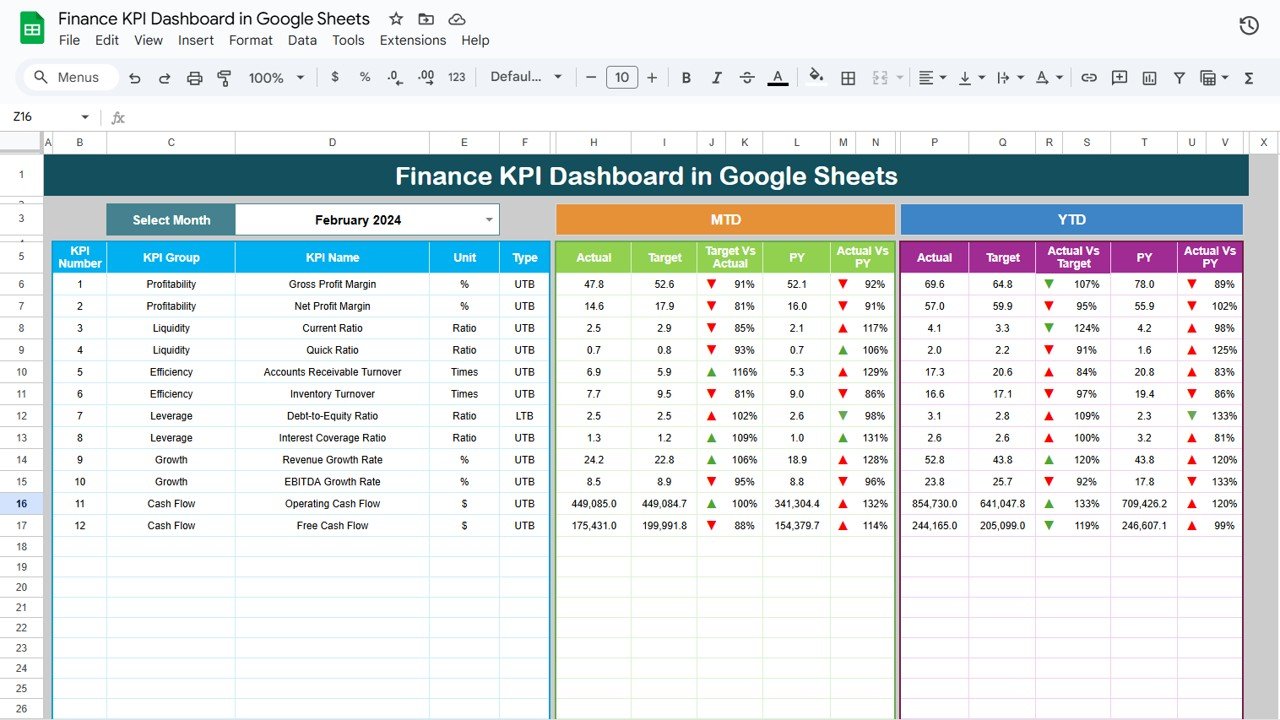
Dashboard Sheet Tab
The Dashboard Sheet is the primary workspace where all the essential information is displayed. In this tab, users can view Month-to-Date (MTD) and Year-to-Date (YTD) actual values alongside targets and previous year comparisons. The dashboard is interactive; users can select the month from a drop-down menu, and all financial data will update accordingly. The use of conditional formatting with up and down arrows makes it easier to interpret performance at a glance.
Click to buy Finance KPI Dashboard in Google Sheets
KPI Trend Sheet Tab
This sheet allows users to select a specific KPI from a drop-down list. Once selected, it shows the KPI Group, Unit of Measurement, KPI Type (whether a lower or upper value is better), Formula, and Definition. This sheet helps to provide more context around each KPI, making it easier to understand and track progress over time.

Click to buy Finance KPI Dashboard in Google Sheets
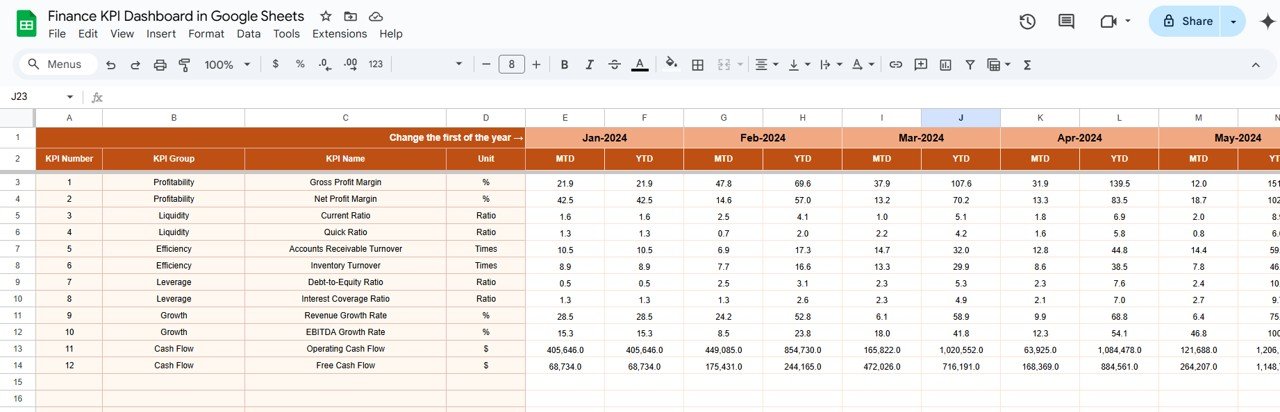
Actual Number Sheet Tab
In this tab, you enter the actual numbers for both MTD and YTD for any given month. The month can be selected via a drop-down menu, and all KPI values will update automatically based on the selected month. This sheet is crucial for ensuring that the dashboard reflects the most up-to-date financial data.
Click to buy Finance KPI Dashboard in Google Sheets
Target Sheet Tab
Here, users can input their target values for each KPI, both for MTD and YTD periods. It allows companies to track how their actual performance compares to their set financial goals.

Click to buy Finance KPI Dashboard in Google Sheets
Previous Year Numbers Sheet Tab
This sheet allows users to enter the actual numbers for the previous year, which are essential for making year-over-year comparisons. This comparison helps to identify trends and performance gaps over time.

Click to buy Finance KPI Dashboard in Google Sheets
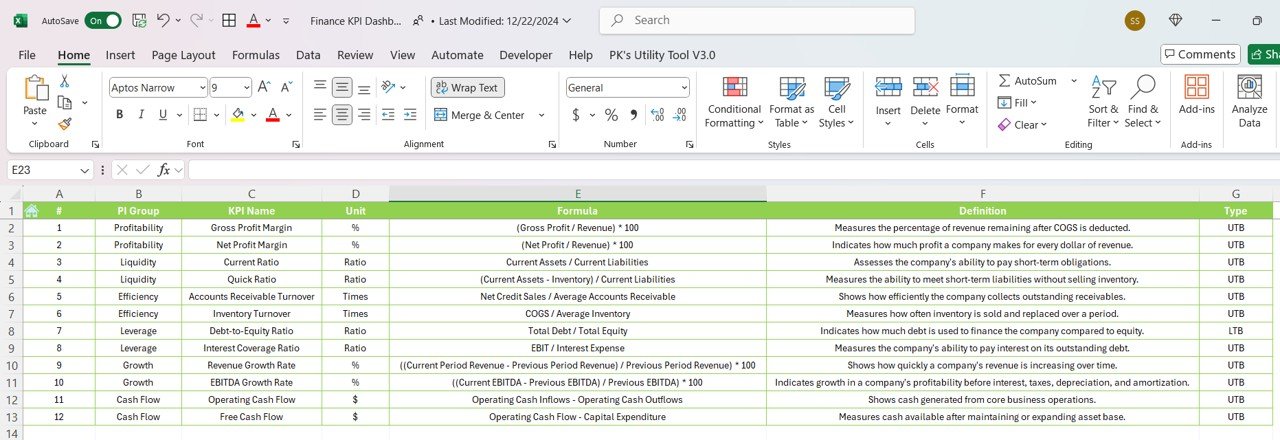
KPI Definition Sheet Tab
This sheet offers detailed information about each KPI, including the KPI Name, Group, Unit, Formula, and Definition. It helps maintain consistency and ensures that all team members have a clear understanding of the metrics being tracked.
Click to buy Finance KPI Dashboard in Google Sheets
Advantages of Using a Finance KPI Dashboard in Google Sheets
An Finance KPI Dashboard in Google Sheets offers numerous advantages, making it an ideal solution for financial tracking. Here are some of the key benefits:
- Cost-Effective: Google Sheets is free to use, which makes it an affordable tool for businesses of all sizes.
- Real-Time Collaboration: Google Sheets allows multiple team members to access, update, and collaborate in real-time, ensuring all data is up to date.
- Ease of Customization: The dashboard can be easily customized to suit the specific needs of your business, whether you’re tracking cash flow, profitability, or any other financial metric.
- User-Friendly Interface: Google Sheets provides a simple, intuitive interface that doesn’t require extensive technical knowledge to use effectively.
- Cloud-Based: Being cloud-based, the dashboard is accessible from anywhere, making it easy for financial managers and stakeholders to stay informed at all times.
Click to buy Finance KPI Dashboard in Google Sheets
Opportunities for Improvement in Finance KPI Dashboards
While the Finance KPI Dashboard in Google Sheets offers many benefits, there are also opportunities to enhance its functionality and effectiveness:
- Automation: Automating data entry and calculation processes using Google Apps Script can reduce errors and save time.
- Advanced Visualizations: Incorporating advanced charts and graphs, such as heatmaps or sparklines, can provide more visual clarity on trends and performance.
- Data Integration: Integrating the dashboard with other financial systems (e.g., accounting software) can help streamline data collection and improve accuracy.
- Predictive Analytics: Using historical data to forecast future trends (e.g., revenue growth or cash flow) can help businesses make more informed decisions.
- Mobile Optimization: Ensure the dashboard is optimized for mobile devices, allowing users to view key financial metrics on the go.
Best Practices for Using a Finance KPI Dashboard in Google Sheets
To maximize the effectiveness of your Finance KPI Dashboard, follow these best practices:
- Update Data Regularly: Ensure that the data entered into the dashboard is accurate and up to date. Set a routine for regular updates to maintain the dashboard’s relevance.
- Focus on Key Metrics: While it’s tempting to track a wide range of financial metrics, focus on the KPIs that matter most to your business objectives.
- Leverage Conditional Formatting: Use conditional formatting to highlight key performance indicators and make data easier to interpret.
- Ensure Data Consistency: Maintain consistency in how data is entered into the dashboard to ensure that results are comparable over time.
- Monitor Trends Over Time: Regularly analyze trends in financial KPIs to identify areas of strength and opportunities for improvement.
Conclusion
Click to buy Finance KPI Dashboard in Google Sheets
An Finance KPI Dashboard in Google Sheets is an indispensable tool for tracking and analyzing your company’s financial performance. It provides a clear, consolidated view of key metrics like revenue growth, profit margins, and cash flow. By customizing this dashboard to suit your specific needs, you can ensure that you are continuously monitoring your financial health and making data-driven decisions to achieve your business goals.
Frequently Asked Questions with Answers
1. What is a Finance KPI Dashboard?
A Finance KPI Dashboard is a tool that helps monitor key financial metrics like revenue, profit margins, and expenses. It provides a visual representation of a company’s financial performance.
2. How do I create a Finance KPI Dashboard in Google Sheets?
To create a Finance KPI Dashboard, you can use Google Sheets to build worksheets for actual numbers, targets, trends, and definitions. Add drop-down menus, formulas, and conditional formatting to make the dashboard interactive.
3. What KPIs should I track in a Finance KPI Dashboard?
Essential KPIs to track in a finance dashboard include Revenue Growth, Net Profit Margin, Operating Expense Ratio, Current Ratio, Return on Assets (ROA), Debt-to-Equity Ratio, and Cash Flow from Operations.
4. Can I customize the Finance KPI Dashboard to my company’s needs?
Yes, the Finance KPI Dashboard in Google Sheets is fully customizable. You can adjust the KPIs, data inputs, and visualizations to reflect your company’s financial goals.
5. How often should I update the Finance KPI Dashboard?
You should update the dashboard regularly—preferably on a monthly or quarterly basis—to ensure that the data reflects the most current financial performance.
Visit our YouTube channel to learn step-by-step video tutorials
Youtube.com/@NeotechNavigators
Click to buy Finance KPI Dashboard in Google Sheets