In today’s digital world, tracking Key Performance Indicators (KPIs) is crucial for any business, including the publishing industry. By utilizing a Publishing KPI Dashboard in Google Sheets, organizations can seamlessly track their progress, assess their strategies, and make data-driven decisions. This guide will walk you through the key features, advantages, opportunities for improvement, best practices, and frequently asked questions about creating a Publishing KPI Dashboard in Google Sheets.
What is a Publishing KPI Dashboard in Google Sheets?
A Publishing KPI Dashboard in Google Sheets is a powerful tool that allows publishing businesses to monitor their performance across various metrics. Whether you are tracking the success of your content, analyzing advertising effectiveness, or measuring readership engagement, this dashboard enables you to visualize data efficiently. The beauty of using Google Sheets lies in its collaborative nature, allowing teams to update data in real-time and make informed decisions quickly.
Key Features of the Publishing KPI Dashboard
Here are the main features of the Publishing KPI Dashboard in Google Sheets:
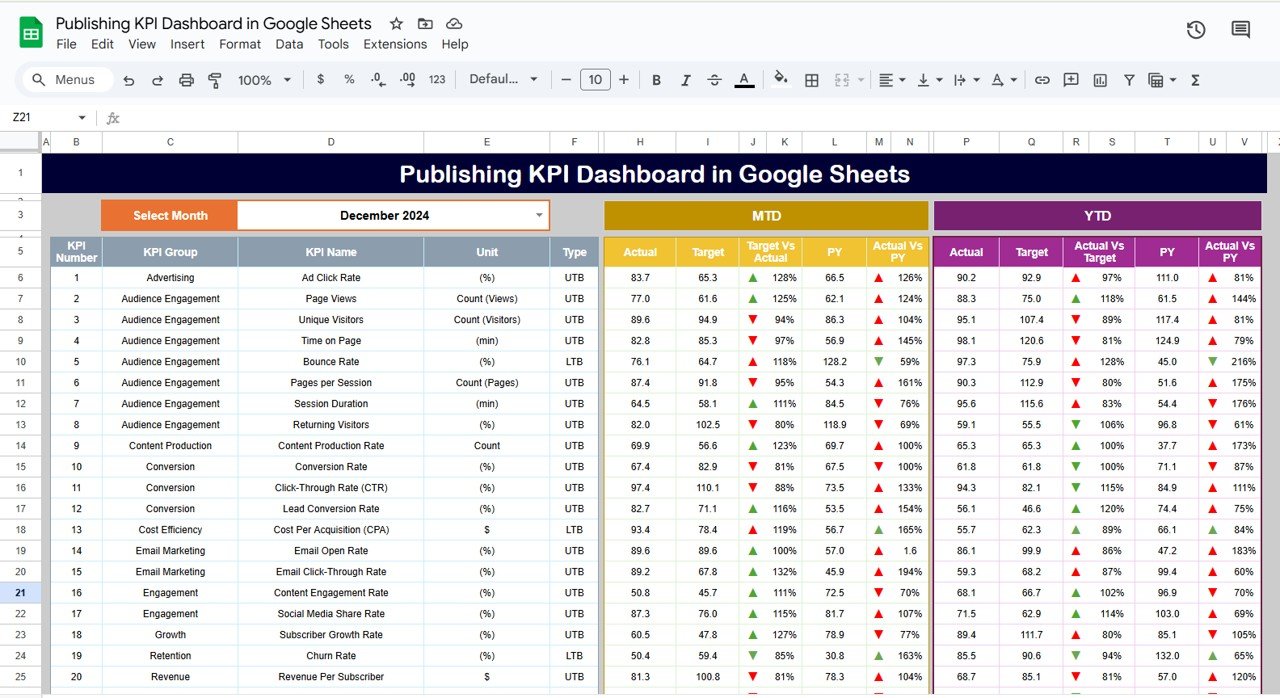
Dashboard Sheet Tab
This is the primary sheet where you will see an overview of all your KPIs. It allows you to track:
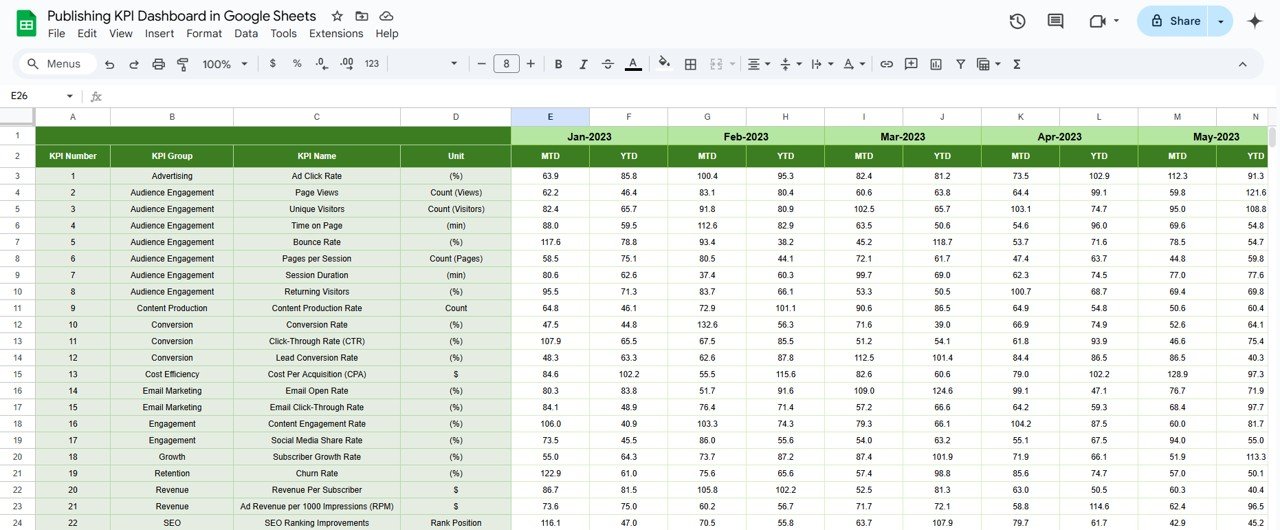
- MTD (Month to Date) Actual vs. Target
- YTD (Year to Date) Actual vs. Target
- Previous Year Data vs. Current Year Data
The dashboard includes conditional formatting with up and down arrows to visualize progress easily.
Click to buy Publishing KPI Dashboard in Google Sheets
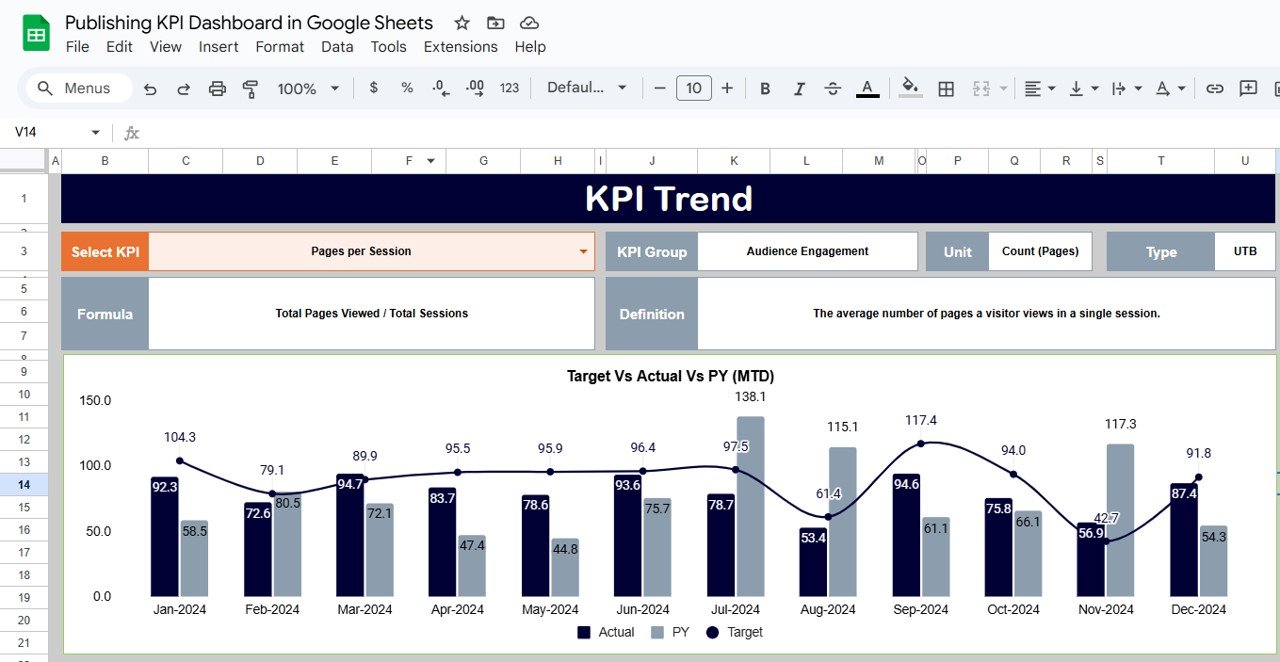
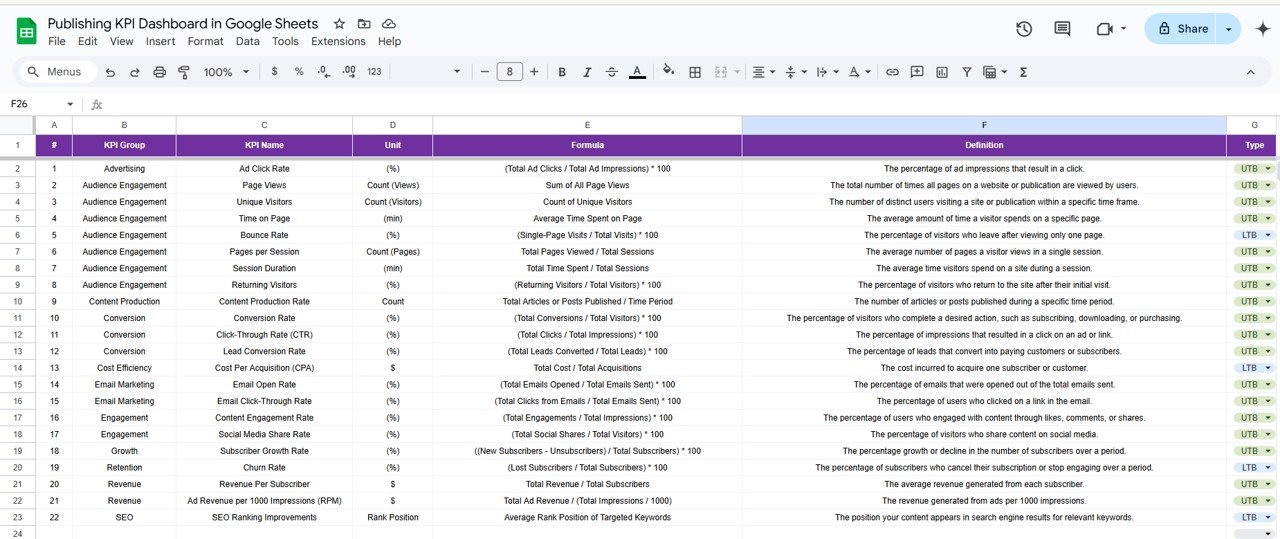
KPI Trend Sheet Tab
In this tab, you can select the KPI name from a dropdown menu (located in Range C3). It will display:
- KPI Group
- Unit of Measurement
- Type (Lower is Better or Upper is Better)
- Formula used to calculate the KPI
- Definition of the KPI
Click to buy Publishing KPI Dashboard in Google Sheets
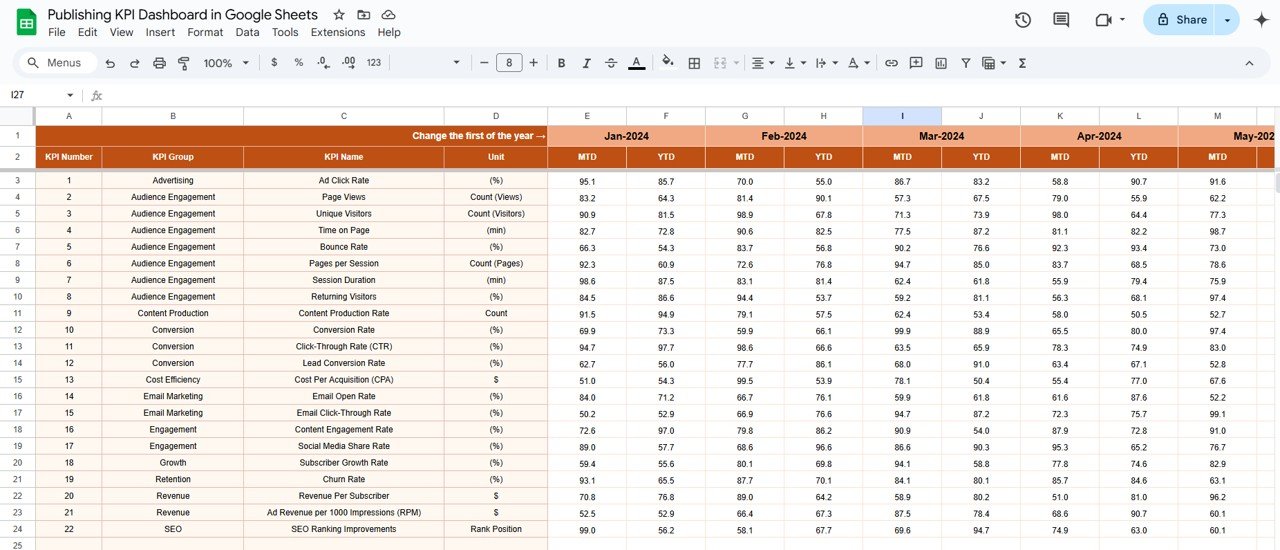
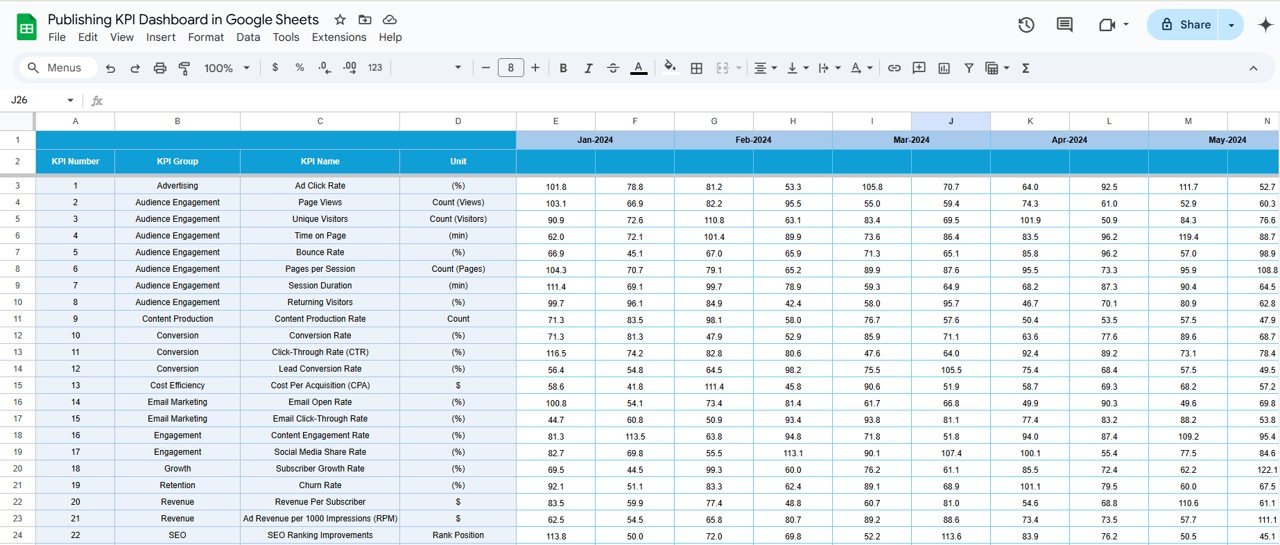
Actual Number Sheet Tab
This sheet allows you to input the actual data for each KPI based on the YTD and MTD values for a particular month. You can change the month dynamically in Range E1 to adjust the calculations accordingly.
Target Sheet Tab
In the target sheet, you can enter the target numbers for each KPI for the respective months, both for MTD and YTD. This helps you measure how well your organization is meeting its goals.
Click to buy Publishing KPI Dashboard in Google Sheets
Previous Year Number Sheet Tab
Here, you can input data from the previous year, allowing for comparative analysis against the current year’s performance.
KPI Definition Sheet Tab
This tab holds all the details about each KPI, including the name, group, unit of measurement, formula, and a definition. It serves as a reference guide for understanding each KPI’s relevance and calculation.
Click to buy Publishing KPI Dashboard in Google Sheets
Advantages of Using a Publishing KPI Dashboard in Google Sheets
There are numerous benefits to using a Publishing KPI Dashboard in Google Sheets. Some of the main advantages include:
- Centralized Data Management: By using Google Sheets, you can centralize all your data in one location. This improves collaboration among team members and makes it easier to update and share real-time data across departments.
- Customization: Google Sheets offers a flexible and customizable environment. You can modify the dashboard to track exactly the KPIs that matter most to your business, whether you’re focusing on sales, readership, advertising revenue, or any other publishing metric.
- Data Transparency and Accessibility: One of the best things about Google Sheets is its cloud-based nature. Your team can access and update the dashboard from anywhere, anytime, ensuring that data is always up-to-date and accurate. This accessibility fosters better decision-making, as all stakeholders can have a clear view of the latest metrics.
- Cost-Effective: Google Sheets is a free tool, and the Publishing KPI Dashboard doesn’t require any expensive software or subscriptions. It provides a highly efficient and budget-friendly solution for small to medium-sized publishing businesses.
- Visualization and Analysis: With built-in conditional formatting, the dashboard makes it easier to visualize data, including MTD and YTD performance comparisons. This helps you quickly identify areas of improvement or success, aiding in faster decision-making.
Opportunities for Improvement in a Publishing KPI Dashboard
While Google Sheets is a fantastic tool for creating dashboards, there are always opportunities to enhance your Publishing KPI Dashboard for greater efficiency and functionality. Here are some suggestions:
- Advanced Data Integration: Google Sheets offers integration with other tools, such as Google Analytics, Google Ads, and social media platforms. Leveraging these integrations can help automate the data input process, reducing the need for manual updates and making the dashboard even more powerful.
- Automated Reporting: You can improve the dashboard by incorporating automated reports and alerts. By using Google Sheets functions like Google Apps Script, you can set up automatic reports to be sent to key stakeholders at specified intervals. This would eliminate the need for manual reporting and ensure that the data is always available when needed.
- Enhanced Visualizations: Although Google Sheets provides basic visualizations such as charts and graphs, using additional visualization tools like Google Data Studio or Power BI could improve the aesthetics and insights provided by the dashboard. These platforms offer more complex reporting and visualization options, making your data even more actionable.
Best Practices for Using a Publishing KPI Dashboard
Click to buy Publishing KPI Dashboard in Google Sheets
To get the most out of your Publishing KPI Dashboard in Google Sheets, follow these best practices:
- Define Clear KPIs: Before you begin creating the dashboard, make sure to define your KPIs clearly. Ensure that each KPI has a specific purpose and is measurable. This will make the dashboard more effective in tracking progress and driving decision-making.
- Keep Data Accurate and Updated: Regularly update the actual numbers, target values, and previous year data to ensure the dashboard reflects the current performance. The value of a KPI dashboard lies in its real-time accuracy, so consistency is key.
- Use Conditional Formatting Effectively; Take full advantage of Google Sheets’ conditional formatting. Use color-coding, arrows, and other visual indicators to highlight areas that need attention or improvement. This will make it easier to interpret the data at a glance.
- Simplify for Better Clarity; Don’t overcrowd the dashboard with unnecessary metrics. Keep it simple, focusing on the KPIs that are most critical to your business. Too much data can overwhelm the user and make the dashboard less effective.
- Review and Revise: The dashboard should be a dynamic tool that evolves with the business. Periodically review the KPIs and adjust them as needed to ensure they are still aligned with business goals. This will keep the dashboard relevant and valuable for long-term success.
Frequently Asked Questions (FAQs)
Click to buy Publishing KPI Dashboard in Google Sheets
1. What are KPIs in Publishing?
KPIs in publishing are metrics used to track the performance of various aspects of a publishing business, such as readership, content engagement, sales, or advertising revenue. These KPIs help businesses assess their effectiveness and make data-driven decisions.
2. How Can I Use Google Sheets for My Publishing KPI Dashboard?
Google Sheets allows you to create custom dashboards by entering your KPIs and setting up formulas to track MTD, YTD, and previous year data. You can use features like dropdown menus, conditional formatting, and charts to enhance your dashboard’s functionality.
3. Can I Integrate My Google Sheets KPI Dashboard with Other Tools?
Yes, Google Sheets integrates well with other tools, such as Google Analytics, Google Ads, and social media platforms. You can also automate data input and reporting using Google Apps Script.
4. What Are Some Examples of Publishing KPIs?
Common publishing KPIs include:
-
Revenue per Subscriber (Revenue ÷ Total Subscribers)
-
Subscriber Growth Rate (New Subscribers ÷ Total Subscribers)
-
Click-Through Rate (CTR) (Total Clicks ÷ Total Impressions)
-
Page Views per Visit (Total Page Views ÷ Total Visits)
5. How Often Should I Update My Publishing KPI Dashboard?
The frequency of updates depends on your business needs, but it’s recommended to update your dashboard at least once a month. For real-time tracking, consider setting up automated data imports and alerts.
Conclusion
Click to buy Publishing KPI Dashboard in Google Sheets
Creating a Publishing KPI Dashboard in Google Sheets provides an effective and affordable way to track the performance of your publishing business. By centralizing your data, visualizing your KPIs, and using best practices for continuous improvement, you can make informed decisions and drive better outcomes. Whether you are tracking readership, sales, or content performance, this dashboard will help you stay on top of your publishing goals and ensure long-term success.
Visit our YouTube channel to learn step-by-step video tutorials
Youtube.com/@NeotechNavigators