As online marketplaces continue to grow and evolve, tracking key performance indicators (KPIs) is essential for ensuring operational success. The Online Marketplaces KPI Dashboard in Google Sheets is a powerful tool designed to help marketplace managers and sellers track essential metrics like sales, revenue, product performance, and customer satisfaction. This ready-to-use dashboard helps monitor business performance and provides real-time insights, allowing for data-driven decision-making and improved marketplace strategies.
What is the Online Marketplaces KPI Dashboard in Google Sheets?
The Online Marketplaces KPI Dashboard in Google Sheets is an interactive and customizable dashboard designed to track and visualize key metrics related to online marketplace performance. This dashboard includes a variety of KPIs such as sales volume, conversion rates, customer satisfaction, and more. With its user-friendly interface, the dashboard enables users to quickly evaluate how well their marketplace is performing and make informed decisions to drive growth.
Key Features of the Online Marketplaces KPI Dashboard
Click to buy Online Marketplaces KPI Dashboard in Google Sheets
The Online Marketplaces KPI Dashboard consists of six worksheets, each focusing on different aspects of marketplace performance:
1. Dashboard Sheet Tab
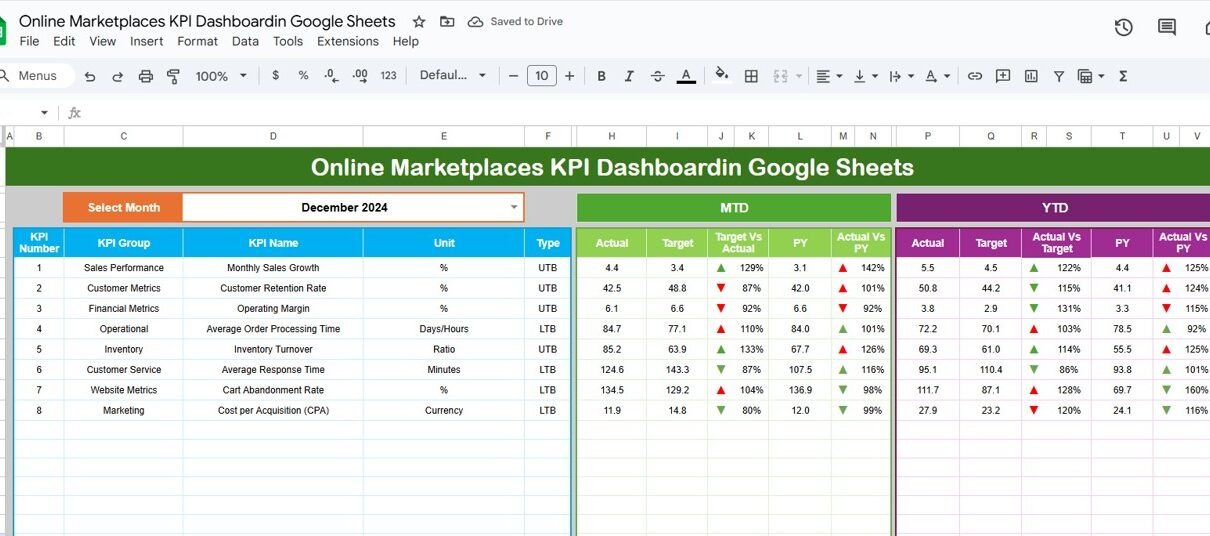
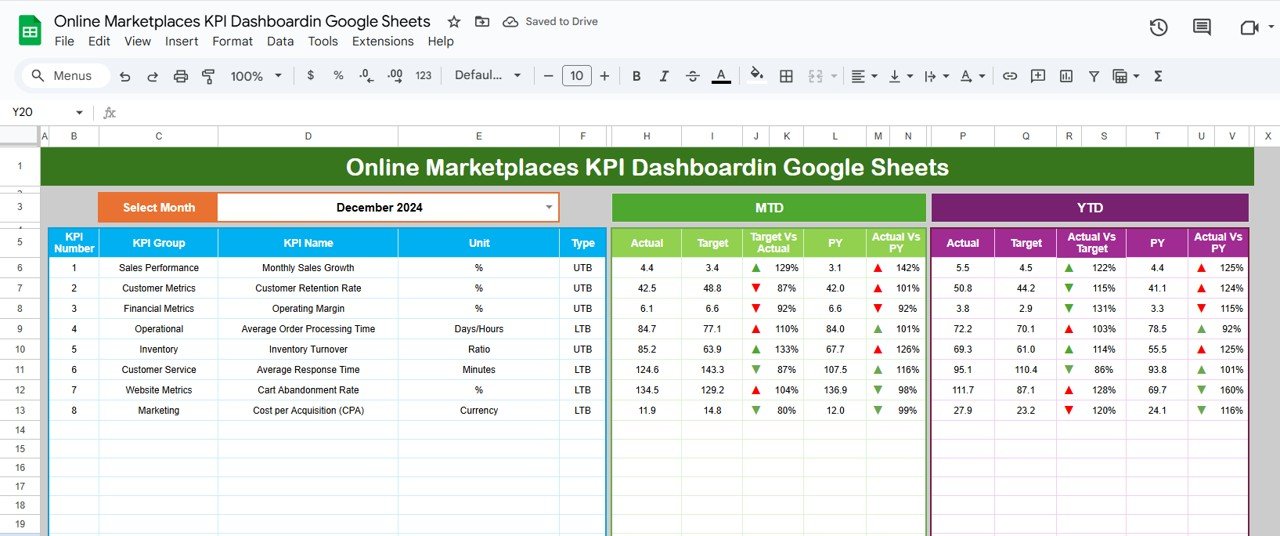
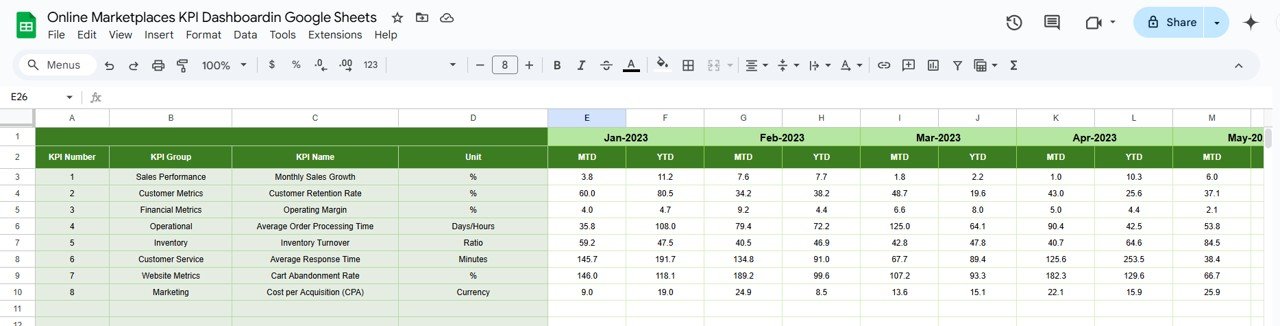
The Dashboard sheet serves as the main interface where users can see an overview of their KPIs. Key components of this sheet include:
-
MTD (Month-to-Date) and YTD (Year-to-Date) data, with comparisons to targets and previous year performance.
-
Target vs. Actual and Previous Year vs. Actual comparisons, shown with conditional formatting (up/down arrows) to visualize performance trends.
-
Online Marketplaces KPI Dashboard in Google Sheets Click to buy Online Marketplaces KPI Dashboard in Google Sheets
2. KPI Trend Sheet Tab
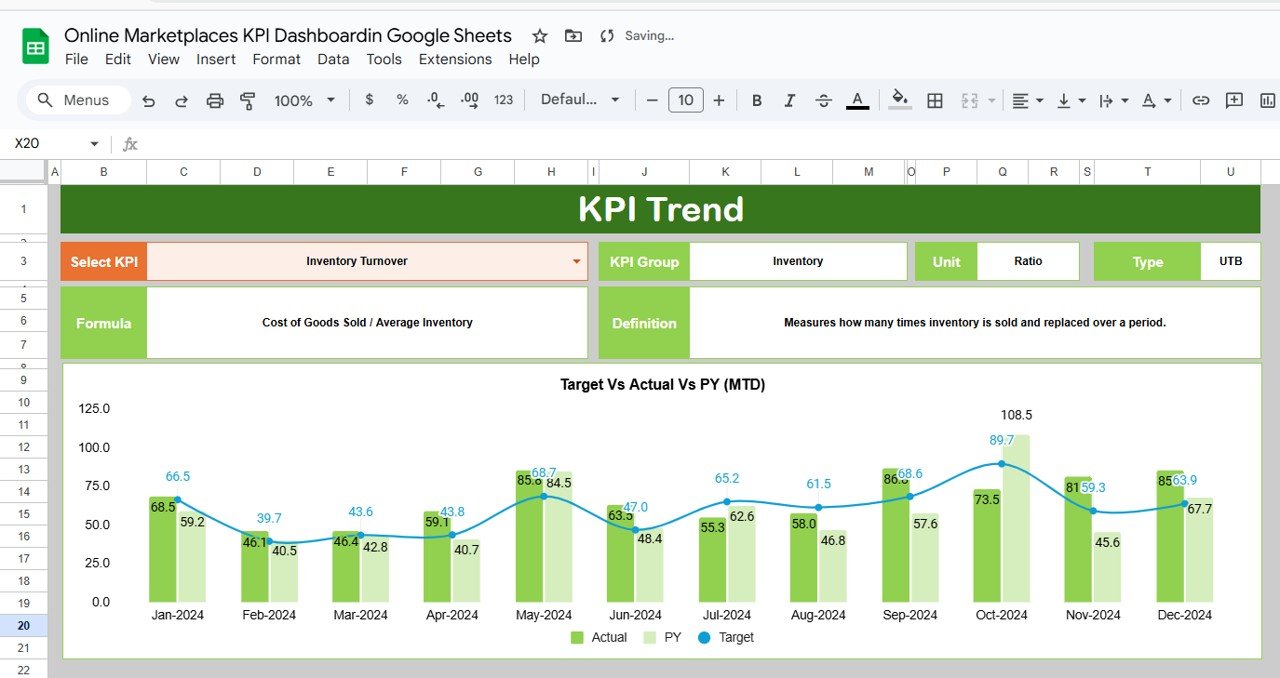
The KPI Trend sheet provides a detailed historical view of each selected KPI. This sheet includes:
-
A dropdown to select the KPI name.
-
The KPI Group, Unit of KPI, and Type of KPI (e.g., Lower the Better or Upper the Better).
-
The Formula used to calculate the KPI.
-
The Definition of each KPI to ensure consistency in measurement and tracking.
Click to buy Online Marketplaces KPI Dashboard in Google Sheets
3. Actual Number Sheet Tab
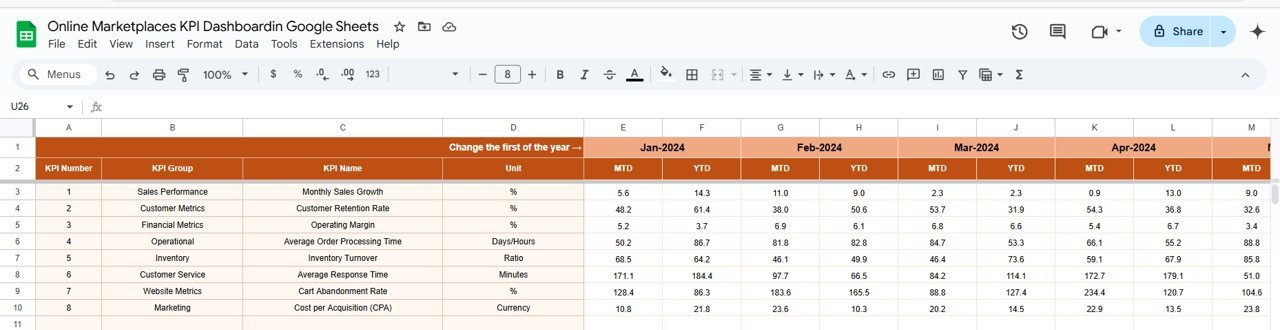
The Actual Number sheet allows users to enter real-time performance data for each KPI. Users can input actual data for both MTD and YTD performance. The dashboard automatically updates based on the data entered in this sheet. Users can change the month from Range E1, and the entire dashboard will adjust accordingly.
4. Target Sheet Tab
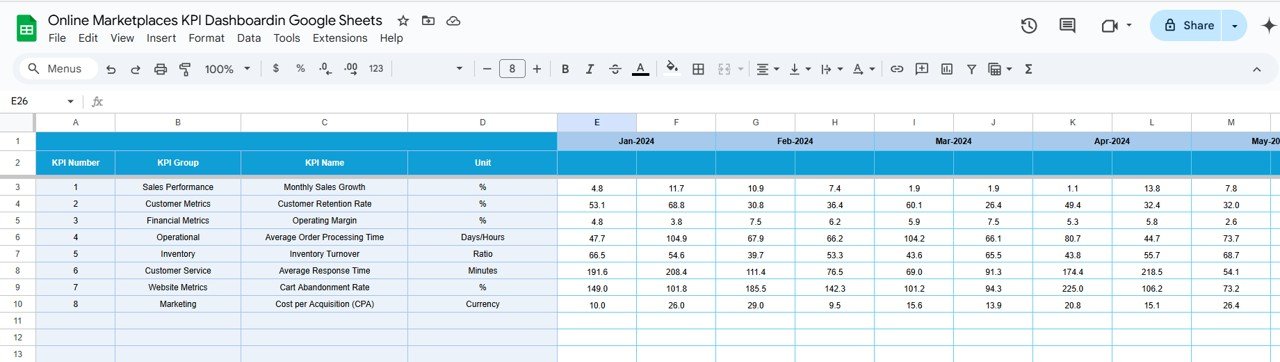
The Target Sheet is where users enter target values for each KPI, both MTD and YTD, for the selected month. These target values serve as benchmarks against which actual performance is compared.
Click to buy Online Marketplaces KPI Dashboard in Google Sheets
5. Previous Year Number Sheet Tab
The Previous Year Number Sheet allows users to enter historical data from the previous year for comparison purposes. This is important for evaluating growth or decline in performance over time.
6. KPI Definition Sheet Tab
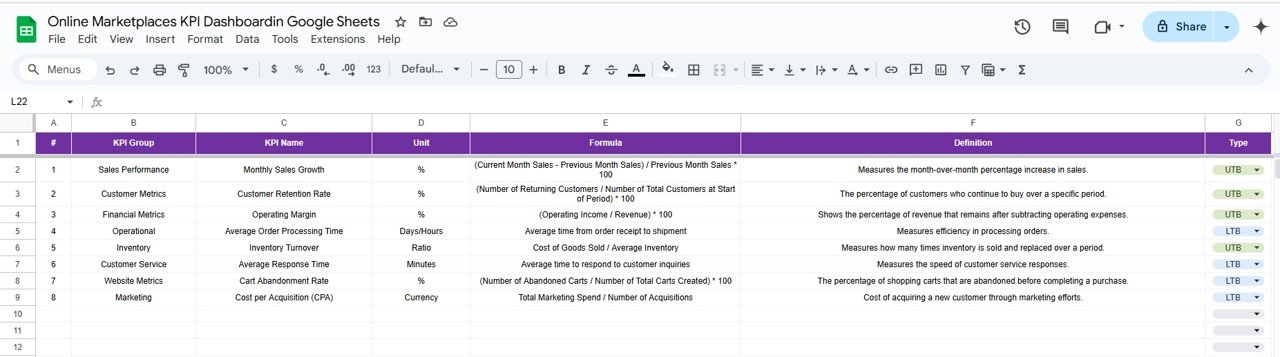
The KPI Definition Sheet provides detailed definitions and formulas for each KPI. It includes:
-
KPI Name
-
KPI Group
-
Unit of Measure
-
Formula
-
Definition
This sheet helps standardize the understanding of each KPI across the team and ensures consistency in tracking and reporting.
Click to buy Online Marketplaces KPI Dashboard in Google Sheets
Benefits of Using the Online Marketplaces KPI Dashboard
-
Data-Driven Decision Making: The dashboard consolidates key marketplace metrics, making it easier to analyze data and make informed decisions.
-
Real-Time Performance Tracking: With MTD and YTD comparisons, the dashboard provides real-time insights into marketplace performance, allowing quick adjustments when needed.
-
Customizable and Scalable: The dashboard is fully customizable, allowing businesses to track additional KPIs or adjust the layout based on specific marketplace needs.
-
Clear Visual Insights: The use of charts and graphs helps visualize complex data, making it easier to identify trends and performance gaps.
-
Performance Benchmarking: By comparing actual performance against targets and previous year data, the dashboard helps businesses benchmark performance and track growth over time.
Best Practices for Using the Online Marketplaces KPI Dashboard
Click to buy Online Marketplaces KPI Dashboard in Google Sheets
-
Regularly Update Data: Ensure that real-time data is entered regularly to keep the dashboard accurate and relevant.
-
Review Key Metrics: Monitor KPIs like Conversion Rate, Customer Satisfaction, and Average Order Value to identify areas for improvement.
-
Set Realistic Targets: Ensure that targets are challenging but achievable, and adjust them based on historical performance and market conditions.
-
Monitor Seasonal Trends: Use the Monthly Trends feature to track and plan for seasonal variations in sales, conversions, and customer behavior.
-
Optimize Marketing Efforts: Use insights from the dashboard to refine marketing campaigns, targeting high-performing product categories or customer segments.
Conclusion
The Online Marketplaces KPI Dashboard in Google Sheets is an essential tool for tracking and optimizing performance across online marketplaces. With its comprehensive view of sales, customer satisfaction, agent performance, and payment trends, this dashboard provides all the necessary insights for growing and improving your marketplace business. Whether you are managing a small marketplace or overseeing a large platform, this dashboard helps ensure that all critical KPIs are monitored and optimized for success.
Frequently Asked Questions (FAQs)
Click to buy Online Marketplaces KPI Dashboard in Google Sheets
1. How do I enter data into the Online Marketplaces KPI Dashboard?
Data is entered into the Actual Number Sheet, where you can input values such as sales volume, conversions, and customer satisfaction scores.
2. Can I customize the dashboard for my specific marketplace needs?
Yes, the dashboard is fully customizable. You can add or remove KPIs, adjust charts, and modify the layout to meet your marketplace’s requirements.
3. How does the KPI Trend Sheet help in performance analysis?
The KPI Trend Sheet allows you to track the performance of KPIs over time, providing a historical view of how key metrics have evolved.
4. Can I track individual product performance with this dashboard?
Yes, you can customize the dashboard to track individual products, product categories, or sellers, depending on the level of granularity you need.
5. How can I improve my conversion rate using the dashboard?
By regularly monitoring the Conversion Rate KPI, you can identify bottlenecks in the sales funnel, enabling you to optimize the shopping experience and increase conversions.
Visit our YouTube channel to learn step-by-step video tutorials
Youtube.com/@NeotechNavigators
Watch the step-by-step video Demo:
Click to buy Online Marketplaces KPI Dashboard in Google Sheets