In the fast-paced world of digital marketing, affiliate marketing continues to stand out as a high-ROI channel. However, without proper tracking and data analysis, even the best affiliate programs can fall flat. That’s where the Affiliate Marketing KPI Dashboard in Google Sheets comes into play.Affiliate Marketing KPI Dashboard in Google Sheets
This article will walk you through everything you need to know about this powerful, user-friendly dashboard—from its structure and features to best practices, key performance indicators (KPIs), and how to make the most of it. Whether you’re a solo marketer, a digital agency, or a growing business, this tool helps you stay on top of your affiliate performance with clarity and control.Affiliate Marketing KPI Dashboard in Google Sheets
What Is an Affiliate Marketing KPI Dashboard in Google Sheets?
Click to buy Affiliate Marketing KPI Dashboard in Google Sheets
An Affiliate Marketing KPI Dashboard is a centralized tool designed to track, monitor, and evaluate the performance of your affiliate marketing campaigns. Built in Google Sheets, this dashboard allows marketers to measure vital KPIs like conversions, revenue, commission, click-through rate (CTR), and ROI—all in real-time and without expensive software.
This dashboard helps you:
-
Identify high-performing affiliates
-
Track monthly trends
-
Compare current performance with targets and last year’s data
-
Make data-driven decisions for future campaigns
Why Use Google Sheets for Your KPI Dashboard?
Using Google Sheets offers numerous benefits:
-
Accessibility: Work from anywhere with real-time collaboration.
-
Customization: Modify formulas, visuals, or layouts as needed.
-
Cost-effective: No need for paid analytics platforms.
-
Scalability: Expand and evolve your dashboard as your program grows.
With built-in features like data validation, dropdown menus, slicers, and conditional formatting, Google Sheets is more powerful than you might think—especially for managing affiliate KPIs.
Key Features of the Affiliate Marketing KPI Dashboard in Google Sheets
This dashboard template is structured across six powerful worksheets, each serving a specific purpose:
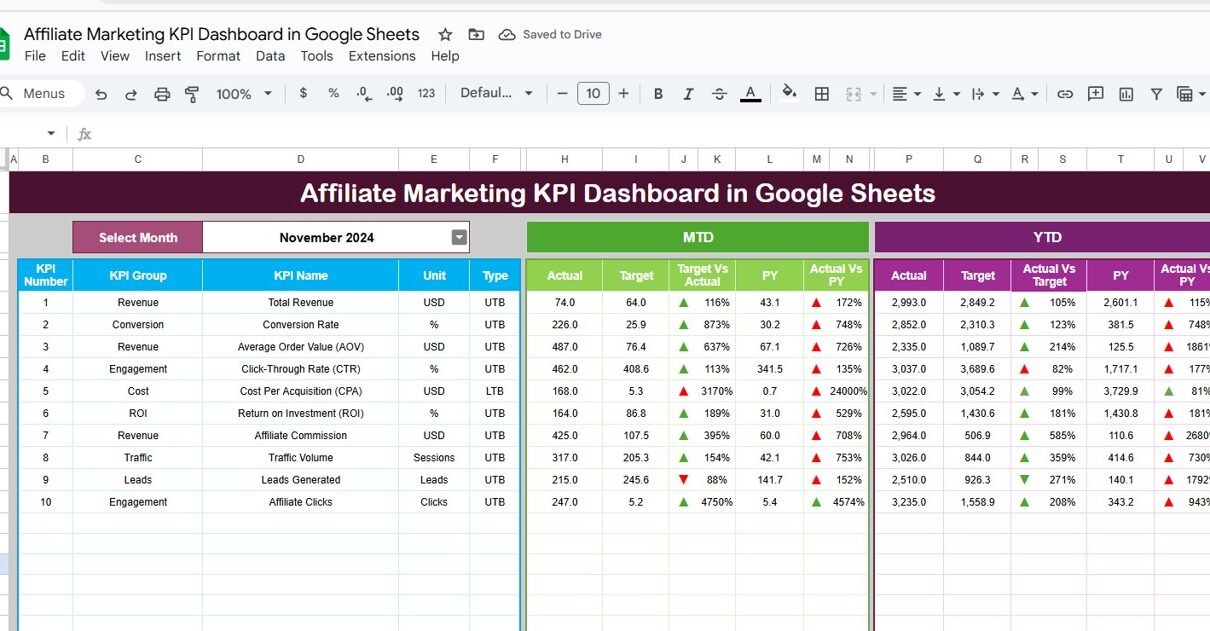
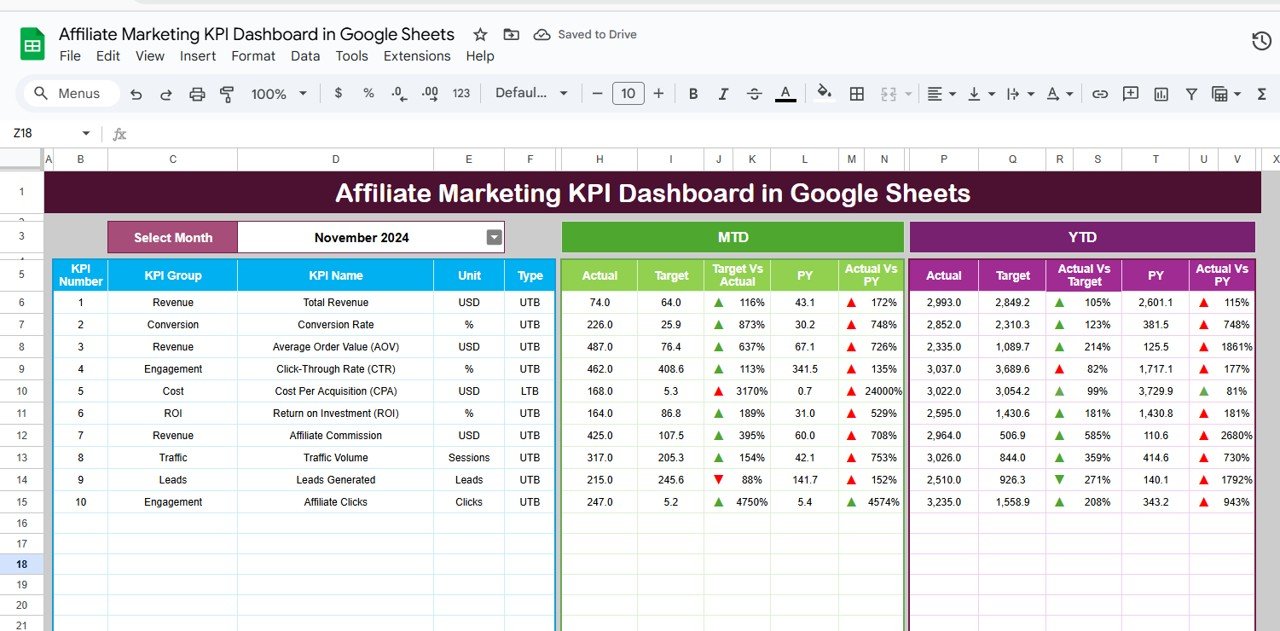
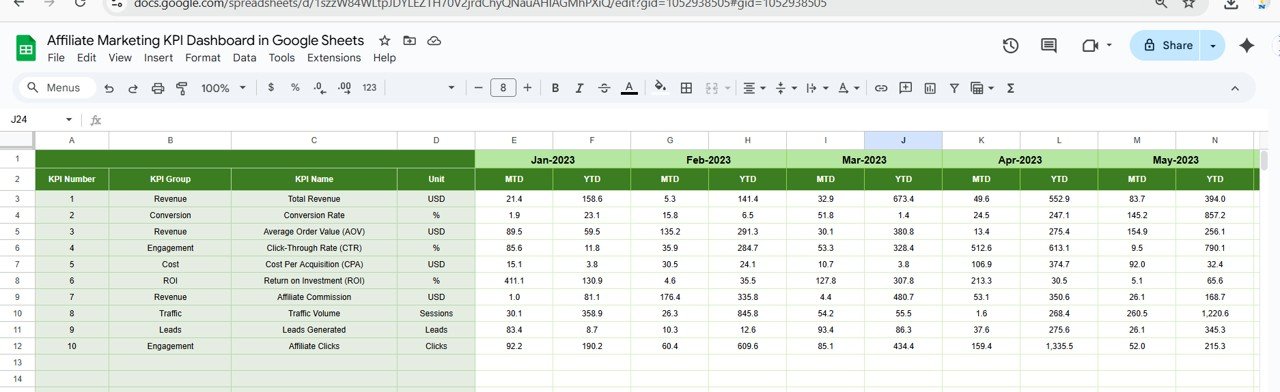
1. Dashboard Sheet (Main Visual Overview)
Drop-down to select the month (Range D3)
Displays MTD (Month-To-Date) and YTD (Year-To-Date) metrics
Comparison of:
- Actual vs Target
- Actual vs Previous Year
Conditional formatting with up/down arrows for instant visual feedback
Click to buy Affiliate Marketing KPI Dashboard in Google Sheets
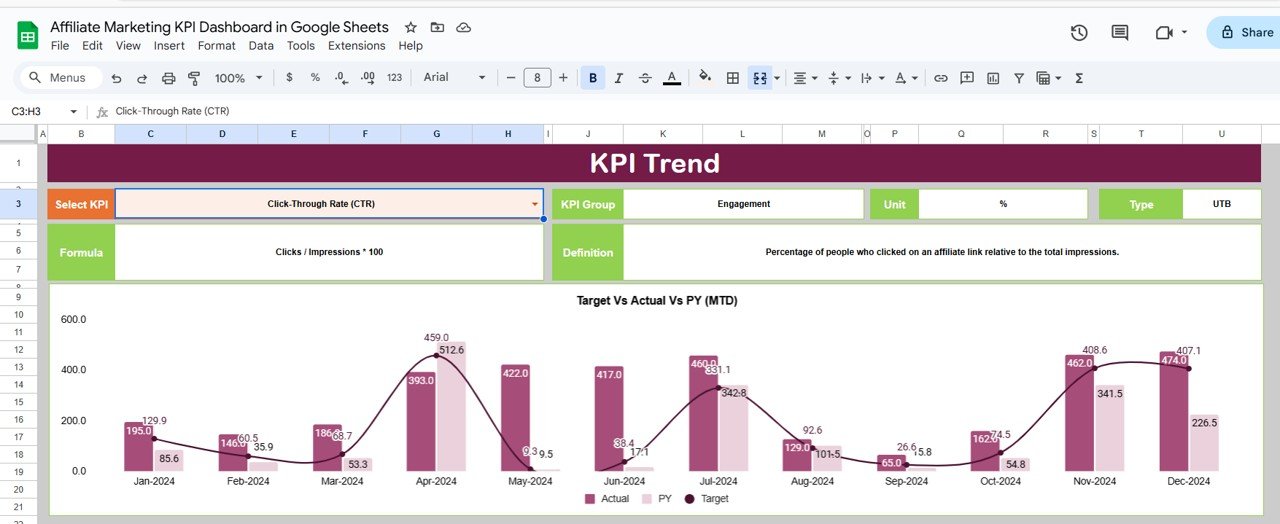
2. KPI Trend Sheet
-
Drop-down (Cell C3) to select specific KPI
-
View KPI Group, Unit, Type (LTB or UTB), Formula, and Definition
-
Analyze trends over time to detect improvement or decline
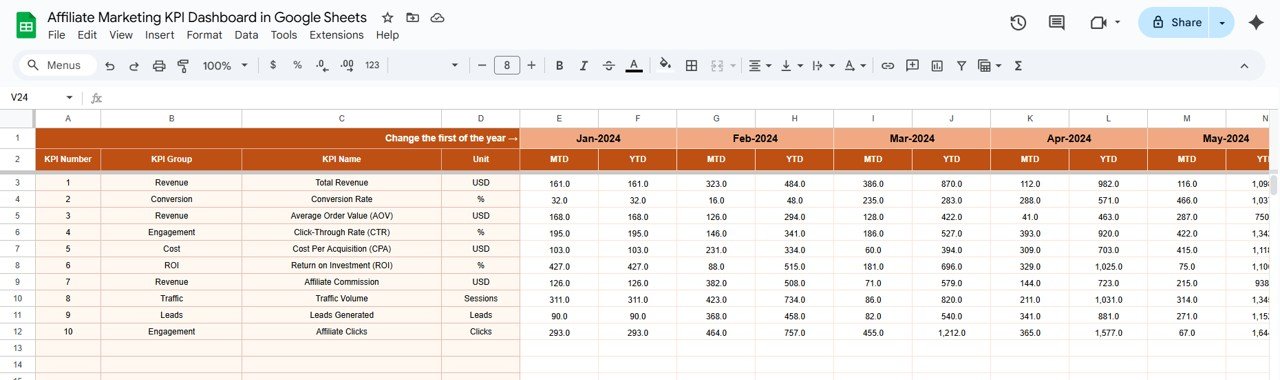
3. Actual Numbers Sheet
-
Input current data for MTD and YTD
-
Adjustable month via Range E1
-
Acts as a live data source for dashboard visuals
Click to buy Affiliate Marketing KPI Dashboard in Google Sheets
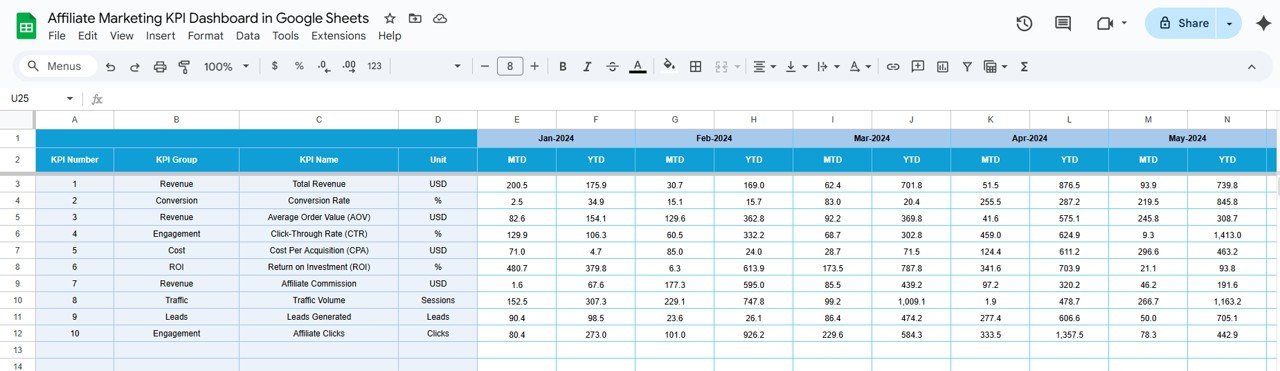
4. Target Sheet
-
Input MTD and YTD target values for each KPI
-
Easy to adjust monthly benchmarks
-
Supports performance comparisons in visuals
5. Previous Year Sheet
-
Enter historical monthly performance values
-
Provides meaningful insights into year-over-year growth
-
Enables comparison metrics in the dashboard sheet
Click to buy Affiliate Marketing KPI Dashboard in Google Sheets
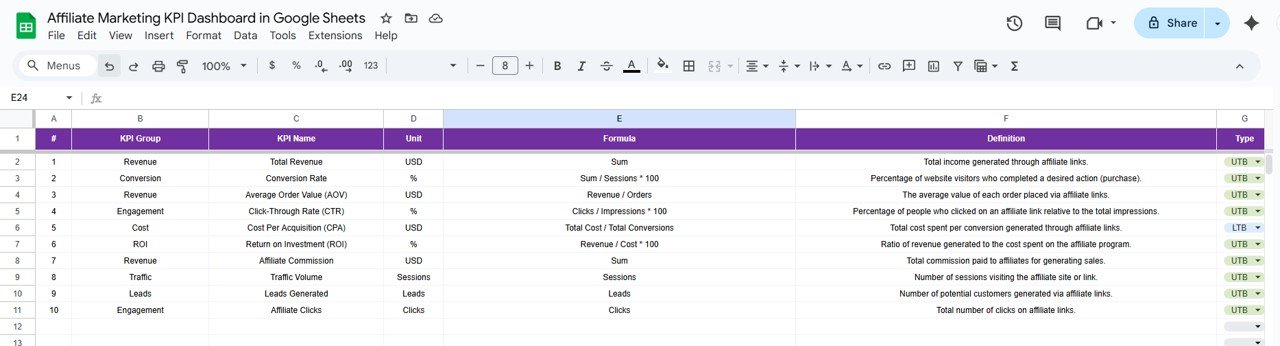
6. KPI Definition Sheet
Core reference for all KPIs
Includes:
- KPI Name
- KPI Group
- Unit of Measurement
- Formula
- Short Definition
- Type (UTB or LTB)
Sample KPIs Used in the Dashboard
Advantages of Using an Affiliate Marketing KPI Dashboard
Here are the top reasons why this dashboard is a game-changer:
-
Real-Time Visibility: Instantly view how your affiliate program performs.
-
Customizable Metrics: Tailor KPIs to your business needs.
-
Data-Driven Decisions: Know where to invest time and money.
-
Year-over-Year Tracking: See how performance has evolved.
-
Improved Accountability: Share performance insights with team or partners.
Opportunities for Improvement in the Dashboard
Click to buy Affiliate Marketing KPI Dashboard in Google Sheets
While this dashboard is highly functional, there’s always room to enhance its utility:
-
Automation with App Scripts: Use Google Apps Script to auto-refresh data or trigger alerts.
-
Affiliate Segmentation: Add filters by affiliate type, traffic source, or campaign.
-
Mobile Optimization: Optimize the layout for easier mobile viewing.
-
Affiliate Tiering: Assign performance levels (e.g., Gold, Silver, Bronze) based on KPIs.
-
Add Charts for Refund/Fraud Analysis: Visualize negative KPIs to improve clarity.
Best Practices for Affiliate Marketing KPI Tracking in Google Sheets
To get the most out of your dashboard, follow these best practices:
-
Keep KPI Definitions Short and Clear: Everyone should understand what each metric means.
-
Use Consistent Units Across Sheets: Avoid confusion by maintaining standard units (e.g., %, USD).
-
Validate Data Inputs: Use dropdowns or data validation to prevent entry errors.
-
Update Targets Regularly: Adjust monthly or quarterly based on campaign goals.
-
Add Conditional Formatting: Use color codes or arrows to highlight performance instantly.
-
Protect Critical Sheets: Lock sheets like “KPI Definition” to prevent accidental edits.
-
Create Backup Copies Monthly: Maintain version history to compare progress or recover from errors.
Conclusion
Click to buy Affiliate Marketing KPI Dashboard in Google Sheets
The Affiliate Marketing KPI Dashboard in Google Sheets is more than just a data tracker—it’s a performance powerhouse. With structured tabs for input, trend analysis, targets, and year-over-year comparison, you get everything you need to run a high-impact affiliate program. Whether you’re just starting out or managing a large affiliate team, this dashboard brings transparency, accountability, and actionable insight to your fingertips.Affiliate Marketing KPI Dashboard in Google Sheets
It’s time to ditch messy spreadsheets and guesswork. Start using a strategic, well-designed KPI dashboard that turns numbers into growth!Affiliate Marketing KPI Dashboard in Google Sheets
Frequently Asked Questions (FAQs)
1. What are the essential KPIs for affiliate marketing?
Some essential KPIs include Clicks, Conversions, Revenue, Commission Payout, ROI, and Conversion Rate. These help assess campaign performance effectively.
2. Can I customize the dashboard for my niche?
Yes, the dashboard is fully editable. You can add or remove KPIs, change formulas, and update visuals to match your niche requirements.
3. Is this dashboard suitable for beginners?
Absolutely! It’s built in Google Sheets with intuitive navigation, dropdowns, and visual feedback, making it ideal for all experience levels.
4. How often should I update the actual numbers?
We recommend updating the MTD and YTD figures weekly or bi-weekly for the most accurate and timely insights.
5. How do I compare current performance with last year?
Use the “Previous Year” tab to input historical data. The dashboard sheet will automatically compare it with current figures using up/down arrows.
6. Can I share this dashboard with my team?
Yes, since it’s built in Google Sheets, you can easily share it and assign different permission levels to team members.
7. Is this dashboard mobile-friendly?
It works on mobile browsers, but for best results, access and edit it from a laptop or desktop. Future updates can optimize mobile use.
8. What does LTB and UTB mean?
LTB (Lower The Better) and UTB (Upper The Better) define how the KPI should be evaluated. For example, a lower Refund Rate is better (LTB), while a higher ROI is better (UTB).
Visit our YouTube channel to learn step-by-step video tutorials
Youtube.com/@NeotechNavigators
Click to buy Affiliate Marketing KPI Dashboard in Google Sheets