Monitoring library operations and services is essential for ensuring optimal resource utilization, user satisfaction, and service efficiency. The Library Services KPI Dashboard in Google Sheets is a ready-to-use tool designed to track key performance indicators (KPIs), compare targets with actuals, and monitor trends over time.
In this article, we will explore the features, benefits, best practices, and frequently asked questions related to this dashboard.
What Is a Library Services KPI Dashboard?
A Library Services KPI Dashboard is a structured tool that consolidates library performance metrics in a single Google Sheet. It allows library managers, staff, and administrators to monitor:
-
Book loans and returns6
-
User engagement and attendance
-
Resource utilization
-
Operational efficiency metrics
By using this dashboard, managers can make data-driven decisions, optimize library operations, and improve user satisfaction.
Key Features of the Library Services KPI Dashboard
This dashboard contains six worksheets, each providing unique insights:
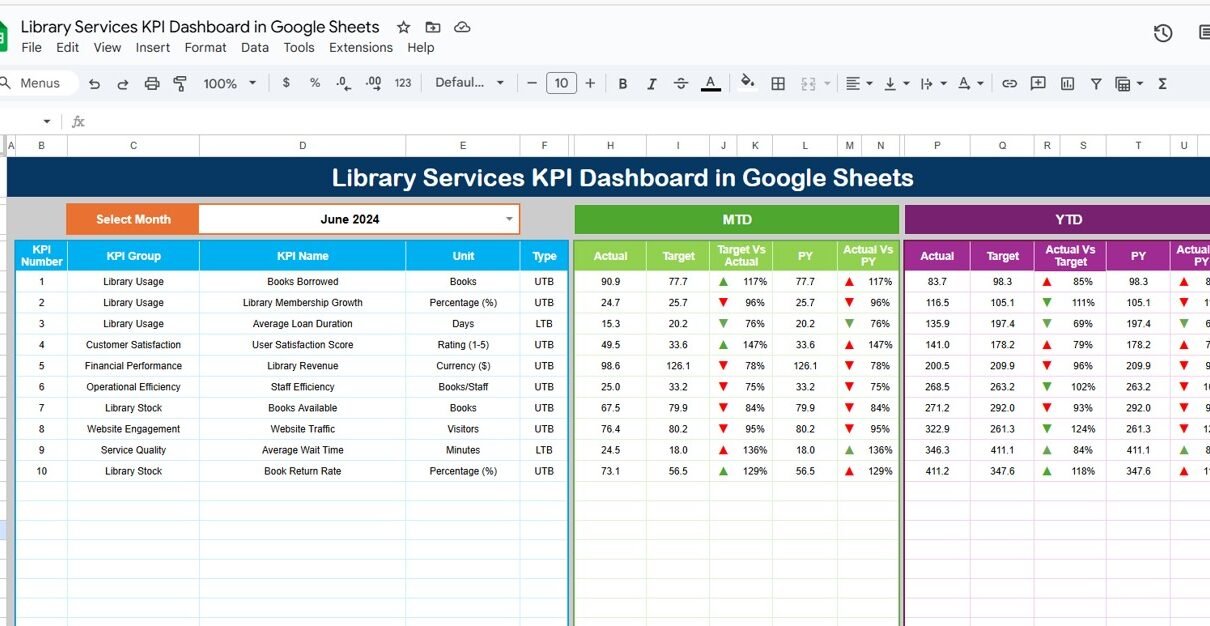
1. Dashboard Sheet Tab
The Dashboard Sheet provides an overview of all KPIs.
Features include:
-
Month Selection Dropdown (Range D3): Updates all dashboard metrics for the selected month
-
MTD Metrics: Actual, target, and previous year values with conditional formatting (up/down arrows)
-
YTD Metrics: Year-to-date performance with visual indicators for target vs actual and PY vs actual
This sheet enables quick and easy monitoring of library performance at a glance.

Click to Buy Library Services KPI Dashboard in Google Sheets
2. KPI Trend Sheet Tab
The KPI Trend Sheet provides detailed insights into individual KPIs:
-
Select a KPI from the dropdown (Range C3)
-
Displays KPI Group, Unit, and Type (Lower-the-Better or Upper-the-Better)
-
Shows the KPI Formula and Definition
-
Visualizes trends to identify areas of improvement
This sheet helps managers track performance over time and evaluate KPI effectiveness.

Click to Buy Library Services KPI Dashboard in Google Sheets
3. Actual Numbers Sheet Tab
-
Enter actual numbers for each KPI, both MTD and YTD
-
Update the first month of the year in Range E1 to dynamically adjust calculations
This sheet ensures accurate reporting of real-time metrics.

4. Target Sheet Tab
-
Enter monthly and yearly targets for each KPI
-
Compare actual performance against planned goals to measure success
This allows library management to monitor KPIs against organizational expectations.

Click to Buy Library Services KPI Dashboard in Google Sheets
5. Previous Year Numbers Sheet Tab
-
Enter previous year KPI values for comparison
-
Supports year-over-year analysis to understand trends and improvements
This is important for evaluating long-term performance and resource planning.

Click to Buy Library Services KPI Dashboard in Google Sheets
6. KPI Definition Sheet Tab
-
Document KPI Name, KPI Group, Unit, Formula, Definition, and Type (Upper-the-Better or Lower-the-Better)
-
Ensures consistency in reporting and clarity for all metrics
This sheet acts as a reference guide for understanding each KPI tracked in the dashboard.

Advantages of Using the Library Services KPI Dashboard
Click to Buy Library Services KPI Dashboard in Google Sheets
-
Centralized Data: All library metrics are tracked in a single Google Sheet
-
Visual Insights: Cards and charts make performance trends easy to interpret
-
Compare MTD and YTD Metrics: Monitor short-term and long-term performance
-
Year-over-Year Analysis: Evaluate performance against the previous year
-
Improved Decision-Making: Identify underperforming areas and allocate resources efficiently
-
Customizable: Add new KPIs or adjust formulas based on library needs
Best Practices for Using the Dashboard
Click to Buy Library Services KPI Dashboard in Google Sheets
-
Update Data Regularly: Ensure all KPIs are updated promptly for accurate reporting
-
Segment Metrics: Track by branch, section, or resource type for detailed insights
-
Monitor Trends: Compare month-to-month and year-to-year data for decision-making
-
Focus on Critical KPIs: Prioritize metrics that impact library operations and user satisfaction
-
Leverage Conditional Formatting: Highlight key performance indicators for quick understanding
Frequently Asked Questions (FAQs)
Q1: Can I customize the KPIs in this dashboard?
Yes, you can add or modify KPIs to fit your library’s focus and reporting needs.
Q2: How often should I update the data?
Monthly updates are recommended, but real-time updates can be used if data sources are integrated.
Q3: Can I track performance by branch or section?
Yes, use filters or additional columns in the Data Sheet to segment by branch, department, or resource type.
Q4: Does the dashboard show trends over time?
Yes, the KPI Trend sheet visualizes month-to-month and YTD trends for each metric.
Q5: Is this dashboard suitable for multiple libraries?
Absolutely. You can replicate sheets or add columns for each branch to manage multiple locations.
Conclusion
Click to Buy Library Services KPI Dashboard in Google Sheets
The Library Services KPI Dashboard in Google Sheets is a comprehensive tool for tracking, analyzing, and optimizing library performance. With real-time MTD and YTD metrics, trend analysis, and clear KPI definitions, it helps library managers make informed decisions, improve resource utilization, and enhance user satisfaction.
Visit our YouTube channel to learn step-by-step video tutorials
Watch the step-by-step video Demo:
Click to Buy Library Services KPI Dashboard in Google Sheets