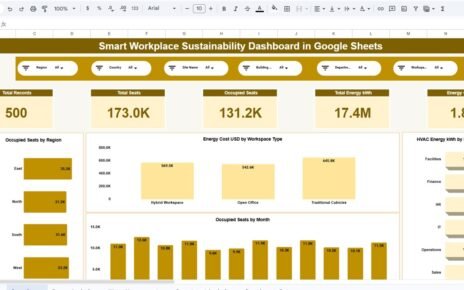
Effective incident management is essential for maintaining a safe and secure workplace. The Office Incident Report Dashboard in Google Sheets provides a ready-to-use solution to monitor, analyze, and resolve workplace incidents efficiently. This dashboard helps operations, security, and HR teams track incidents in real-time, prioritize high-severity cases, and optimize response processes.
In this article, we will explain the key features, advantages, and best practices for using this dashboard.
What Is an Office Incident Report Dashboard?
An Office Incident Report Dashboard is an interactive Google Sheets tool designed to capture, analyze, and report workplace incidents. It consolidates critical metrics such as incident counts, response times, resolution times, and severity levels into visual cards and charts.
With this dashboard, organizations can:
-
Monitor total incidents and high-severity cases
-
Track average response and resolution times
-
Compare performance across locations, departments, or incident types
-
Make data-driven decisions to improve workplace safety
Key Features of the Dashboard
Click to Buy Office Incident Report Dashboard in Google Sheets
This dashboard contains three main sheets designed to cover all aspects of incident management:
1. Dashboard Sheet Tab
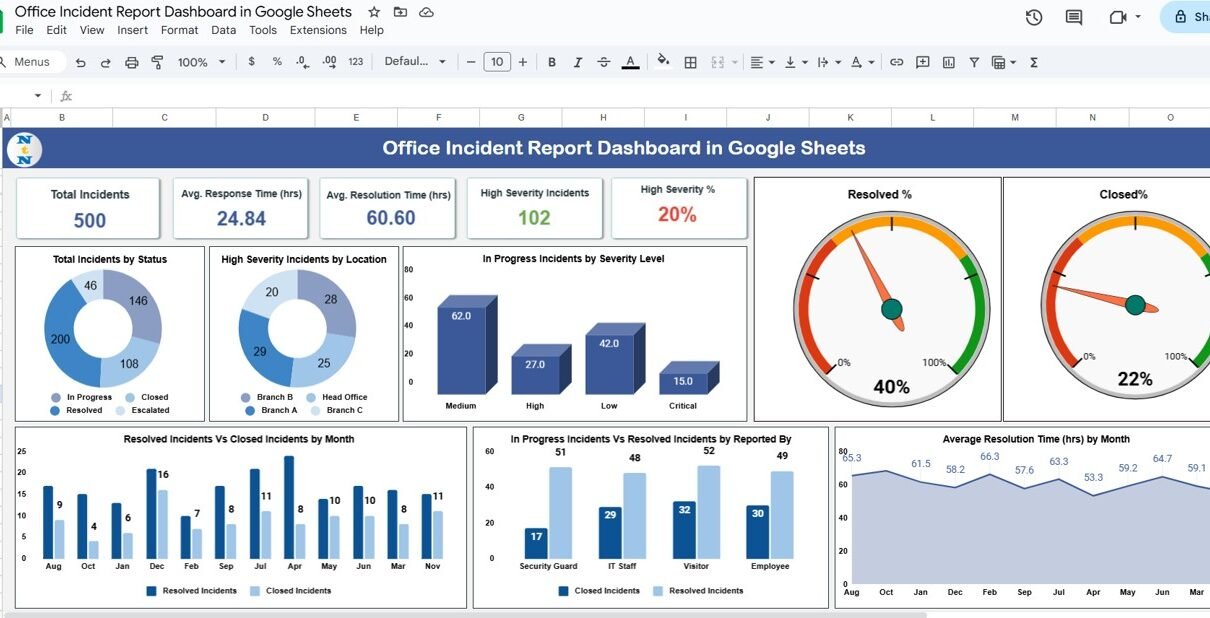
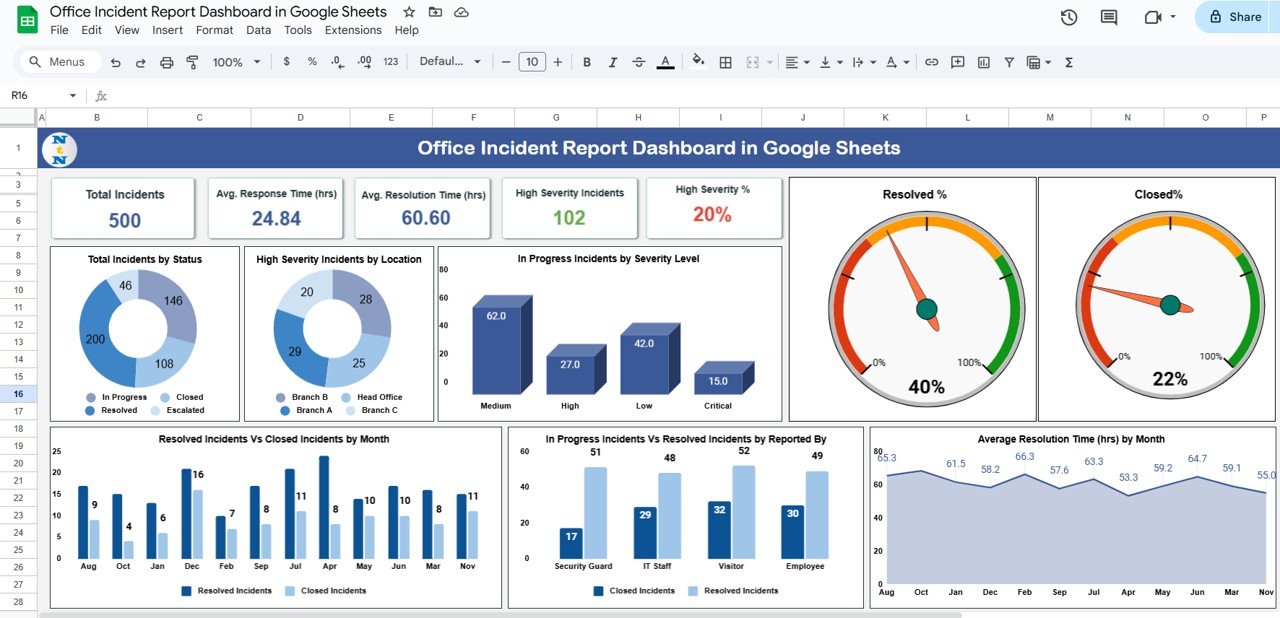
The Dashboard Sheet provides a high-level overview of all incidents.
Cards:
-
Total Incidents: Total number of incidents reported
-
Avg. Response Time (hrs): Average time taken to respond to incidents
-
Avg. Resolution Time (hrs): Average time to resolve incidents
-
High Severity Incidents: Number of incidents classified as high severity
-
High Severity %: Percentage of incidents that are high severity
Charts:
-
Total Incidents by Status: Visualize incidents by status (Open, In Progress, Resolved, Closed)
-
High Severity Incidents by Location: Track high-severity cases across office locations
-
In Progress Incidents by Severity Level: Analyze ongoing incidents by severity
-
Resolved % and Closed %: Track resolution and closure rates
-
Average Resolution Time by Month: Monitor time trends for incident resolution
-
In Progress vs Resolved by Reported By: Compare workload distribution by reporter
-
Resolved vs Closed Incidents by Month: Track closure efficiency over time
Click to Buy Office Incident Report Dashboard in Google Sheets
2. Data Sheet TabThe Data Sheet is the central input sheet for all incident records.
-
Capture incident details such as date, severity, location, department, reporter, response and resolution times, and status
-
Data entered here automatically updates all dashboards and charts
-
Ensures accurate tracking of incidents for reporting and trend analysis
Click to Buy Office Incident Report Dashboard in Google Sheets
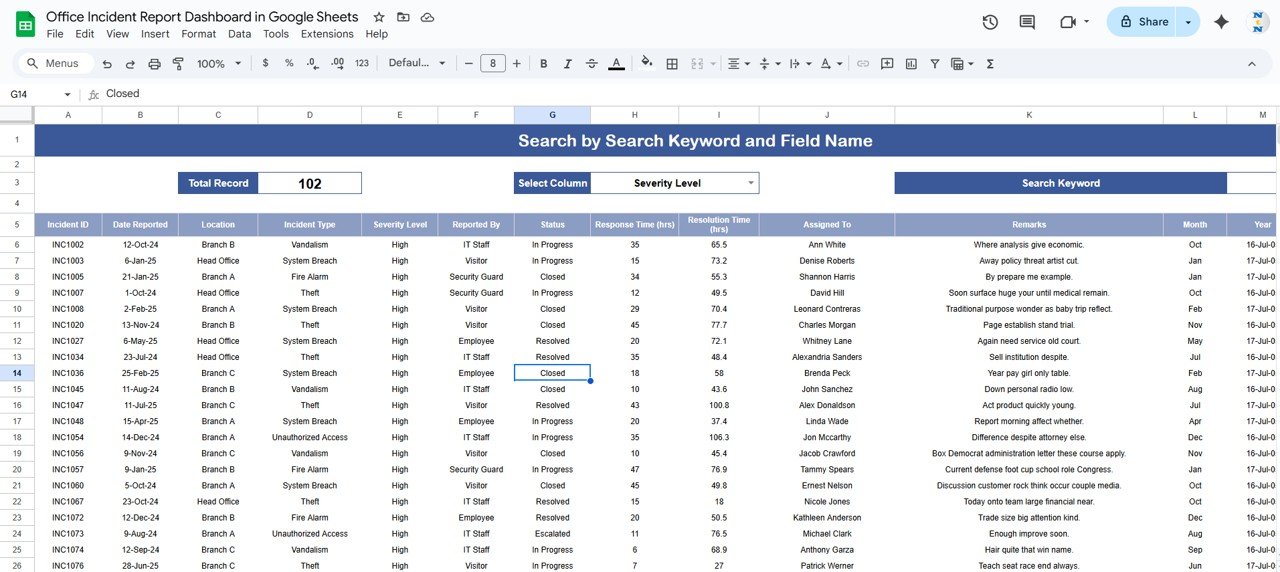
3. Search Sheet Tab
The Search Sheet allows quick filtering of incidents based on:
-
Search Keyword: Type in a specific keyword to locate incidents
-
Field Name: Select a specific field such as department, location, or status
This enables quick access to any incident without scrolling through large datasets.
Click to Buy Office Incident Report Dashboard in Google Sheets
Advantages of Using the Office Incident Report Dashboard
-
Centralized Tracking: All incidents are recorded and visualized in one place
-
Real-Time Insights: Instant updates when new incidents are added
-
Prioritize High-Severity Cases: Quickly identify and respond to critical incidents
-
Monitor Performance: Track average response and resolution times across departments
-
Data-Driven Decisions: Improve workplace safety and operational efficiency
-
Customizable: Adjust dashboards, charts, and KPIs according to organizational needs
Best Practices for Using the Dashboard
-
Update Data Regularly: Ensure all new incidents are entered promptly
-
Track High-Severity Cases Closely: Focus on incidents that pose the most risk
-
Monitor Trends Over Time: Use monthly charts to identify recurring issues or bottlenecks
-
Segment Data by Location or Department: Helps pinpoint specific areas needing improvement
-
Use Search Functionality Efficiently: Quickly locate incidents by keyword or field for immediate action
-
Review Resolution Metrics: Analyze response and resolution times to optimize processes
How This Dashboard Helps Organizations
Click to Buy Office Incident Report Dashboard in Google Sheets
-
Enhances Workplace Safety: Track and resolve incidents efficiently
-
Improves Accountability: Assign incidents and monitor resolutions by reporter or department
-
Supports Compliance: Maintain accurate records for internal audits or regulatory requirements
-
Reduces Risk: Quickly identify high-risk incidents and allocate resources accordingly
-
Facilitates Reporting: Generate management reports without manual compilation
Frequently Asked Questions (FAQs)
Click to Buy Office Incident Report Dashboard in Google Sheets
Q1: Can I customize the incident categories and severity levels?
Yes, you can adjust categories, severity levels, and statuses to match your organization’s reporting standards.
Q2: How often should the data be updated?
Ideally, update the data daily or immediately when new incidents occur for accurate real-time monitoring.
Q3: Can I track performance by department or location?
Yes, charts allow you to filter and analyze incidents by department, location, or reporter.
Q4: Does this dashboard track trends over time?
Yes, metrics like average resolution time and monthly incident counts allow trend analysis.
Q5: Can multiple users update the dashboard simultaneously?
Absolutely. Google Sheets supports collaborative editing for multiple team members.
Conclusion
Click to Buy Office Incident Report Dashboard in Google Sheets
The Office Incident Report Dashboard in Google Sheets is a powerful, ready-to-use solution for monitoring and managing workplace incidents. With cards, charts, and search functionality, organizations can improve safety, response times, and operational efficiency. By centralizing incident data and visualizing key metrics, this dashboard empowers teams to make timely, informed decisions.
Visit our YouTube channel to learn step-by-step video tutorials
Youtube.com/@NeotechNavigators
Watch the step-by-step video Demo:
Click to Buy Office Incident Report Dashboard in Google Sheets