Running a successful craft brewery takes more than creativity and passion for beer — it requires precise data tracking, smart decision-making, and efficient performance monitoring. With competition growing and production costs fluctuating, brewery owners and managers need real-time visibility into their operations.
That’s where the Craft Brewery KPI Dashboard in Google Sheets becomes a game-changer.
This powerful, ready-to-use dashboard helps breweries monitor key performance indicators (KPIs) related to production, sales, costs, inventory, and distribution. It simplifies data management and transforms complex brewery data into meaningful insights — all within the familiar and accessible environment of Google Sheets.
Whether you run a small microbrewery or a mid-size craft operation, this dashboard can help you stay profitable, reduce waste, and make smarter business decisions.
Click to buyCraft Brewery KPI Dashboard in Google Sheets
What Is a Craft Brewery KPI Dashboard in Google Sheets?
A Craft Brewery KPI Dashboard is an interactive data visualization tool built entirely in Google Sheets. It consolidates multiple brewery metrics — from brewing efficiency to sales performance — into one central platform.
Instead of juggling multiple spreadsheets, managers can now track Month-to-Date (MTD) and Year-to-Date (YTD) results in a single view, compare targets versus actuals, and review previous year performance.
Structure of the Craft Brewery KPI Dashboard Template
The dashboard is neatly organized into six interactive worksheet tabs, each designed to manage a different part of the performance-tracking process. Let’s look at each one in detail.
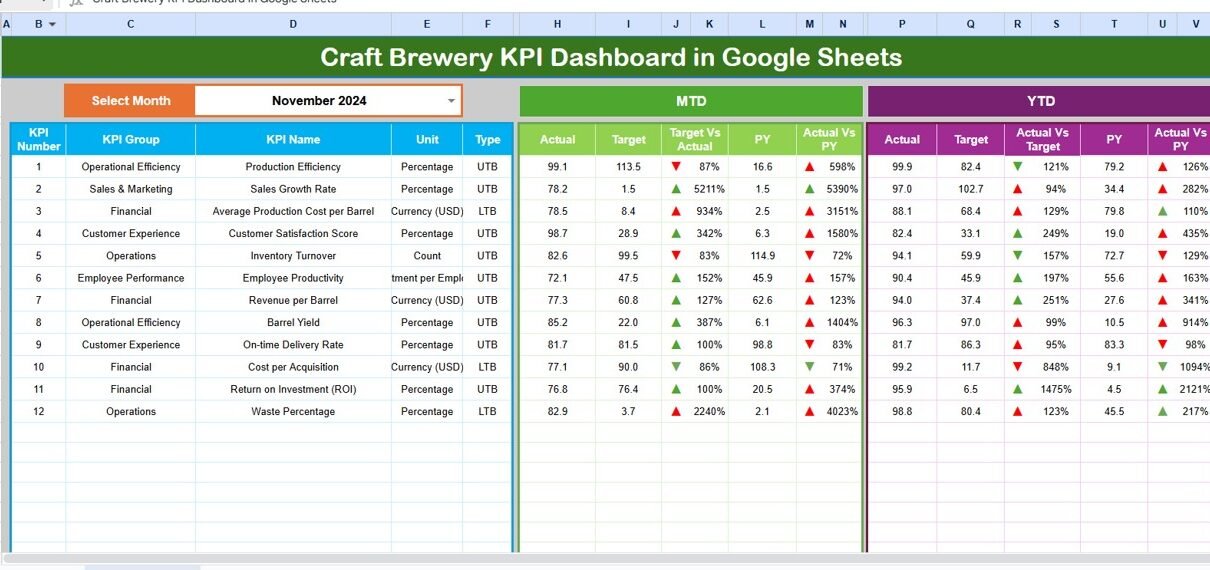
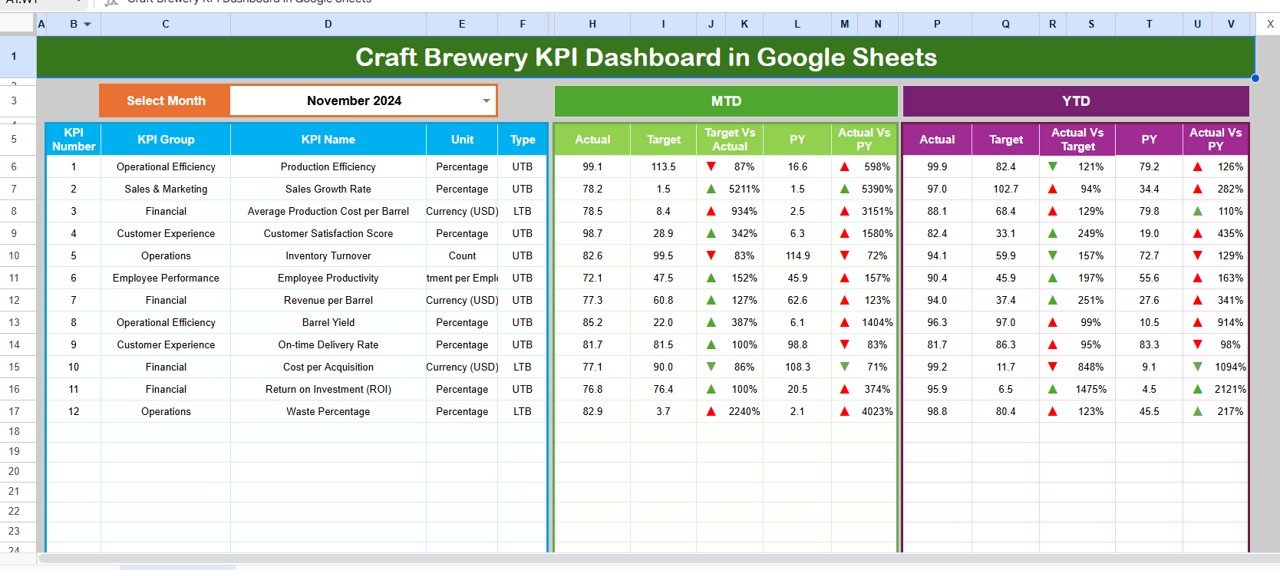
Dashboard Sheet Tab
This is the main control center of your brewery performance monitoring.
- Users can select the desired month from a dropdown menu located in cell D3.
- The dashboard automatically updates to display MTD and YTD metrics for that selected month.
- It features five key visuals that show comparisons between Actual vs Target and Actual vs Previous Year (PY) results.
- Conditional formatting with arrows indicates performance trends — upward arrows (▲) for improvement and downward arrows (▼) for decline.
This sheet provides a quick overview of how your brewery is performing across different KPIs such as production yield, fermentation efficiency, sales volume, and more.
Click to buyCraft Brewery KPI Dashboard in Google Sheets
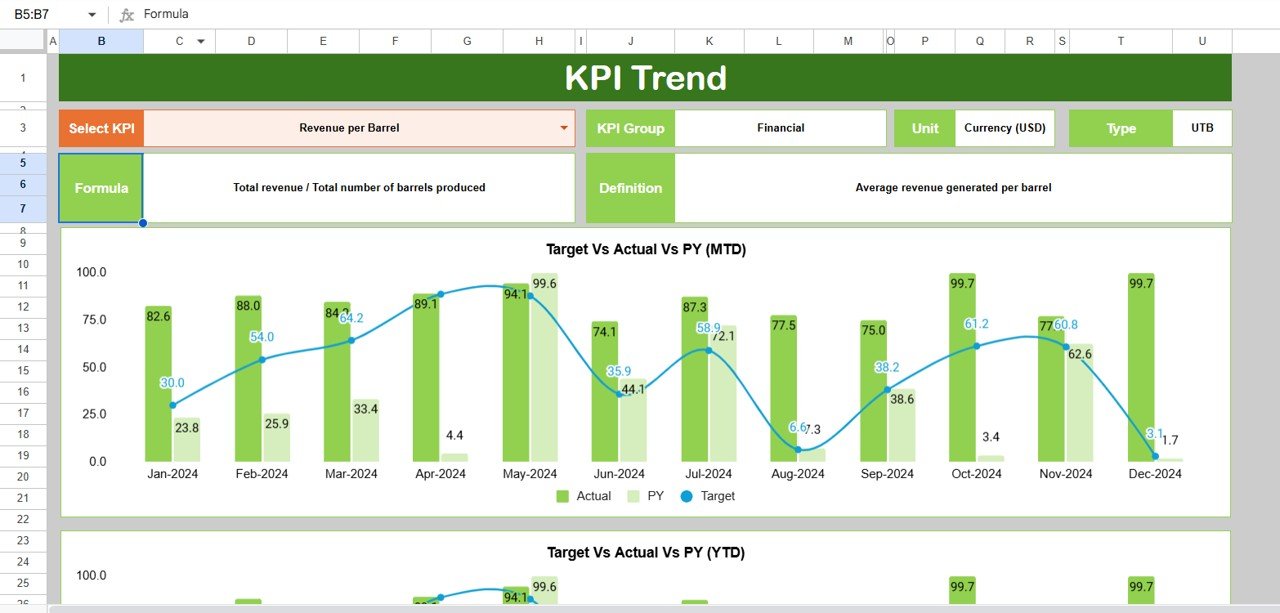
Trend Sheet Tab
The Trend sheet provides a deeper view of performance over time.
- You can select a KPI name using the dropdown in cell C3.
- The sheet displays detailed information such as KPI Group, Unit, Type (UTB/LTB), Formula, and Definition.
- MTD and YTD trend charts visualize Actual, Target, and Previous Year figures side-by-side.
This helps you identify long-term performance patterns and make data-driven production decisions — such as adjusting batch sizes, improving fermentation rates, or optimizing raw material use.
Click to buyCraft Brewery KPI Dashboard in Google Sheets
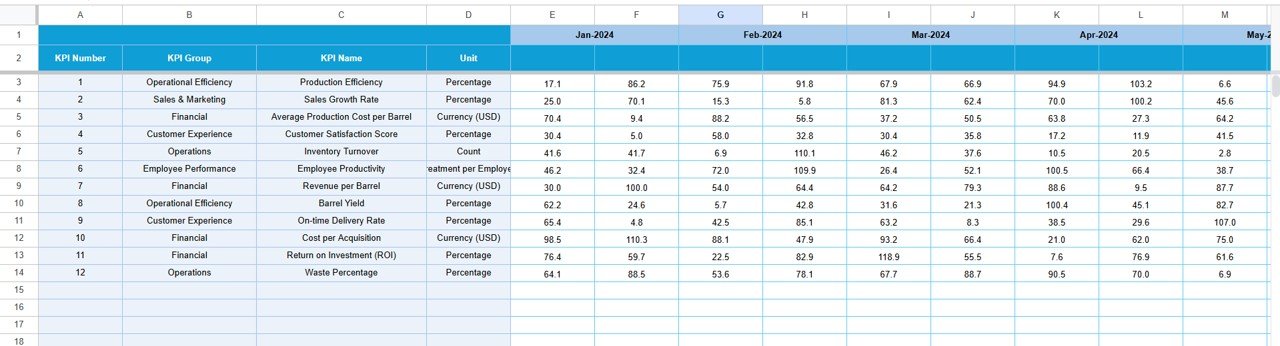
Actual Numbers Input Sheet
The Actual Numbers Input sheet is where you record your monthly performance data.
- Simply input actual values for MTD and YTD.
- The system automatically recalculates totals and updates all dashboards.
- You can modify the first month of the year in cell E1 to align with your financial calendar.
This sheet acts as the heart of your dataset, ensuring your dashboard always reflects the latest production and sales data.
Click to buyCraft Brewery KPI Dashboard in Google Sheets
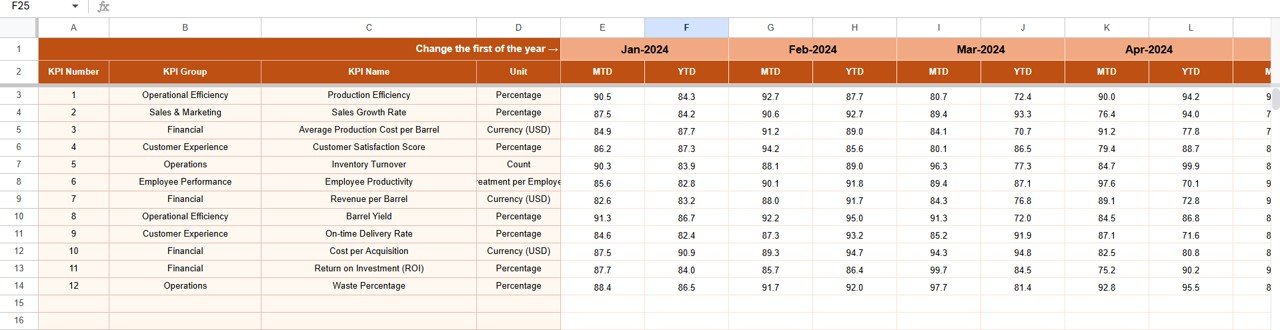
Target Sheet Tab
In the Target sheet, you set your monthly and yearly goals.
- Input both MTD and YTD targets for each KPI.
- These numbers help benchmark your performance and provide a basis for comparison in the main dashboard.
By setting clear, realistic targets, breweries can align departments toward shared goals such as increasing brewing capacity, reducing wastage, or improving sales conversion.
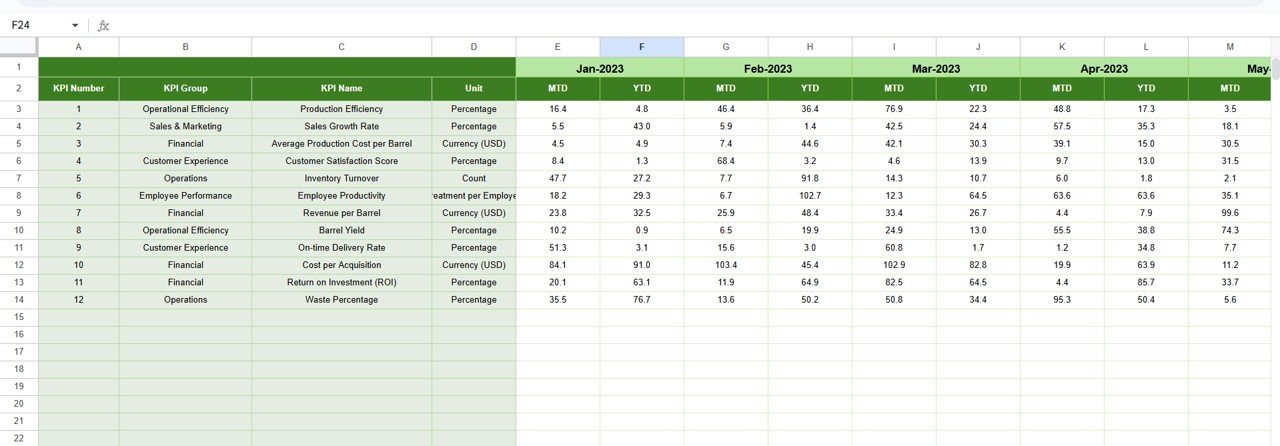
Previous Year Numbers Sheet Tab
This sheet maintains historical data for comparison.
- It mirrors the structure of your current-year sheets, helping you analyze growth or decline over time.
- By reviewing trends, you can identify patterns — such as seasonal demand fluctuations or recurring bottlenecks.
Historical insights are crucial for long-term strategy and forecasting future production or sales volumes.
Click to buyCraft Brewery KPI Dashboard in Google Sheets
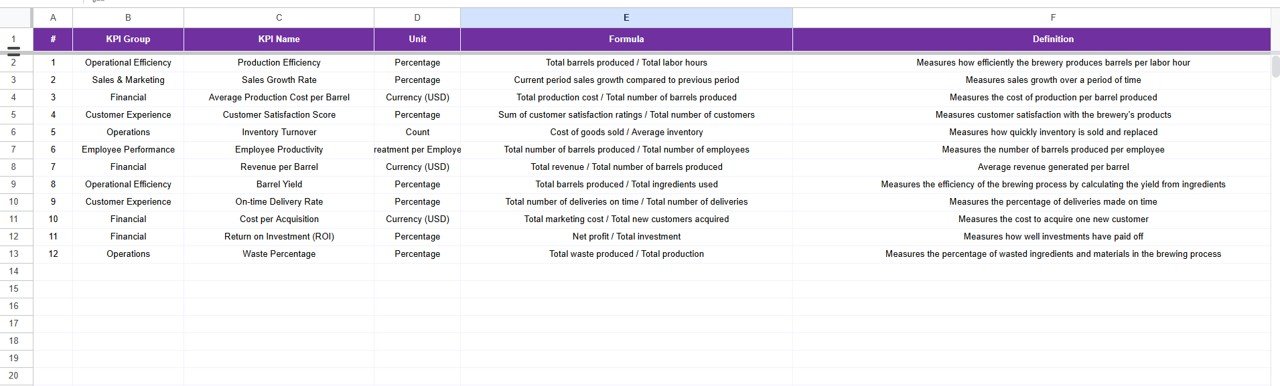
KPI Definition Sheet Tab
The KPI Definition sheet serves as a reference point.
- It lists every KPI, its group, unit of measurement, calculation formula, and a short definition.
- This ensures clarity and consistency when multiple users interact with the dashboard.
Examples of common KPIs in a craft brewery might include:
- Brewing Yield (%)
- Batch Cycle Time (Days)
- Cost per Liter ($)
- Sales per Channel
- Customer Satisfaction Index
Key Features of the Craft Brewery KPI Dashboard in Google Sheets
- Interactive Controls: Dropdowns and slicers allow instant filtering by month or KPI.
- MTD & YTD Comparison: Evaluate performance for any period in seconds.
- Automatic Calculations: Built-in formulas ensure accurate results with minimal manual work.
- Visual Performance Indicators: Arrows and colors make trends easy to interpret.
- Historical Tracking: Compare current metrics with last year’s numbers.
- User-Friendly Interface: Designed for managers, analysts, and team members — no technical expertise needed.
- Cloud Collaboration: Access and update data in real-time from anywhere.
- Customizable Framework: Add or remove KPIs based on your brewery’s goals.
Advantages of Using a Craft Brewery KPI Dashboard
Implementing this Google Sheets dashboard offers numerous advantages for craft breweries of all sizes.
- Centralized Data Management
- All brewery data — from production metrics to financial performance — is consolidated in one place, ensuring accuracy and easy access.
- Real-Time Monitoring
- Since it’s cloud-based, team members can track updates instantly. No more delays waiting for reports or manual summaries.
- Better Decision-Making
- Visual trends, charts, and arrows make it easier to spot issues early — such as increasing production costs or declining yields.
- Improved Efficiency
- By comparing actual vs target performance, managers can take corrective actions quickly and avoid costly inefficiencies.
- Enhanced Collaboration
- Multiple users can work together in the same file, updating their respective sections simultaneously.
- Customization Flexibility
- Every brewery has unique KPIs — you can easily modify, add, or delete them as per your business needs.
- Cost-Effective and Accessible
- No need for expensive BI software — Google Sheets offers a free and reliable platform to manage all KPI tracking needs.
How to Use the Dashboard Effectively
To get the most out of the Craft Brewery KPI Dashboard, follow these steps:
- Start by defining your KPIs.
Identify what matters most — production volume, fermentation loss, packaging yield, sales growth, etc. - Input baseline data.
Use the Actual Numbers Input sheet to record your first set of monthly data. - Set achievable targets.
Enter realistic MTD and YTD goals in the Target sheet. - Compare with historical data.
Add previous year’s performance metrics for better insights into growth trends. - Use visual cues wisely.
Pay attention to the arrows and conditional formatting on the dashboard to spot areas of improvement. - Update regularly.
Keep data current to maintain accuracy and relevance of insights. - Share with your team.
Collaborate across departments — production, marketing, and sales — to ensure all KPIs align with company objectives.
Best Practices for Craft Brewery KPI Tracking
Follow these best practices to ensure your dashboard delivers maximum value:
- Keep KPIs clear and measurable. Avoid vague metrics — define specific goals.
- Standardize data entry. Use consistent formats for all sheets.
- Validate input fields. Prevent errors using data validation lists and ranges.
- Review trends monthly. Regular reviews promote proactive decision-making.
- Use conditional formatting smartly. Visual cues make data easier to read and interpret.
- Secure your data. Share with restricted access and maintain backup copies.
- Continuously improve. As your brewery grows, revisit and refine your KPIs to match evolving business goals.
Opportunities for Improvement
Even though the Craft Brewery KPI Dashboard in Google Sheets is comprehensive, you can enhance it further by:
- Integrating with Google Forms for automated data input.
- Adding macros or Google Apps Script for advanced automation.
- Including financial KPIs such as profit margin or ROI.
- Creating region-specific filters if your brewery serves multiple markets.
- Embedding charts in Google Slides for quick presentation use.
Conclusion
The Craft Brewery KPI Dashboard in Google Sheets is a practical, scalable, and affordable solution for brewery owners and managers who want full control over their business performance.
It simplifies data management, encourages collaboration, and empowers decision-makers with real-time insights — all without needing any advanced software.
By adopting this tool, craft breweries can focus less on managing spreadsheets and more on brewing exceptional beers while maintaining profitability and operational excellence.
Frequently Asked Questions (FAQs)
- What KPIs should a craft brewery track?
- Some essential KPIs include Production Volume, Brewing Yield, Cost per Liter, Sales Growth, and Waste Percentage. You can also track Customer Satisfaction and Delivery Timeliness.
- Can this dashboard be used by small breweries?
- Absolutely! It’s designed for breweries of all sizes. You can scale up or down the number of KPIs as needed.
- Is the dashboard customizable?
- Yes. You can add new KPIs, change visuals, or adjust formulas to match your brewery’s performance metrics.
- How often should I update the data?
- Ideally, you should update your data at the end of each month. However, weekly updates provide even more accurate tracking.
- Does it require any advanced technical skills?
- No. The dashboard works entirely within Google Sheets using built-in formulas and charts. Anyone familiar with spreadsheets can manage it easily.
- Can multiple users access the same dashboard?
- Yes. Google Sheets supports real-time collaboration, allowing team members to view and edit data simultaneously.
- What makes this better than Excel?
- While Excel offers powerful features, Google Sheets provides live collaboration, cloud storage, and easier sharing — making it more convenient for teams.
Visit our YouTube channel to learn step-by-step video tutorials