Running a rehabilitation center is not just about providing quality care — it’s also about measuring and improving outcomes, managing operations efficiently, and ensuring sustainability. To achieve these goals, having access to real-time performance insights is essential.
That’s where the Rehabilitation Center KPI Dashboard in Google Sheets becomes a game-changer. This ready-to-use, interactive dashboard enables healthcare administrators, therapists, and management teams to monitor key performance indicators (KPIs) with ease, ensuring informed decision-making and continuous improvement.
In this article, we’ll explore everything about this powerful dashboard — its structure, features, advantages, usage, and best practices — all designed to help rehabilitation centers operate at their full potential.
Click to buy Rehabilitation Center KPI Dashboard in Google Sheets
What Is a Rehabilitation Center KPI Dashboard in Google Sheets?
A Rehabilitation Center KPI Dashboard is a visual reporting tool built in Google Sheets that tracks and analyzes key metrics related to patient care, therapy sessions, resource utilization, and operational efficiency.
Unlike manual tracking systems or complex software, this dashboard consolidates all relevant KPIs into a single, dynamic sheet. With just a few clicks, teams can monitor patient progress, evaluate staff performance, and compare monthly or yearly outcomes.
Because it’s developed in Google Sheets, it provides cloud-based access, real-time collaboration, and zero setup cost — making it ideal for small and medium rehabilitation facilities.
Key Features of the Rehabilitation Center KPI Dashboard in Google Sheets
The dashboard is divided into six well-structured worksheet tabs, each serving a specific analytical purpose. Let’s explore each one.
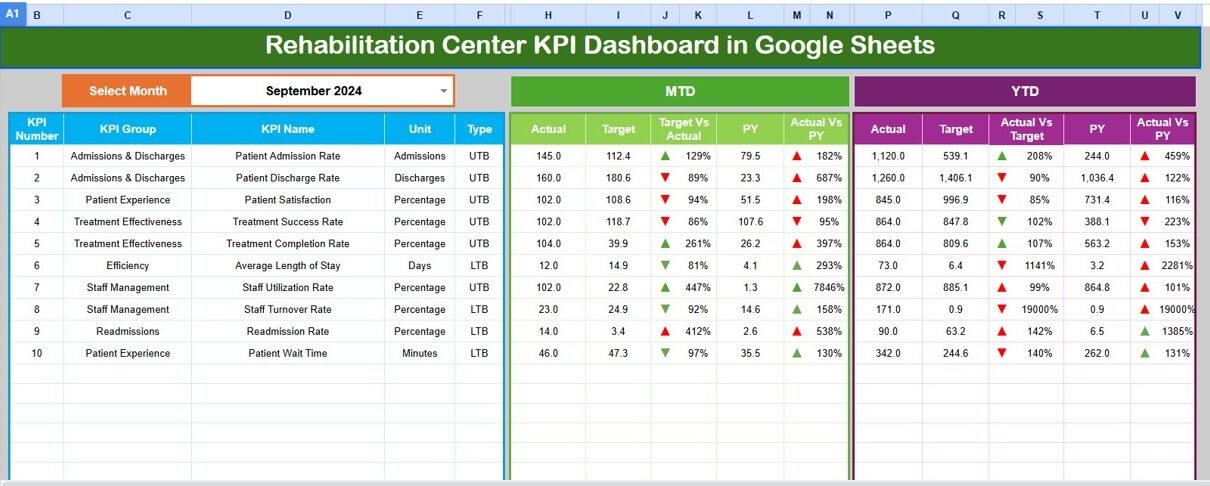
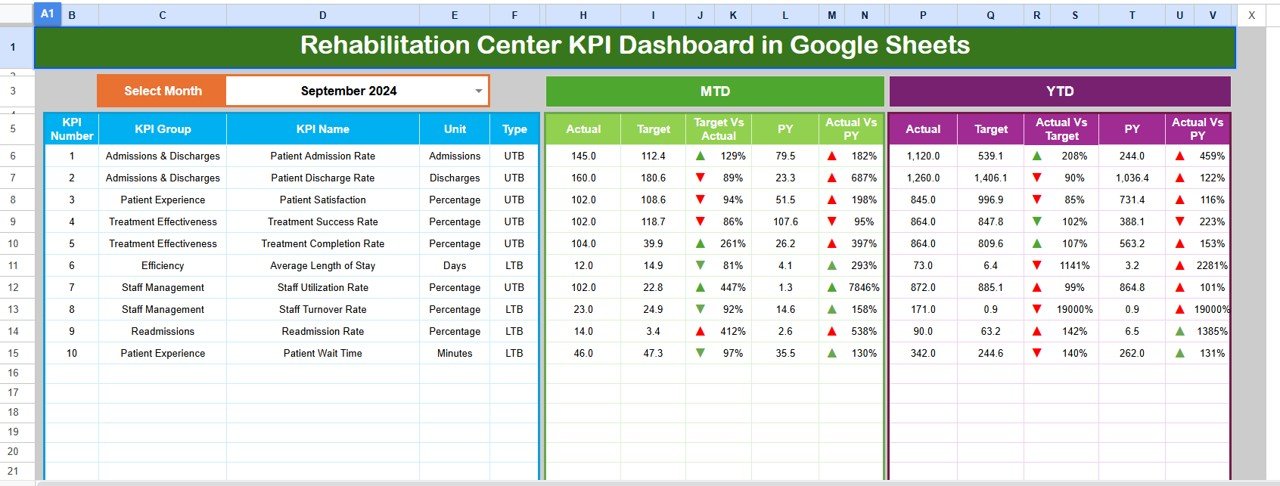
Dashboard Sheet Tab
This is the main page of the dashboard — the visual centerpiece.
- It displays all key KPIs at a glance.
- A Month Selector (cell D3) allows you to pick any month, and all figures instantly update.
- You can view MTD (Month-To-Date) and YTD (Year-To-Date) results for each KPI.
- It compares Actual, Target, and Previous Year (PY) data.
- Conditional formatting arrows highlight performance — 🔼 (improvement) and 🔽 (decline).
This makes it extremely easy to identify whether KPIs are trending positively or need attention.
Click to buy Rehabilitation Center KPI Dashboard in Google Sheets
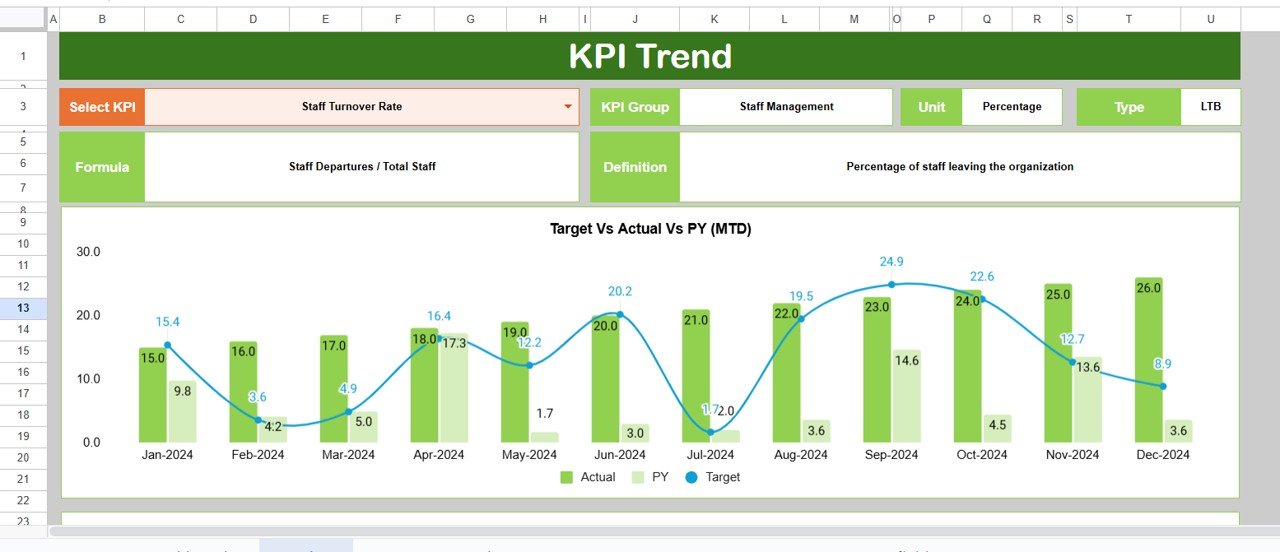
Trend Sheet Tab
The Trend Sheet is the analytical powerhouse of the dashboard.
- A drop-down menu in cell C3 lets you select any KPI.
- It automatically displays details like KPI Group, Unit, Type (UTB or LTB), Formula, and Definition.
- The sheet includes MTD and YTD trend charts comparing Actual, Target, and PY data.
This visual approach helps management identify performance trends and seasonal variations effectively.
Click to buy Rehabilitation Center KPI Dashboard in Google Sheets
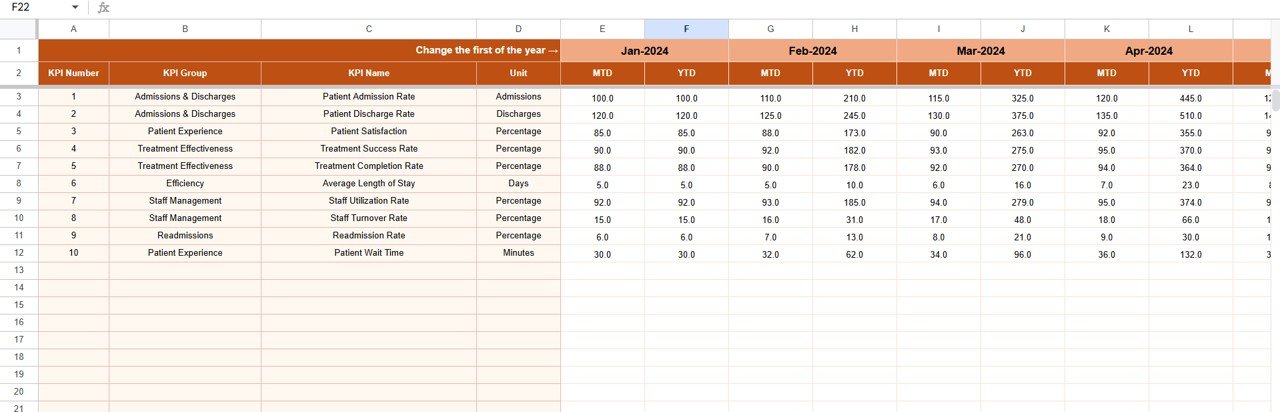
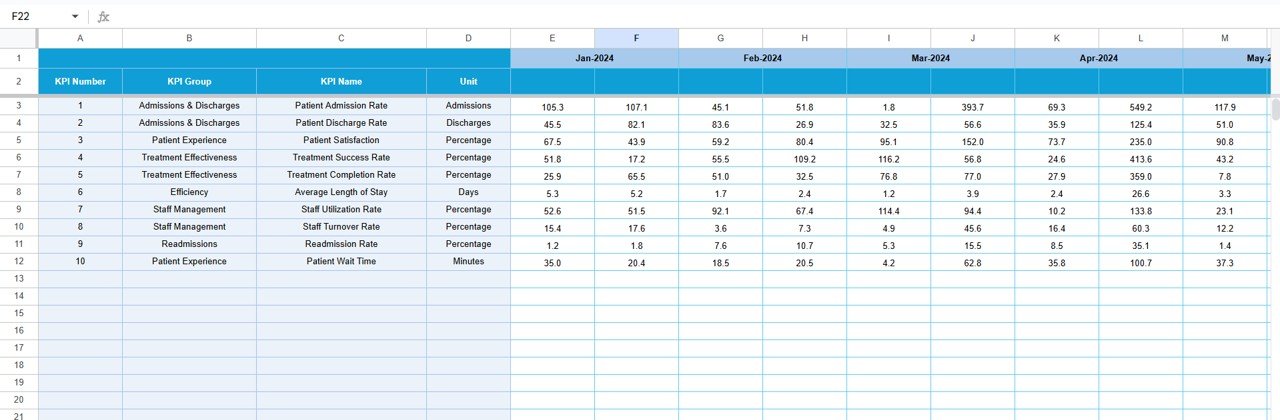
Actual Numbers Input Sheet
This is the data entry sheet where you record the actual monthly performance figures.
- It covers both MTD and YTD numbers.
- You can modify the month range by editing cell E1, which defines the first month of the year.
- Each KPI’s actual results can be entered in a structured, consistent manner for accurate tracking.
Click to buy Rehabilitation Center KPI Dashboard in Google Sheets
Target Sheet Tab
Here you enter your monthly target values for all KPIs.
- It contains both MTD and YTD targets.
- These targets are automatically compared with actual values in the dashboard view.
- The variance analysis provides clear visibility into how well the team is meeting goals.
Click to buy Rehabilitation Center KPI Dashboard in Google Sheets
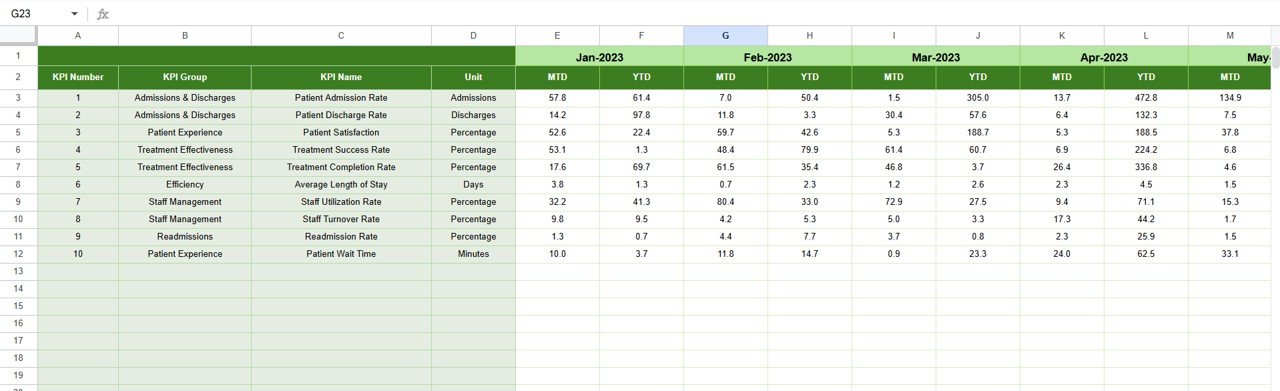
Previous Year Numbers Sheet
This tab stores historical data from the prior year.
- The system uses these values to calculate PY vs Actual differences.
- Comparing previous-year data helps identify improvement areas and recurring issues.
KPI Definition Sheet
The foundation of the dashboard lies in this sheet.
It defines every KPI with details like:
- KPI Name
- KPI Group
- Unit of Measurement
- Formula
- Definition
- KPI Type (UTB or LTB)
This tab serves as both a reference and a data dictionary, ensuring every user understands the metrics clearly.
Why KPIs Are Crucial for Rehabilitation Centers
Before diving deeper, let’s quickly understand why KPIs matter so much in rehabilitation management.
Rehabilitation centers operate in a high-stakes environment — patient recovery, staff performance, resource optimization, and financial health are all interconnected. Key Performance Indicators (KPIs) provide measurable values to assess these aspects.
By tracking KPIs, a center can:
- Measure patient improvement rates
- Optimize therapist workloads
- Ensure timely discharge and follow-up
- Maintain compliance with health standards
- Improve cost-effectiveness and operational transparency
Advantages of Using the Rehabilitation Center KPI Dashboard in Google Sheets
Let’s explore why this Google Sheets dashboard is a must-have tool for every rehabilitation facility.
Real-Time Performance Tracking
The dashboard updates instantly as you modify data. Managers can view current MTD and YTD performance without waiting for manual reports.
Simplified Data Visualization
Interactive charts and colored arrows make performance interpretation quick and intuitive. Even non-technical users can grasp insights easily.
Cost-Effective and Cloud-Based
No need for expensive software. Google Sheets is free, accessible from anywhere, and supports simultaneous collaboration.
Easy Customization
You can modify KPI names, targets, and formulas to match your facility’s needs — whether it’s physiotherapy outcomes, patient satisfaction, or occupancy rates.
Improved Accountability
With transparent metrics, staff performance and program outcomes become measurable. This promotes a culture of responsibility and achievement.
Historical Comparison
Tracking performance across years helps identify growth patterns and pinpoint long-term improvement opportunities.
Data-Driven Decision Making
The dashboard transforms raw numbers into actionable insights — allowing you to make informed strategic and operational decisions.
How to Use the Rehabilitation Center KPI Dashboard Effectively
To make the most out of this dashboard, follow these practical steps:
- Step 1: Set Up KPI Definitions
- Start by listing all the KPIs relevant to your rehabilitation center — such as:
- Patient Recovery Rate
- Therapy Session Attendance
- Readmission Rate
- Bed Occupancy Percentage
- Patient Satisfaction Score
- Define each KPI’s formula, unit, and type (UTB/LTB) in the KPI Definition Sheet.
- Step 2: Enter Previous Year Data
- Input last year’s monthly results in the Previous Year Sheet. This will serve as a baseline for comparison.
- Step 3: Add Target Values
- In the Target Sheet, set monthly and annual targets for each KPI based on realistic benchmarks.
- Step 4: Record Actual Numbers
- Enter the ongoing month’s actual MTD and YTD values in the Actual Numbers Sheet.
- Step 5: Review the Dashboard
- Go to the Dashboard Tab, select the month from D3, and analyze your results. Observe trends, variances, and conditional arrows for quick insights.
- Step 6: Analyze Trends
- Use the Trend Sheet to understand how each KPI behaves over time and identify possible issues early, treatment outcomes, and financial sustainability.
Best Practices for Rehabilitation Center KPI Tracking
Following the right practices ensures accuracy and long-term effectiveness.
Keep KPIs Relevant
Only track KPIs that align with your rehabilitation center’s goals. Avoid overwhelming the dashboard with unnecessary metrics.
Update Data Consistently
Regular updates ensure accurate MTD and YTD analysis. Schedule monthly data entry reviews.
Use Conditional Formatting Wisely
Colors and arrows guide quick decisions. Keep formatting simple — green for improvement, red for decline.
Review Monthly Trends
Compare each month’s performance with the previous year to recognize progress patterns and seasonal trends.
Involve All Departments
From therapists to finance staff, involve all stakeholders. This builds shared accountability and holistic improvement.
Automate Where Possible
Use formulas like AVERAGE(), SUM(), and SPARKLINE() in Google Sheets for semi-automation and improved efficiency.
Protect Sensitive Data
Use Google Sheets permissions to ensure only authorized users can edit or view confidential performance information.
Opportunities for Improvement
Even with its many benefits, there’s always room for improvement. Here are a few ideas to enhance the dashboard further:
- Integrate Google Forms for automated data entry from departments.
- Add dynamic charts that update automatically when data changes.
- Include department-level KPIs (e.g., physiotherapy, occupational therapy, counseling).
- Add a benchmarking feature to compare results against national averages.
- Use Google App Script for automation of data imports and alerts.
Conclusion
The Rehabilitation Center KPI Dashboard in Google Sheets empowers organizations to transform raw data into actionable insights. It enhances transparency, supports timely decision-making, and promotes a culture of continuous improvement.
By tracking metrics like patient recovery, staff efficiency, and satisfaction rates, rehabilitation centers can measure success not just in numbers but in meaningful outcomes.
Whether you’re managing a small clinic or a large rehabilitation network, this dashboard offers a structured, affordable, and highly effective way to stay ahead.
Frequently Asked Questions (FAQs)
What is the purpose of a KPI dashboard in a rehabilitation center?
It helps monitor and evaluate performance metrics such as patient recovery, therapist productivity, and operational efficiency, enabling data-driven decisions.
Can this dashboard be customized for different types of rehabilitation centers?
Yes, absolutely. You can modify the KPI names, formulas, and charts for various specialties such as physical rehab, addiction recovery, or occupational therapy.
Do I need coding skills to use this dashboard?
No. The entire system works in Google Sheets using formulas, drop-downs, and charts. Anyone familiar with basic spreadsheets can use it.
How often should I update data in the dashboard?
Ideally, update data monthly to keep MTD and YTD performance accurate. Weekly updates are even better for fast-paced operations.
Is this dashboard suitable for multi-branch rehabilitation networks?
Yes. You can extend it by adding branch identifiers or merging multiple centers’ data for consolidated reporting.
Can I share the dashboard with my team?
Yes. Since it’s cloud-based, you can share it via Google Drive with view or edit permissions as required.
What kind of charts are included in the dashboard?
The dashboard includes trend lines, comparison bars, and conditional arrows for visualizing KPI progress across months.
Visit our YouTube channel to learn step-by-step video tutorials
Watch the step-by-step video tutorial:
Click to buy Rehabilitation Center KPI Dashboard in Google Sheets