Agriculture plays a crucial role in feeding the world and supporting economies globally. With the advancement of technology, the agricultural industry has witnessed significant improvements in efficiency, productivity, and sustainability. One of the most effective tools for achieving these improvements is the use of Key Performance Indicators (KPIs). An Agriculture KPI Dashboard in Google Sheets helps agricultural businesses track, analyze, and optimize various aspects of their operations, from crop yield to resource management.
In this article, we’ll explore the importance of using an Agriculture KPI Dashboard in Google Sheets, the key features of the template, and how it can help agricultural businesses monitor performance and make informed decisions.
What is an Agriculture KPI Dashboard?
An Agriculture KPI Dashboard is a tool used to track and measure the performance of various activities in the agricultural industry. It consolidates data on important metrics, helping farmers, agribusiness managers, and stakeholders evaluate the performance of farming operations in real time. Google Sheets provides a flexible, cloud-based platform to create and maintain this dashboard, making it easy to input data, view trends, and collaborate with teams.
Key Features of the Agriculture KPI Dashboard in Google Sheets
The Agriculture KPI Dashboard in Google Sheets template includes several essential features designed to track the most important KPIs in agriculture. Here’s a breakdown of the key features:
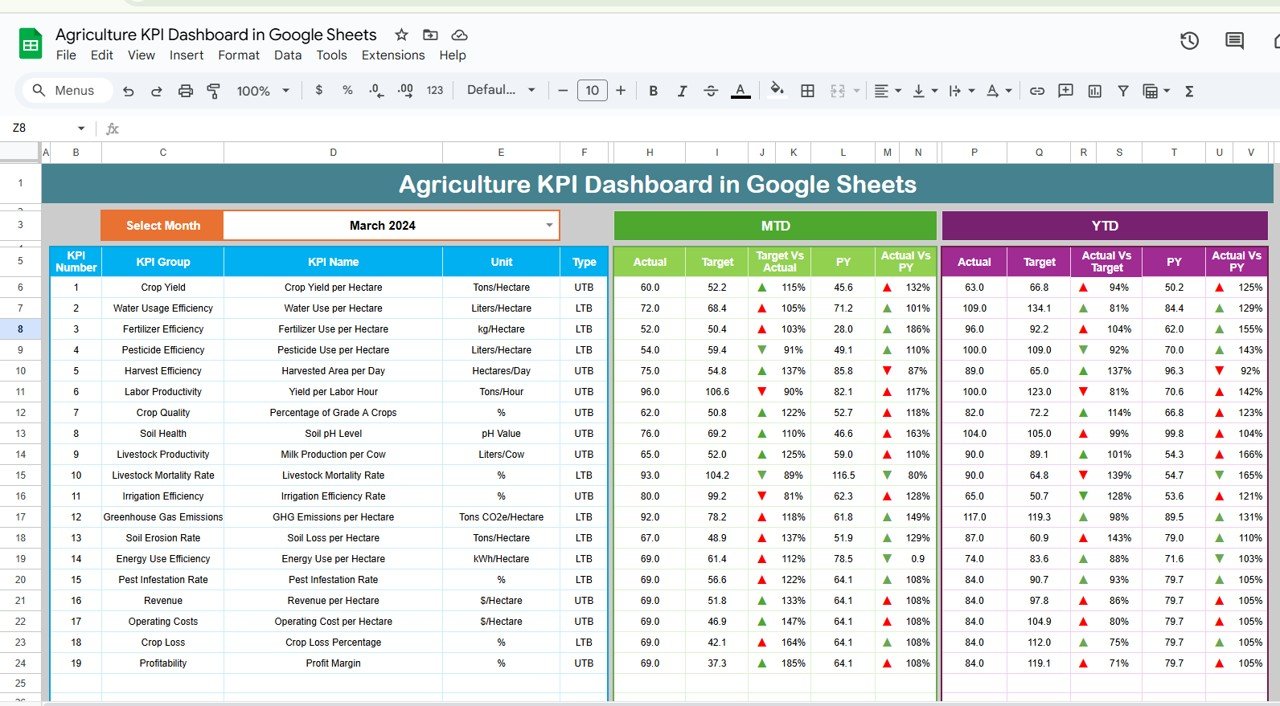
1. Dashboard Sheet Tab
The Dashboard Sheet is the core of the KPI dashboard. It provides a consolidated view of all key performance indicators, helping you monitor progress toward goals. Key elements include:
-
Month Selection: In cell D3, you can select the month you want to track from a dropdown list. The entire dashboard will update based on the selected month, ensuring that you always see the most current data.
-
MTD (Month-to-Date) and YTD (Year-to-Date) Data: The dashboard shows both MTD and YTD data for each KPI. This allows you to compare performance over the course of the current month and year.
-
Target vs Actual: The dashboard compares the actual performance against the set targets. This helps you see how well you are meeting your goals.
-
Previous Year Comparison: By comparing current performance to previous years, you can evaluate your progress over time.
-
Conditional Formatting: The dashboard uses visual indicators (up and down arrows) to highlight whether performance is above or below expectations.

Click to buy Agriculture KPI Dashboard in Google Sheets
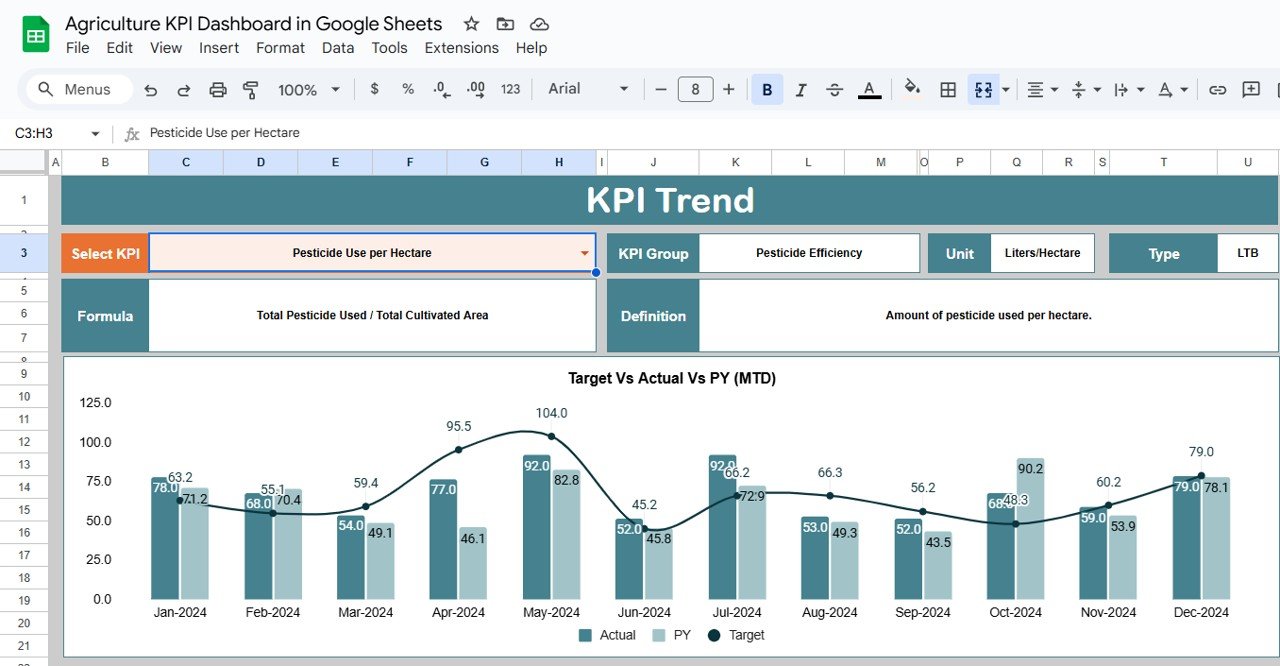
2. KPI Trend Sheet Tab
This sheet provides detailed information on the KPIs. It includes:
-
KPI Name Selection: In cell C3, you can select the KPI you want to analyze from a dropdown menu.
-
KPI Group: The dashboard categorizes KPIs into different groups to provide more context (e.g., Crop Yield, Water Usage, Resource Management).
-
KPI Unit: Each KPI has a unit of measurement (e.g., kilograms, liters, hectares) to ensure accurate data reporting.
-
KPI Type: The dashboard classifies KPIs as either “Lower is Better” or “Upper is Better,” helping you interpret performance correctly.
-
Formula and Definition: For each KPI, the sheet includes a formula for calculating it and a brief definition to provide clarity on its significance.
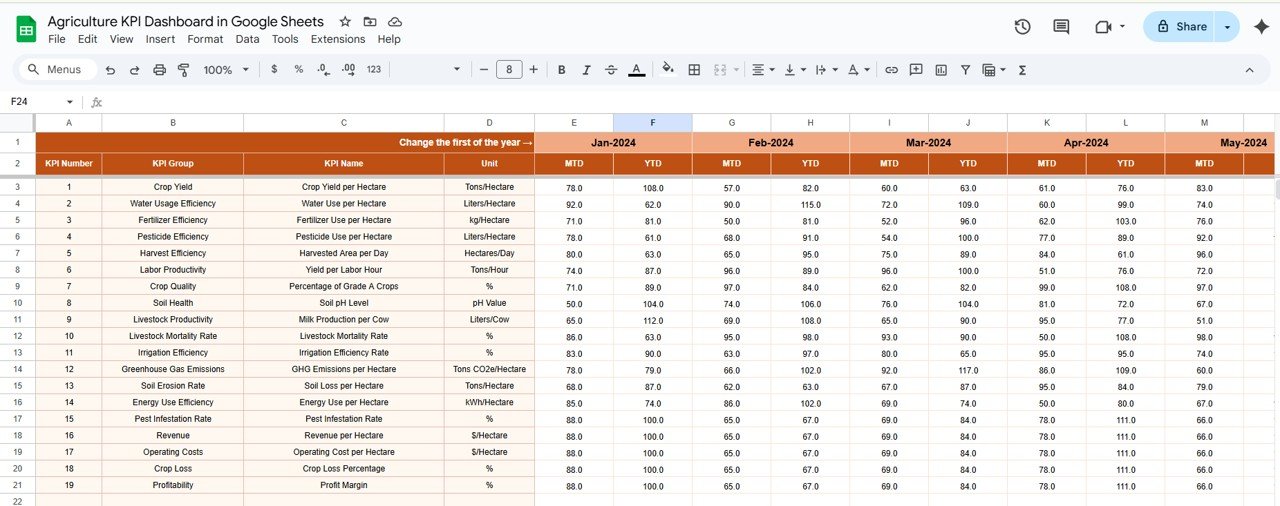
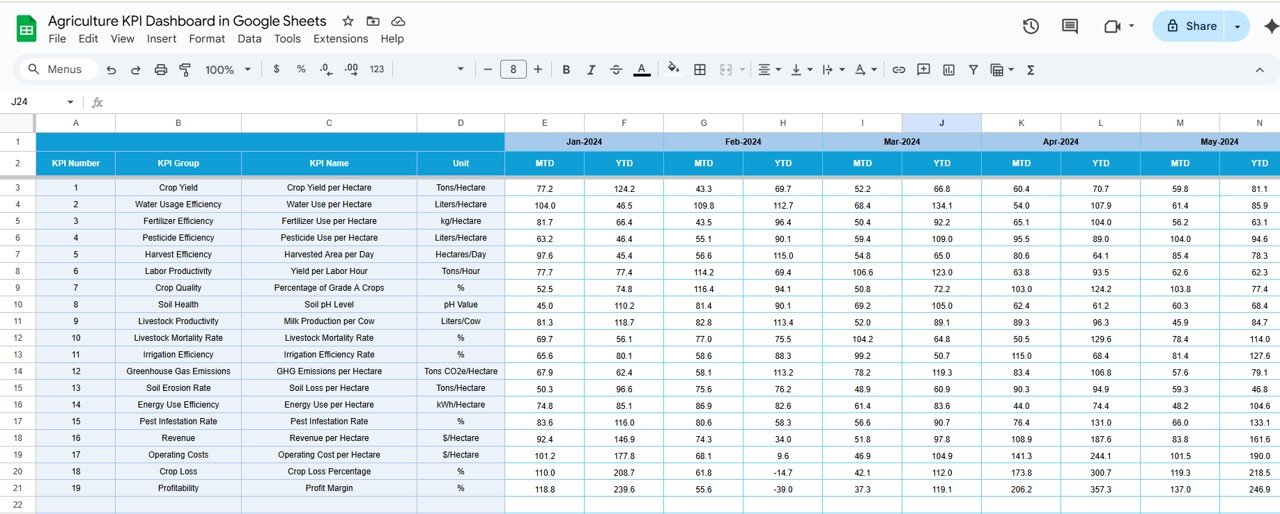
3. Actual Number Sheet Tab
This tab allows you to input the actual performance numbers for both MTD and YTD:
-
Month Selection: You can easily change the month in cell E1, and the sheet will update to reflect the data for that month.
-
Data Entry: Enter the actual performance data for each KPI, making it easy to track your operations and adjust strategies as needed.
Click to buy Agriculture KPI Dashboard in Google Sheets
4. Target Sheet Tab
Here, you can set the target numbers for each KPI, both for MTD and YTD. This ensures that your goals are clear and measurable, allowing you to compare your progress against the targets you’ve set.
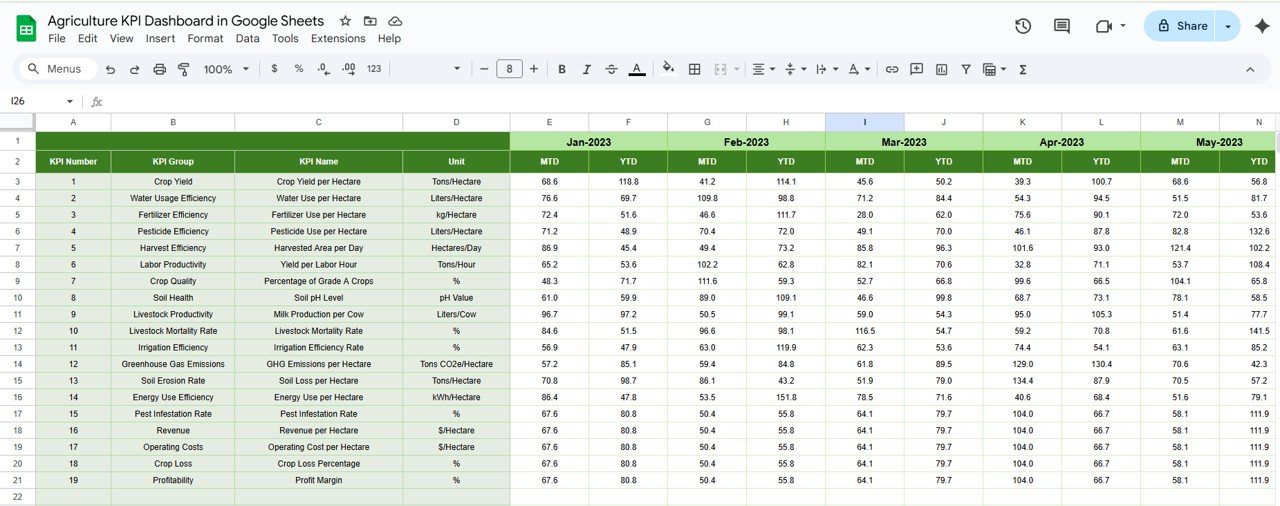
5. Previous Year Number Sheet Tab
This sheet is where you input the data from the previous year for comparison purposes. By comparing the current year’s data to last year’s, you can evaluate how well your operations are improving.
Click to buy Agriculture KPI Dashboard in Google Sheets
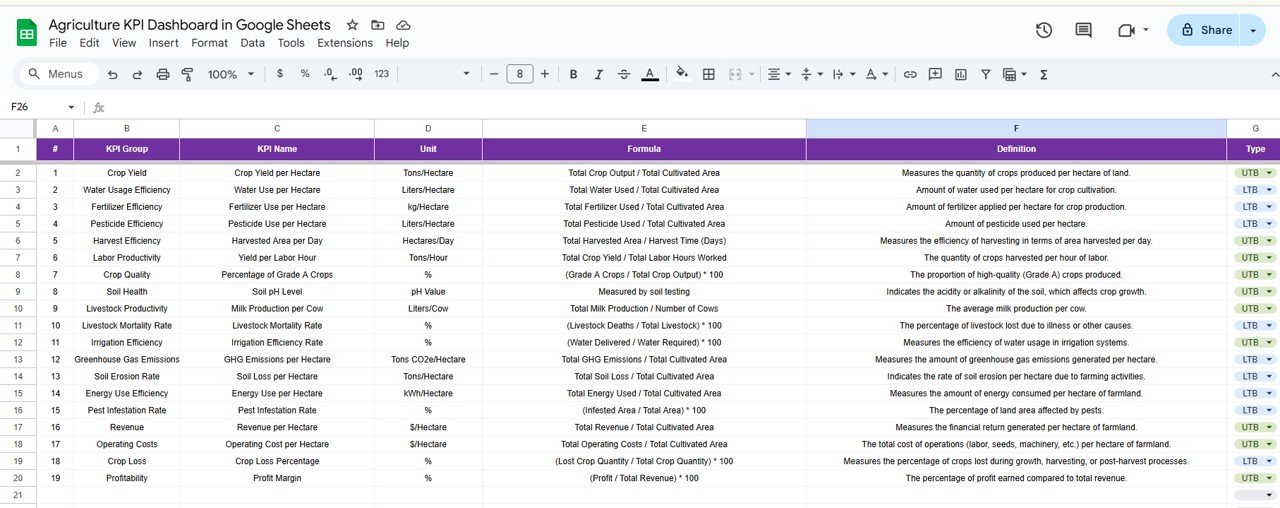
6. KPI Definition Sheet Tab
The KPI Definition sheet provides all the necessary details for each KPI:
-
KPI Name
-
KPI Group
-
Unit
-
Formula
-
KPI Definition
This sheet serves as a reference to ensure everyone using the dashboard understands what each KPI measures and how it is calculated.
Advantages of Using the Agriculture KPI Dashboard in Google Sheets
Click to buy Agriculture KPI Dashboard in Google Sheets
Using the Agriculture KPI Dashboard in Google Sheets offers several key advantages:
-
Centralized Data Tracking: All the data for your KPIs is stored in one central location. This eliminates the need for multiple spreadsheets or complex systems, streamlining your operations.
-
Real-Time Insights: With Google Sheets, changes made to the dashboard are instantly reflected across all tabs. This ensures that you have access to real-time data, enabling timely decisions.
-
Customization: The template is fully customizable. You can add new KPIs, modify existing ones, and adjust the layout to meet the specific needs of your agricultural operations.
-
Collaboration: As a cloud-based tool, Google Sheets allows multiple users to access and edit the dashboard simultaneously. This enhances collaboration across teams and departments.
-
Data Visualization: The use of conditional formatting (up/down arrows) and other visual indicators makes it easier to interpret performance data at a glance.
-
Cost-Effective: Google Sheets is free to use, making it a cost-effective solution for businesses looking to track agricultural KPIs without investing in expensive software.
Opportunity for Improvement in the Agriculture KPI Dashboard
While the Agriculture KPI Dashboard in Google Sheets offers many advantages, there are always opportunities for improvement:
-
Automation: By integrating Google Sheets with other tools or using Google Apps Script, you can automate data entry, KPI calculations, and even trigger alerts for specific conditions (e.g., when a KPI falls below a threshold).
-
Advanced Analytics: Incorporating advanced analytics like trend analysis, forecasting, or regression models can provide deeper insights into your agricultural performance, helping you predict future outcomes and plan accordingly.
-
Integration with IoT Devices: Many agricultural businesses use Internet of Things (IoT) devices to collect data on weather conditions, soil moisture, and crop health. Integrating these devices with your Google Sheets dashboard would allow for automated, real-time data updates.
-
Mobile Accessibility: Optimizing the dashboard for mobile devices can allow managers and field workers to easily access and update data from anywhere, enhancing flexibility.
Best Practices for Using the Agriculture KPI Dashboard
Click to buy Agriculture KPI Dashboard in Google Sheets
To maximize the effectiveness of your Agriculture KPI Dashboard, here are some best practices:
-
Update Data Regularly: Keep the dashboard current by entering the most up-to-date data for MTD and YTD. Regular updates will ensure that the dashboard provides accurate insights for decision-making.
-
Set Realistic Targets: Ensure that the targets you set for each KPI are realistic and achievable. Targets that are too ambitious may lead to frustration, while targets that are too low can hinder growth.
-
Review KPIs Frequently: Regularly review your KPIs to ensure they still align with your business goals. As your operations evolve, you may need to adjust the KPIs or introduce new ones.
-
Train Your Team: Ensure that all team members understand how to use the dashboard effectively. Proper training will help ensure accurate data entry and interpretation of results.
-
Use Visual Indicators Wisely: While conditional formatting and visual cues are helpful, be cautious not to overuse them. Keep the dashboard clean and easy to read, focusing on the most critical KPIs.
Conclusion
The Agriculture KPI Dashboard in Google Sheets is an invaluable tool for anyone in the agricultural industry looking to optimize performance, track progress, and make data-driven decisions. With its easy-to-use interface, real-time updates, and customizable features, this dashboard can help agricultural businesses stay on top of their operations and improve overall efficiency. Whether you’re tracking crop yield, resource usage, or financial performance, this dashboard gives you the insights you need to succeed.
Frequently Asked Questions (FAQs)
1. What KPIs should be included in an Agriculture KPI Dashboard?
KPIs in agriculture can include crop yield, water usage, soil health, labor efficiency, machinery performance, and financial metrics such as revenue and costs per hectare.
2. How can I integrate external data into my Agriculture KPI Dashboard?
You can use Google Sheets’ built-in functions like IMPORTRANGE or Google Apps Script to automatically import data from external sources, such as databases or APIs.
3. How often should I update the data in the Agriculture KPI Dashboard?
It’s recommended to update the dashboard at least once a week. For critical KPIs, such as crop health or weather conditions, updates should be made more frequently.
4. Can I add more KPIs to the dashboard?
Yes, the dashboard is fully customizable. You can easily add new KPIs by modifying the “KPI Definition” sheet and updating the formulas in the relevant sections.
5. Is the Agriculture KPI Dashboard mobile-friendly?
While Google Sheets is accessible on mobile devices, optimizing the dashboard layout for mobile use can improve the user experience for field workers or managers on the go.
Visit our YouTube channel to learn step-by-step video tutorials
Youtube.com/@NeotechNavigators
Watch the step-by-step video Demo: