In the fast-paced automotive industry, managing and tracking key performance indicators (KPIs) is critical for success. These metrics help businesses assess the effectiveness of various processes, from sales performance to manufacturing efficiency. A well-structured KPI dashboard allows for real-time insights and data-driven decision-making.
In this article, we will explore the concept of the Automotive KPI Dashboard in Google Sheets—a ready-to-use template that helps automotive businesses track important KPIs efficiently. This guide will cover all essential details, including the list of KPIs with their definitions, formulas, and whether they should be “lower the better” or “upper the better.”
Table of Contents
ToggleKey Features of the Automotive KPI Dashboard in Google Sheets
Before diving into the specifics of the KPIs, let’s first understand the key features of this dashboard template:
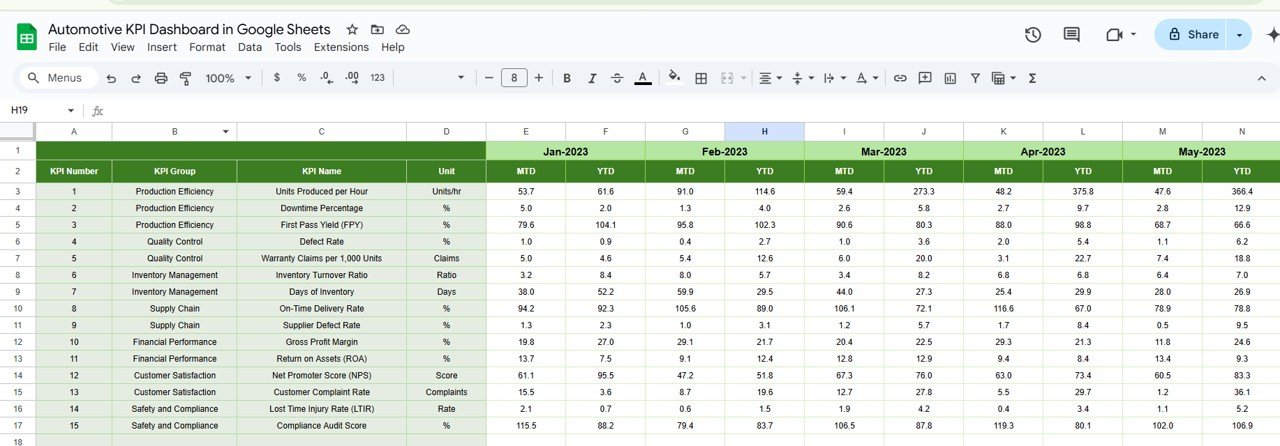
Dashboard Sheet Tab
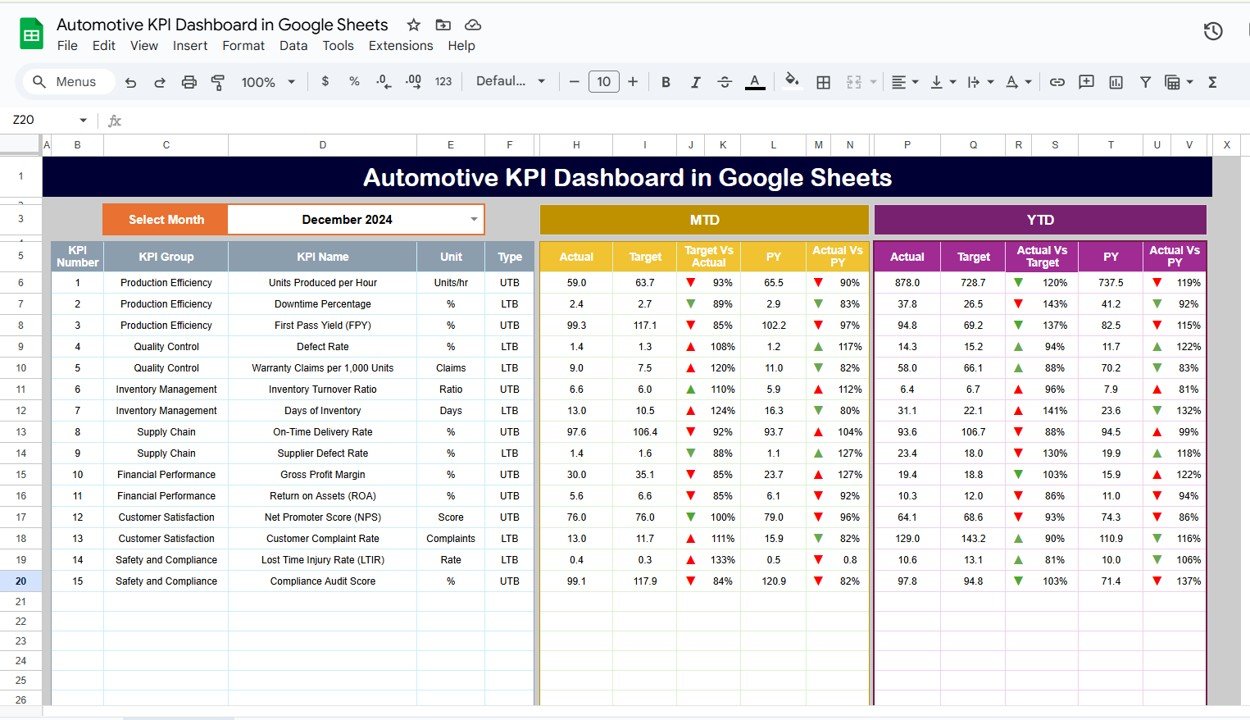
The dashboard serves as the central hub for viewing all KPIs. Here, you can select the month from a drop-down menu (cell D3), and the dashboard will dynamically update to show the current month’s data. It includes:
- MTD (Month-to-Date) Actual vs Target: Displays how well the company is meeting its monthly goals.
- YTD (Year-to-Date) Actual vs Target: Provides a cumulative view of the year’s performance.
- Comparison with Previous Year: Offers insights into performance relative to the same period in the previous year, with conditional formatting (up or down arrows) to highlight improvements or declines.

Click to buy Automotive KPI Dashboard in Google Sheets
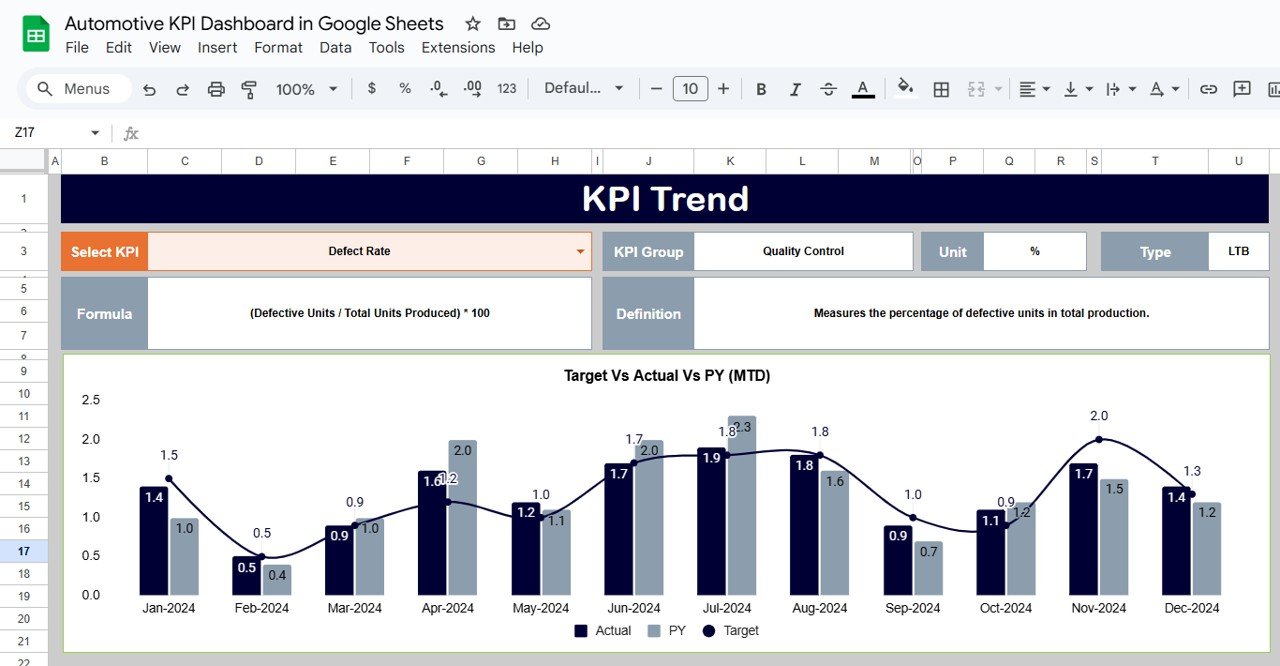
KPI Trend Sheet Tab
This tab allows users to select specific KPIs from a drop-down list (cell C3). For each KPI, the dashboard displays:
- KPI Group
- Unit of Measure
- Type (Lower the Better or Upper the Better)
- Formula to calculate the KPI
- KPI Definition
Click to buy Automotive KPI Dashboard in Google Sheets
Actual Numbers Sheet Tab
Here, you input the actual numbers for both MTD and YTD, which will be used in the dashboard for comparison. The month selection is available in cell E1, allowing the user to input data for any given month.

Target Sheet Tab
In this tab, you enter the target values for each KPI for both MTD and YTD. This helps track progress and set performance benchmarks.

Click to buy Automotive KPI Dashboard in Google Sheets
Previous Year Numbers Sheet Tab
This tab holds the data for the previous year, enabling year-over-year comparisons. Enter the same type of data as the current year for accurate comparisons.
KPI Definition Sheet Tab
This sheet contains detailed information for each KPI, including:
- KPI Name
- KPI Group
- Unit of Measure
- Formula used to calculate the KPI
- Definition explaining what each KPI represents

Click to buy Automotive KPI Dashboard in Google Sheets
Advantages of Using an Automotive KPI Dashboard in Google Sheets
An Automotive KPI Dashboard in Google Sheets offers several benefits to businesses looking to monitor and improve their operations. Here are the key advantages:
- Real-Time Data Tracking: With a dynamic dashboard, you can monitor KPIs in real-time. This allows for quicker decision-making and more responsive management of operations.
- Customizable Templates: Google Sheets offers flexibility, enabling you to customize the dashboard according to your unique business needs. You can add or remove KPIs and adjust formulas as required.
- Cost-Effective: Unlike other business intelligence tools, Google Sheets is free to use, making it an affordable solution for small and medium-sized automotive businesses.
- Collaboration Features: Being cloud-based, Google Sheets allows for easy collaboration. Multiple team members can work on the dashboard simultaneously, ensuring that all relevant stakeholders stay updated.
- Accessibility: Google Sheets can be accessed from any device with internet connectivity, allowing your team to track KPIs from the office, on the go, or remotely.
Opportunities for Improvement in the Automotive KPI Dashboard
While the Automotive KPI Dashboard in Google Sheets is a powerful tool, there are always opportunities to enhance its functionality:
Automating Data Entry
-
Current Challenge: Manual data entry for KPIs like actual numbers and targets can be time-consuming.
-
Opportunity: Integrate Google Sheets with other systems (e.g., CRM, ERP) to automate the data entry process. This would eliminate human error and reduce administrative burden.
Enhanced Visualizations
-
Current Challenge: While the dashboard provides valuable insights, some users may prefer a more visually engaging presentation.
-
Opportunity: Implement advanced data visualizations like sparklines, bar charts, and pie charts to make the data easier to understand and more visually appealing.
Advanced Reporting Features
-
Current Challenge: The current dashboard provides basic reporting capabilities.
-
Opportunity: Enhance reporting features by adding customizable report generation and export options, such as PDF or automated email summaries.
Best Practices for Using the Automotive KPI Dashboard
Click to buy Automotive KPI Dashboard in Google Sheets
To maximize the effectiveness of the Automotive KPI Dashboard in Google Sheets, consider the following best practices:
- Regularly Update the Data: Ensure that data in the dashboard is updated regularly, ideally at the beginning or end of each month. This will keep the dashboard accurate and reflective of current performance.
- Use Clear and Consistent Naming Conventions: Use consistent naming for KPIs, units, and formulas across all tabs to avoid confusion and maintain clarity in reporting.
- Set Realistic Targets: When setting targets for each KPI, make sure they are achievable and based on historical performance data. Unrealistic targets can lead to frustration and ineffective performance management.
- Encourage Collaboration: Share the dashboard with key team members and encourage collaboration. Google Sheets’ collaborative features allow for easy sharing and real-time updates, fostering teamwork.
- Leverage Conditional Formatting: Use conditional formatting (such as up/down arrows) to provide immediate visual cues about performance trends. This makes it easier to spot areas requiring attention.
Conclusion
The Automotive KPI Dashboard in Google Sheets is a powerful tool for tracking key performance metrics across various aspects of the automotive business. By utilizing this dashboard, businesses can monitor their operations efficiently, identify areas for improvement, and make data-driven decisions to drive growth and success.
Frequently Asked Questions (FAQs)
Click to buy Automotive KPI Dashboard in Google Sheets
What is a KPI in the automotive industry?
A KPI (Key Performance Indicator) is a measurable value that demonstrates how effectively a company is achieving its business objectives. In the automotive industry, KPIs could include production efficiency, vehicle defect rate, and sales conversion rate.
How can I customize my Automotive KPI Dashboard?
Google Sheets allows you to customize the dashboard by adding or removing KPIs, changing the data sources, and adjusting the visualizations to match your business needs.
How do I enter data into the Automotive KPI Dashboard?
Data for KPIs such as actual numbers and targets can be entered in the relevant tabs (Actual Numbers Sheet, Target Sheet, Previous Year Numbers Sheet) by simply inputting the required values for each month.
Can I automate the data entry process?
Yes, you can integrate Google Sheets with other systems like CRM or ERP to automatically populate data, reducing manual data entry and ensuring real-time updates.
What KPIs should I track in my automotive business?
Key KPIs for the automotive industry include production efficiency, vehicle defect rate, on-time delivery rate, inventory turnover, customer satisfaction index, and warranty claims rate.
Visit our YouTube channel to learn step-by-step video
tutorialsYoutube.com/@NeotechNavigators
Watch the step-by-step video Demo: