Managing construction projects efficiently is crucial for ensuring that they are completed on time and within budget. The Construction Dashboard in Google Sheets is a ready-to-use tool that allows construction project managers to track key metrics, monitor safety incidents, and compare budgets against actual costs. This dashboard helps you visualize the status of multiple projects, identify potential issues early, and keep everything on track.
In this article, we will explain the features of the Construction Dashboard in Google Sheets and show how it can assist you in managing your construction projects more effectively.
What is the Construction Dashboard in Google Sheets?
The Construction Dashboard in Google Sheets is a tool designed to provide comprehensive insights into various construction projects. It tracks essential metrics such as the number of projects, total budget, total costs, project phases, safety incidents, and progress percentage. This dashboard allows construction teams to monitor ongoing projects, compare actual costs with budgets, and track safety incidents by project type or region.
The dashboard consists of three key sheets:
Each sheet provides different functionalities, helping project managers stay organized and keep track of key project metrics.
Key Features of the Construction Dashboard
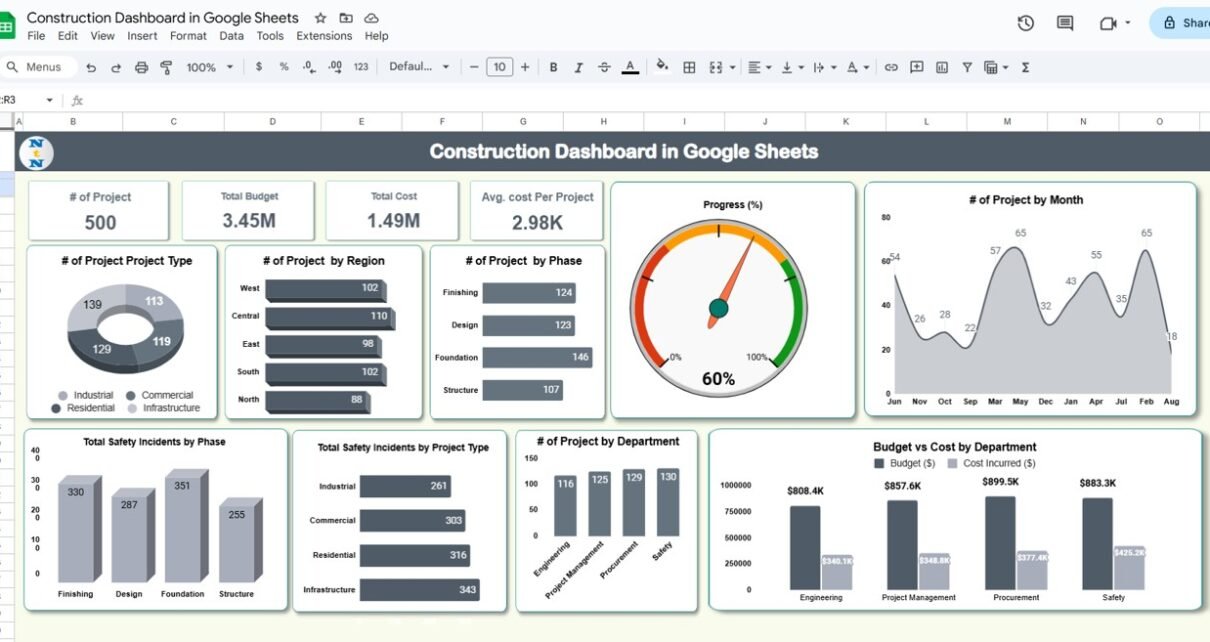
1) Dashboard Sheet Tab: High-Level Project Overview
The Dashboard Sheet Tab provides a high-level overview of the construction projects with key cards and charts:
Cards:
- # of Projects: Displays the total number of projects being tracked.
- Total Budget: Shows the total budget allocated across all projects.
- Total Cost: Displays the total cost incurred for all projects.
- Avg. Cost Per Project: Calculates the average cost for each project.
Charts:
- # of Projects by Project Type: Breaks down the number of projects by type (e.g., industrial, commercial).
- # of Projects by Region: Displays the number of projects by geographical region (e.g., north, south).
- # of Projects by Phase: Categorizes projects by their current phase (e.g., design, construction, finishing).
- Progress (%): Shows the overall progress of all projects as a percentage.
- # of Projects by Month: Displays the number of projects launched each month.
- Total Safety Incidents by Phase: Tracks safety incidents occurring during each project phase.
- Total Safety Incidents by Project Type: Displays the total number of safety incidents categorized by project type.
- # of Projects by Department: Breaks down the number of projects by department (e.g., safety, engineering).
- Budget vs. Cost by Department: Compares the budget and actual costs by department.
These charts and cards provide a comprehensive overview of the current state of all construction projects, enabling easy comparison of different projects across multiple metrics.

Click to buy Construction Dashboard in Google Sheets
2) Search Sheet Tab: Quick Data Retrieval
The Search Sheet Tab enables you to quickly search and filter data by specific criteria. Key features include:
-
Search by Search Keyword and Field Name: Allows you to search for specific project data using keywords or field names (e.g., search by “contractor” or “status”).
-
Total Record Count and Filtered Data: Displays the total number of records and the filtered data based on search criteria, making it easier to analyze specific subsets of data.
This sheet is useful for quickly finding particular project details or tracking the progress of specific projects.

Click to buy Construction Dashboard in Google Sheets
3) Data Sheet Tab: Detailed Project Information
The Data Sheet Tab stores all detailed project information, including project IDs, names, budgets, costs, and other important metrics. Key columns include:
- Project ID: A unique identifier for each project.
- Project Name: The name of the project.
- Project Type: The type of the project (e.g., industrial, residential).
- Phase: The current phase of the project (e.g., design, construction, finishing).
- Region: The geographic region where the project is located.
- Status: The current status of the project (e.g., completed, in progress).
- Department: The department responsible for the project (e.g., safety, engineering).
- Contractor: The contractor managing the project.
- Start Date: The date the project started.
- Estimated End Date: The expected completion date for the project.
- Budget ($): The total budget allocated to the project.
- Cost Incurred ($): The total cost incurred for the project so far.
- Budget Status: Indicates whether the project is within budget (e.g., within budget, over budget).
- Progress (%): The percentage of the project that has been completed.
- Safety Incidents: The number of safety incidents that occurred during the project.
- Month: The month when the project started or the current status is updated.
- Year: The year when the project started or the current status is updated.
This sheet allows you to track and manage all project details in one place, providing a comprehensive record of each project’s progress and financial status.

Click to buy Construction Dashboard in Google Sheets
Benefits of Using the Construction Dashboard
The Construction Dashboard in Google Sheets offers several key benefits:
-
Centralized Project Management: All project details, including budgets, costs, and safety incidents, are tracked in one place, making it easier to monitor and manage projects.
-
Real-Time Data: The dashboard is updated in real time, allowing you to make informed decisions based on the latest data.
-
Comprehensive Insights: The various cards and charts provide a comprehensive overview of each project’s performance, helping you track progress, costs, and safety incidents.
-
Improved Decision Making: With visualized data and easy-to-interpret charts, you can make better decisions regarding project allocation, budget adjustments, and safety improvements.
-
Time Efficiency: The ready-to-use template saves you time by providing a pre-built structure for managing your projects and budgets.
Best Practices for Using the Construction Dashboard
To get the most out of the Construction Dashboard, follow these best practices:
- Update Regularly: Ensure that all project data is updated regularly to maintain accuracy and relevance.
- Monitor Key Metrics: Pay attention to key metrics like Progress (%), Total Safety Incidents, and Budget vs. Cost to track the performance of each project.
- Review Safety Incidents: Use the Safety Incident charts to track safety performance and identify potential risks in different project phases.
- Use the Search Function: Leverage the Search Sheet Tab to quickly find specific project information or filter data based on criteria like contractor or status.
- Analyze Trends Over Time: Regularly review the Monthly Trends to monitor how projects are progressing over time, helping you spot potential delays early.
Conclusion
Click to buy Construction Dashboard in Google Sheets
The Construction Dashboard in Google Sheets is an invaluable tool for managing and tracking construction projects. With its easy-to-use interface, comprehensive data input, and powerful visualizations, this dashboard allows you to monitor key metrics such as project progress, budgets, safety incidents, and more. Whether you are overseeing a few projects or managing a large portfolio, this tool helps ensure that your projects are completed on time, within budget, and safely.
Frequently Asked Questions (FAQs)
1. How do I update the Construction Dashboard?
You can update the dashboard by entering new project data into the Data Sheet Tab. The charts and cards will automatically update based on the new data.
2. Can I track multiple projects with this dashboard?
Yes, the dashboard is designed to handle multiple projects. You can add and track as many projects as needed.
3. How do I monitor project safety?
Use the Safety Incidents chart in the Overview Page to track safety incidents and identify potential risks in various project phases.
4. Can I share the dashboard with my team?
Yes, since the dashboard is built in Google Sheets, you can easily share it with your team for real-time updates and collaboration.
5. Is the dashboard customizable for my needs?
Yes, the dashboard is fully customizable. You can modify the layout, add more fields, or adjust the charts to better suit your organization’s needs.
Visit our YouTube channel to learn step-by-step video tutorials
Youtube.com/@NeotechNavigators