Construction Project Cost Dashboard in HTML is a browser-based interactive analytics template designed for construction project managers, contractors, cost engineers, and stakeholders who need to monitor project budgets, track actual costs, analyze cost variances, and evaluate project performance from a centralized dashboard. This HTML dashboard template includes 5 interactive pages covering cost overview, cost analysis, project performance, time and trends, and a detailed data view — all opening directly in any modern web browser with zero software installation required.Construction Project Cost Dashboard in HTML
This template tracks 6 key performance indicators including Total Budgeted Cost, Total Actual Cost, Total Cost Variance, Avg Budget per Project, Total Labor Hours, and Total Change Orders. With interactive slicers and multiple analysis pages, construction professionals can drill down into specific project types, regions, phases, cost categories, contractors, and time periods to gain actionable insights for better project financial management.
Click to buy Construction Project Cost Dashboard in HTML
Key Features of Construction Project Cost Dashboard in HTML
The Construction Project Cost Dashboard in HTML includes 5 interactive dashboard pages that deliver comprehensive construction cost analytics. The Overview page displays 6 high-level KPI cards for Total Budgeted Cost, Total Actual Cost, Total Cost Variance, Avg Budget per Project, Total Labor Hours, and Total Change Orders. Interactive slicers allow filtering by Project Type, Region, Phase, Status, Cost Category, Contractor, and Project Manager with a single click.Construction Project Cost Dashboard in HTML
The dashboard provides budget vs actual cost comparison across phases and contractors to help detect overruns early, project performance tracking with status distribution and labor hours analysis, time and trend analysis with monthly cost trends and yearly comparisons, and a full data view with search, sort, pagination, and CSV export capabilities. The entire dashboard runs in any modern browser with no software installation needed.
Dashboard Pages Explanation
1. Overview Page
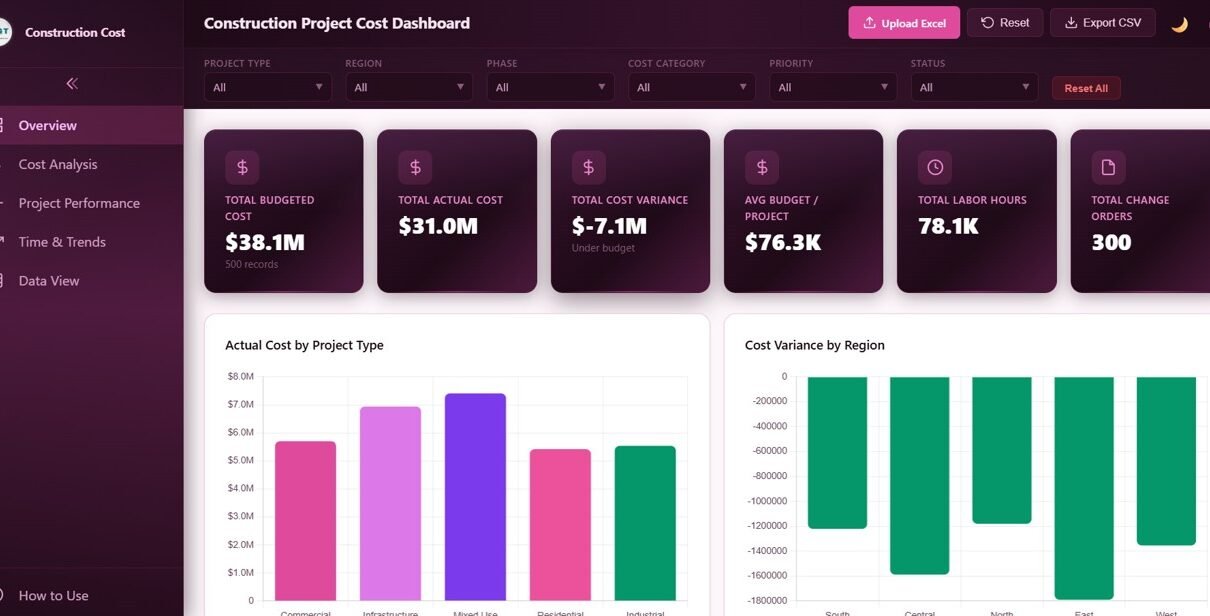
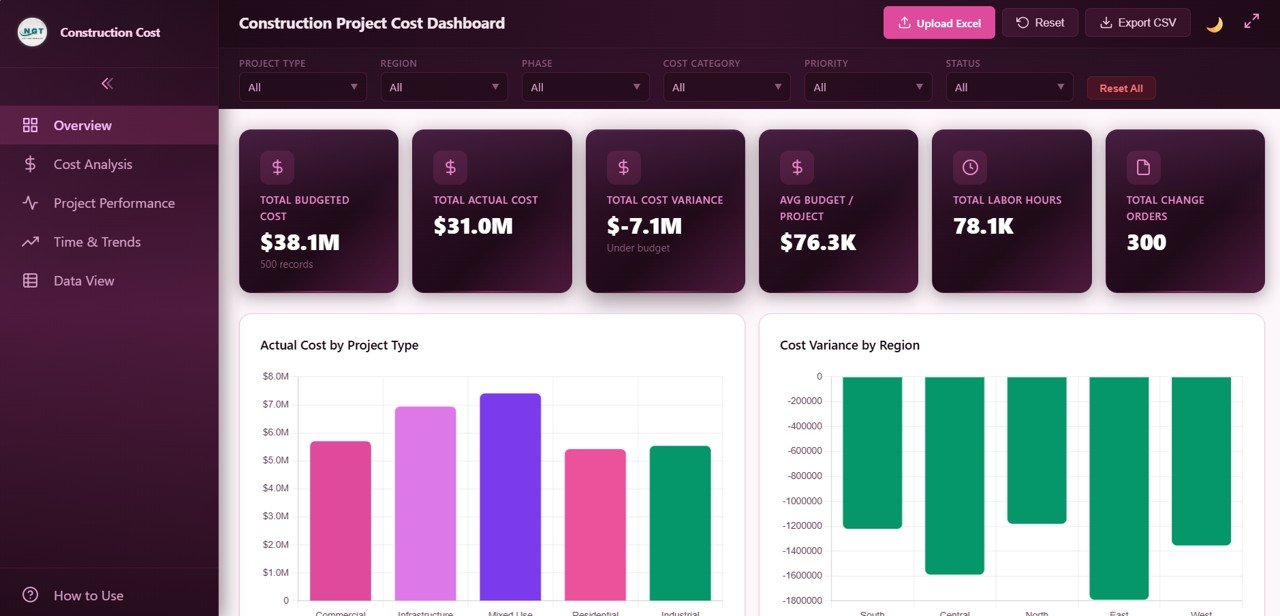
The Overview page serves as your command center for construction cost monitoring. At the top, 6 KPI cards display Total Budgeted Cost, Total Actual Cost, Total Cost Variance, Avg Budget per Project, Total Labor Hours, and Total Change Orders for an instant executive summary of project financial health.
Below the KPI cards, interactive charts present Actual Cost by Project Type showing how expenses distribute across construction categories, Cost Variance by Region highlighting where overruns or savings occur geographically, Budget vs Actual by Phase comparing planned versus actual spending across construction stages, Status Distribution revealing active, completed, and delayed project counts, and Top 10 Projects by Actual Cost identifying the highest-spending projects. Multiple slicers let you filter the entire dashboard instantly by any dimension.
Construction Project Cost Dashboard Overview2. Cost Analysis Page
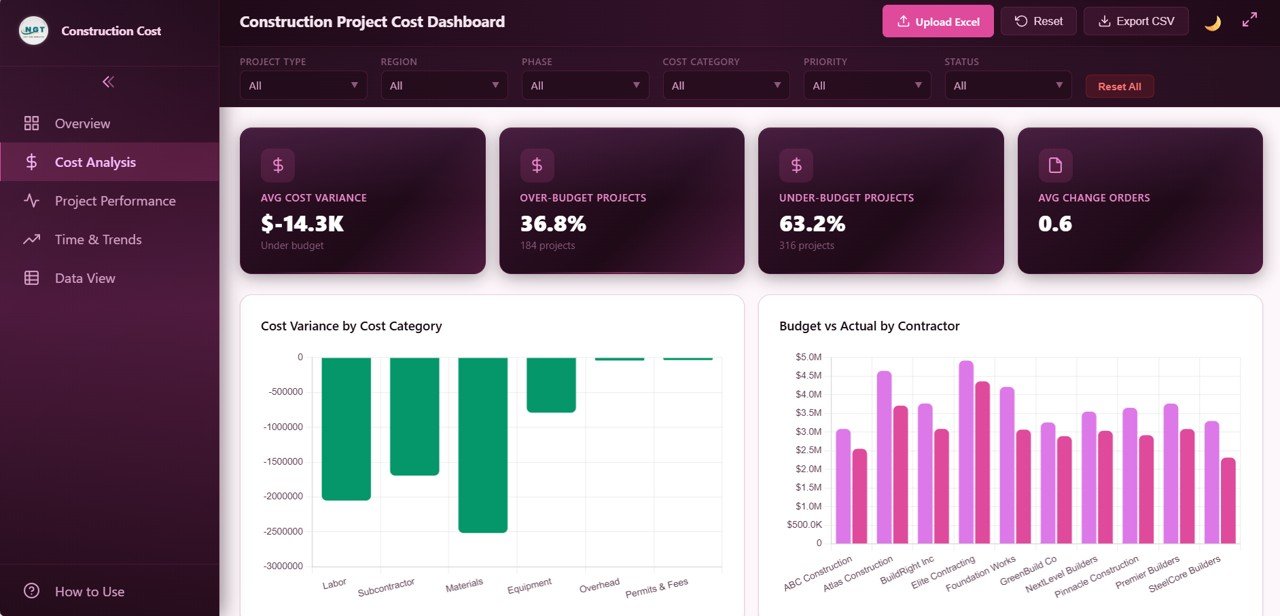
The Cost Analysis page provides deep financial insights into construction spending patterns. This page includes Cost Variance by Cost Category revealing where budget overruns or savings occur across material, labor, equipment, and other categories so you can pinpoint exactly which cost areas need attention.
Budget vs Actual by Contractor compares planned versus actual spending by contractor, helping you evaluate contractor financial performance. Cost Category Distribution shows the percentage breakdown of total costs across all categories. Monthly Cumulative Cost tracks how total project expenditure accumulates over time, giving you a clear picture of spending velocity and burn rate.
 Cost Analysis Page
3. Project Performance Page
The Project Performance page monitors project execution effectiveness across multiple dimensions. Status by Project Type compares on-time delivery rates across different construction categories such as residential, commercial, and industrial projects.
Labor Hours by Phase tracks workforce utilization across construction stages including planning, foundation, structure, and finishing phases. Priority Distribution reveals how projects are distributed by urgency level. Projects by Project Manager shows individual manager workload and performance, helping organizations balance assignments and identify coaching opportunities.
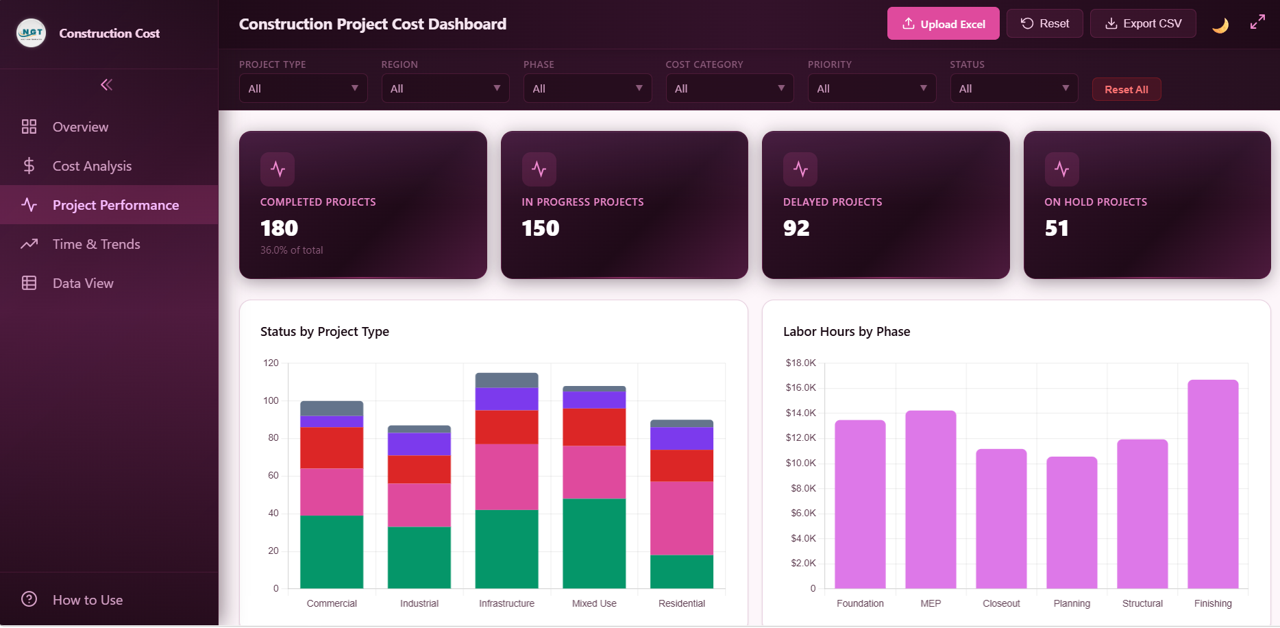 Project Performance Page
4. Time and Trends Page
The Time and Trends page reveals time-based financial and operational patterns. Monthly Actual Cost Trend provides month-over-month expenditure tracking so you can spot spending spikes or slowdowns quickly.
Monthly Cost Variance Trend monitors budget compliance over time, showing whether projects are trending toward overruns or staying within budget. Projects by Month shows how new project launches are distributed across the calendar. Yearly Comparison 2024 vs 2025 enables year-over-year cost analysis to evaluate whether your cost management is improving over time.
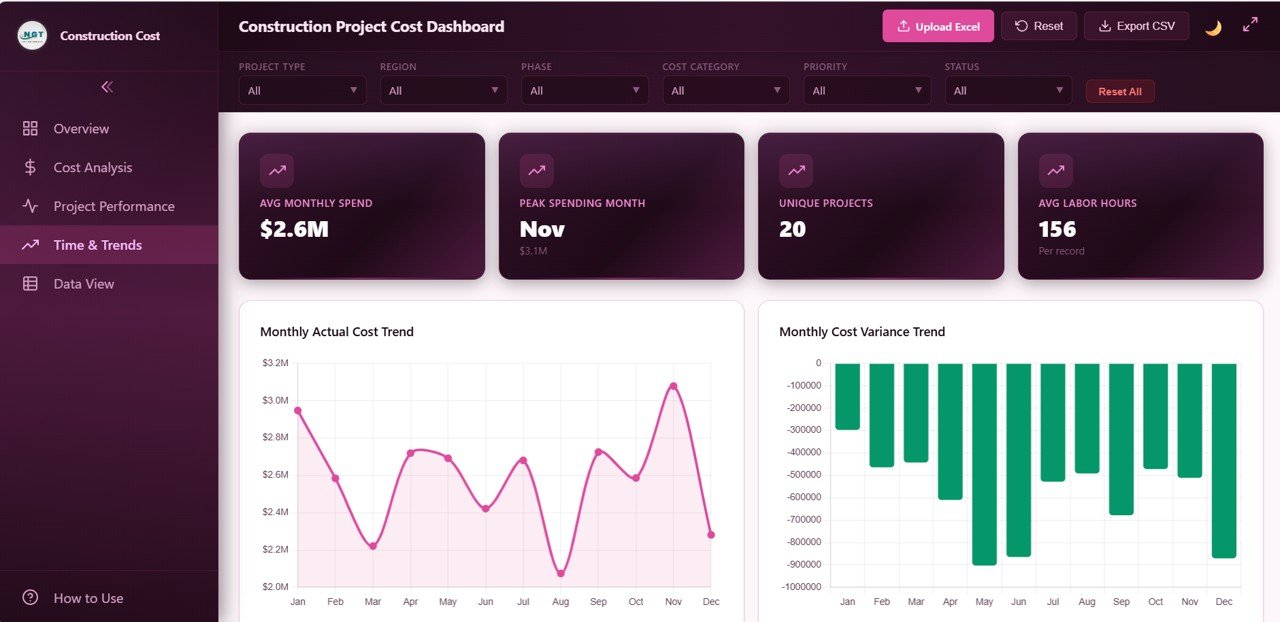 Time and Trends Page
5. Data View Page
The Data View page is a detailed data table showing all construction project cost records with powerful search, sort, and pagination features. You can quickly find specific projects, sort by any column, and navigate through large datasets easily. The page also includes CSV export functionality so you can download filtered data for further offline analysis, reporting, or sharing with stakeholders.
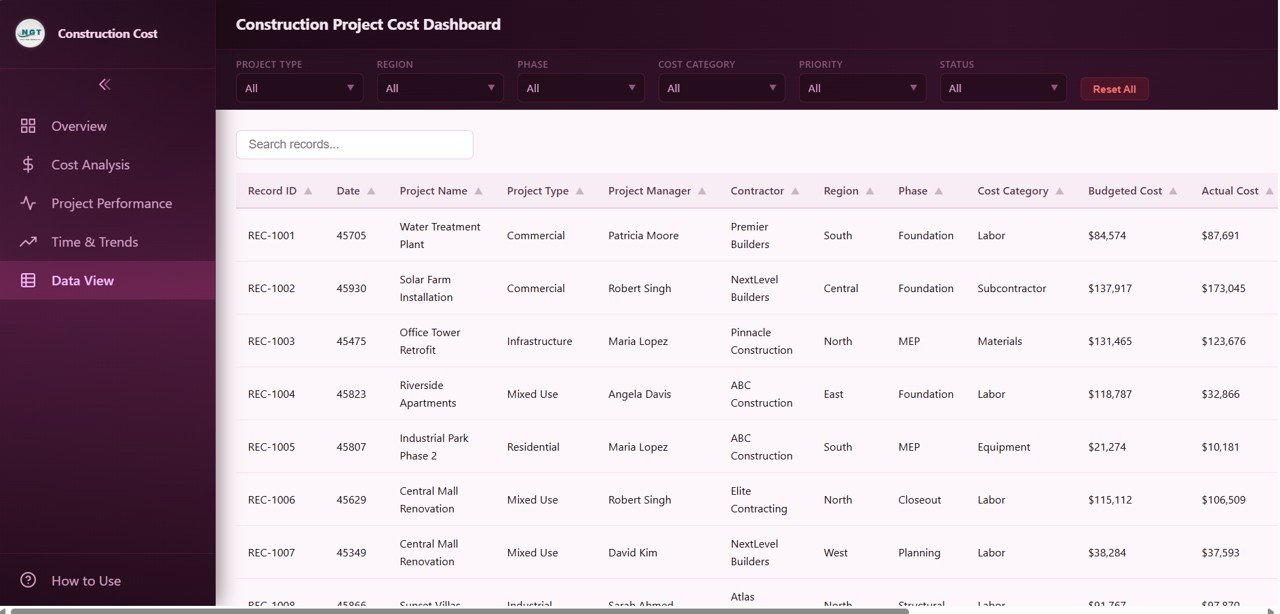 Data View Tab
Advantages of Construction Project Cost Dashboard in HTML
The biggest advantage of this HTML dashboard is that it requires absolutely no software installation. Unlike Excel or Power BI dashboards, you simply open a file in your browser and start analyzing data immediately. This makes it perfect for teams that need quick access without IT dependencies.
The dashboard consolidates 6 critical KPIs and 15+ charts across 5 pages into one unified view, eliminating the need to maintain multiple spreadsheets. Interactive slicers enable real-time filtering across all charts simultaneously, which dramatically speeds up analysis. The CSV export from the Data View page ensures compatibility with any downstream reporting tool.
Opportunities for Improvement
While the dashboard covers comprehensive cost analytics, organizations with very large datasets (10,000+ records) may experience slower performance in the browser. For such cases, the Excel version with pivot tables may handle larger data volumes more efficiently. Additionally, users who need real-time database connectivity may want to consider the Power BI alternative for direct SQL or cloud data source integration.
Best Practices for Using This Dashboard
Update your data file regularly — weekly or bi-weekly — to maintain accurate KPI tracking. Use the slicers strategically by combining multiple filters (for example, filtering by both Region and Phase simultaneously) to uncover hidden cost patterns. Review the Cost Variance by Region and Cost Category charts in your monthly project review meetings to proactively address budget overruns before they escalate.
Export data from the Data View page before each project milestone review to maintain a historical record of cost performance. Share the HTML dashboard file with stakeholders via email or your company intranet — they can open it in any browser without needing special software.
Explore Relevant Templates
If you are looking for more construction and project management analytics solutions, explore these related templates from NextGenTemplates:
- Construction Project Cost Dashboard in Excel — The same cost analytics powered by Excel pivot tables for users who prefer working within Microsoft Excel.
- Construction Dashboard in HTML — A broader construction project dashboard covering progress, budget, safety, and data view in your browser.
- Construction Project Timeline Calendar in Excel — Plan and track construction project timelines with annual, monthly, and daily calendar views.
- Infrastructure KPI Scorecard in Google Sheets — Monitor infrastructure performance KPIs with automated traffic-light indicators and trend analysis.
Frequently Asked Questions
What KPIs does the Construction Project Cost Dashboard in HTML track?
The Construction Project Cost Dashboard in HTML tracks 6 key performance indicators: Total Budgeted Cost, Total Actual Cost, Total Cost Variance, Avg Budget per Project, Total Labor Hours, and Total Change Orders. These are displayed as interactive cards on the Overview page and are supported by 15+ dynamic charts across 5 dashboard pages.
Do I need any coding or technical skills to use this HTML dashboard?
No. Simply unzip the downloaded file and open index.html in any modern web browser such as Google Chrome, Mozilla Firefox, or Microsoft Edge. Replace the sample data with your own construction project records and the dashboard updates automatically. No programming skills are needed.
What is the best HTML dashboard template for tracking construction project costs?
The Construction Project Cost Dashboard in HTML by NextGenTemplates is one of the best options available. It includes 5 interactive pages covering cost overview, detailed cost analysis, project performance, time-based trends, and a full data table with CSV export — all running directly in your browser without any software installation.
Can I filter the dashboard by contractor, region, or project phase?
Yes. The dashboard includes multiple interactive slicers that let you filter all charts and KPIs by Project Type, Region, Phase, Status, Cost Category, Contractor, and Project Manager. Every chart updates instantly when you apply filters.
How does the HTML version compare to the Excel version?
Both versions track similar construction cost metrics. The HTML version opens in any browser with no software installation and supports CSV export from the Data View page. The Excel version uses pivot tables and slicers for dynamic analysis within Microsoft Excel. Choose HTML for quick browser-based access and sharing, or Excel for advanced pivot table analysis.
Can I export data from this dashboard?
Yes. The Data View page includes a full data table with search, sort, and pagination features. You can export the filtered data to CSV for further analysis in Excel or other tools.
Conclusion
The Construction Project Cost Dashboard in HTML is an essential tool for any construction professional who needs clear, actionable visibility into project costs, budgets, variances, and performance trends. With 5 interactive pages, 6 KPI cards, 15+ dynamic charts, and powerful filtering capabilities, this browser-based dashboard eliminates the complexity of manual reporting and puts critical financial data at your fingertips.
Click here to Purchase Construction Project Cost Dashboard in HTML
Visit our YouTube channel for step-by-step video tutorials: Youtube.com/@NeoTechNavigators