Creating professional reports quickly and efficiently is a crucial skill in the modern workplace. Whether you’re working with data from marketing, sales, HR, or any other department, knowing how to craft a professional report in under 5 minutes can save you a lot of time and energy. Google Sheets is an excellent tool for this purpose. It’s free, accessible, and offers a wide range of features to turn raw data into clear, actionable insights.
In this article, we will guide you step-by-step on how to create a professional report in Google Sheets in less than five minutes. We will explore various tips, shortcuts, and tools available within Google Sheets that can help you create visually appealing and functional reports. Let’s get started!
Why Use Professional Report in Google Sheets Creation?
Before diving into the specifics of creating a report, it’s important to understand why Google Sheets is a powerful tool for this purpose.
- Free & Accessible: Google Sheets is available to anyone with a Google account, making it an ideal tool for both individuals and teams.
- Cloud-Based: It allows you to access your reports anywhere, on any device, making it perfect for remote work or collaborations.
- Real-Time Collaboration: Multiple team members can collaborate on the same document at the same time, providing a seamless working experience.
- Customizable Templates: Google Sheets offers a variety of templates that can be easily customized to suit your reporting needs.
Now that we know why Google Sheets is a great choice, let’s explore how to create a professional report in under five minutes.
Step 1: Gather and Organize Your Data
The first and most critical step is to gather and organize your data. Without clean, well-organized data, even the best report design will be ineffective.
Tip: Clean Your Data Before You Start
Ensure that your data is free from errors and inconsistencies. Remove unnecessary spaces, check for duplicate entries, and make sure all your columns are correctly labeled.
Action Steps:
Import Your Data: If your data is in an external file (such as CSV, Excel, or another Google Sheet), you can import it directly into Google Sheets. To do this:
- Go to File > Import and select your file.
- Choose whether to import it into the current sheet or a new sheet.
Use the Data Cleanup Tools: Google Sheets has built-in tools that help you clean up your data:
- Remove Duplicates: Go to Data > Data cleanup > Remove duplicates to eliminate any duplicate entries.
- Trim Whitespace: Go to Data > Data cleanup > Trim whitespace to remove any extra spaces.
Once your data is clean, the next task is to organize it effectively.
Organize Your Data with Clear Headers and Categories
- Create Headers: Label each column with descriptive headers, so the information is clear and easy to understand.
- Group Related Data: For instance, if you’re reporting on sales, group the columns by categories such as “Product Name,” “Quantity Sold,” “Revenue,” and “Date.”
- Use Filters: Utilize the filter function in Google Sheets to quickly sort and view specific data. Go to Data > Create a filter to enable the filter for your data.
Once you have your data in order, you are ready to move to the next step.
Step 2: Choose a Template (or Start from Scratch)
Google Sheets offers a wide range of templates that are ideal for professional reports. These templates come with pre-designed charts, tables, and styles that you can quickly customize to suit your needs.
However, if you prefer to create a report from scratch, that’s perfectly fine as well. Google Sheets gives you all the tools necessary to design a report exactly the way you want it.
Templates for Quick Report Creation
- Financial Reports Template: Great for reporting on financial data, such as income statements, balance sheets, and more.
- Project Management Report: Ideal for summarizing project timelines, tasks, and milestones.
- Sales Dashboard: A template specifically designed for visualizing sales performance, product metrics, and other key performance indicators (KPIs).
How to Use a Template:
- Go to File > New > From template.
- Browse through the available templates and select one that best fits your report type.
- Customize the template by replacing the placeholder data with your own information.
If you’re starting from scratch, you can easily create a clean, professional layout by setting up your columns and rows appropriately.
![]()
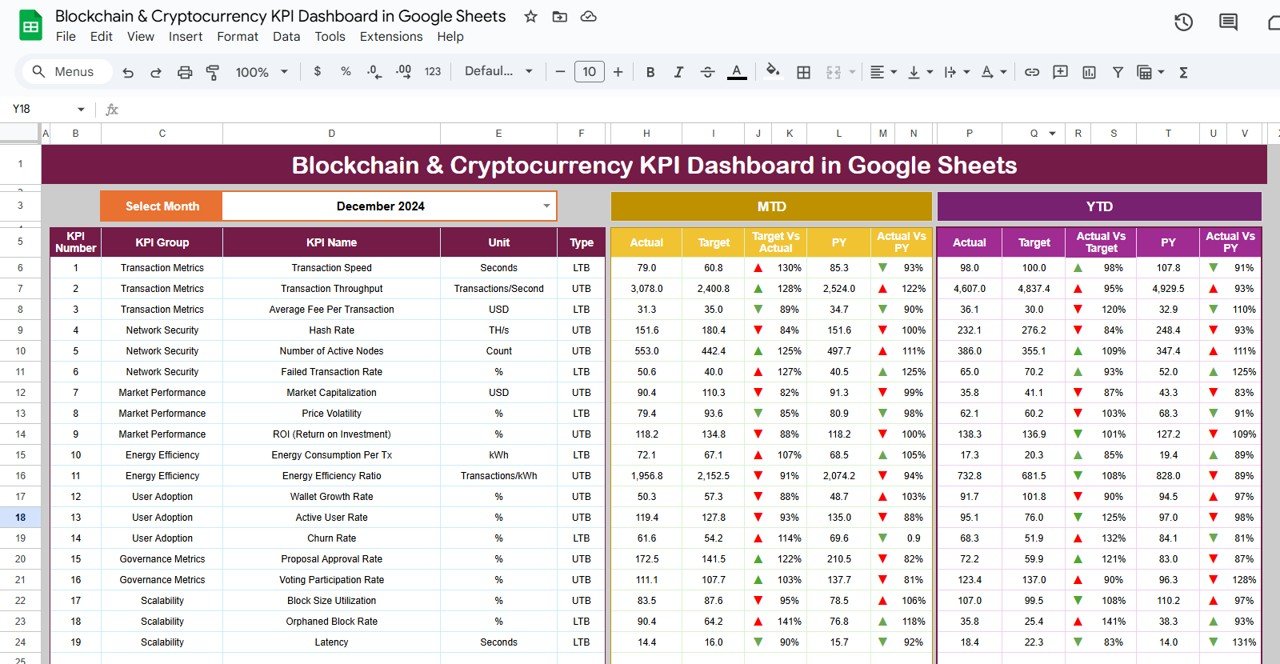
Step 3: Add Visual Elements to Enhance Clarity
One of the best ways to make your report stand out is by adding visual elements like charts and graphs. Visuals can make your report easier to read and more engaging.
Common Visual Elements for Professional Reports
- Bar and Column Charts: Ideal for showing comparisons across categories.
- Line Charts: Best for showing trends over time, such as revenue growth or sales performance.
- Pie Charts: Great for showing proportions or percentages of a whole.
- Pivot Tables: If you have complex data, pivot tables allow you to summarize and organize it more effectively.
How to Add a Chart or Graph
- Select the data you want to visualize.
- Go to Insert > Chart.
- In the Chart Editor, choose the chart type that best fits your data (bar, line, pie, etc.).
- Customize the chart style, colors, and labels to match the overall design of your report.
By using these visual elements, your report will be much more insightful and professional.
![]()
Step 4: Format the Report for Professional Presentation
Once your data is organized and your visuals are added, the next step is to focus on the formatting to ensure that your report looks polished and professional.
Formatting Tips:
- Use Bold and Italics: To highlight important headers or data points, use bold for titles and italics for emphasis.
- Adjust Column Widths: Ensure that your columns are wide enough to accommodate your data without cutting off text.
- Use Cell Borders: Add borders around your cells to make your report look structured and organized. Go to Format > Borders and choose the border style you prefer.
- Text Alignment: Align text to the left for labels and to the right for numerical data. This makes your report more visually appealing and easier to read.
- Conditional Formatting: Highlight key values or trends using conditional formatting. For example, use color scales to highlight the highest and lowest values. Go to Format > Conditional formatting to apply this.
Helpful Shortcuts for Faster Formatting:
- Press Ctrl + A (Windows) or Cmd + A (Mac) to select all the data and format it at once.
- Use Ctrl + Shift + L (Windows) or Cmd + Shift + L (Mac) to add or remove filters quickly.
Step 5: Automate with Formulas for Real-Time Updates
Adding formulas to your report can automate calculations, ensuring your report is always up-to-date. You can easily calculate totals, averages, and even more complex operations.
Common Formulas for Reports:
- SUM(): Adds up a range of numbers.
- AVERAGE(): Calculates the average of a set of numbers.
- IF(): Performs a conditional calculation.
- VLOOKUP(): Searches for a value in a range and returns a related value.
- COUNTIF(): Counts the number of cells that meet a certain condition.
For example, if you’re working with a sales report, you can automatically calculate the total revenue by using the formula=SUM(B2:B10) where the range contains your revenue data.
Benefit of Using Formulas:
Formulas save time and effort, ensuring your data is always accurate and updated in real-time.
Step 6: Review, Finalize, and Share
Now that you’ve created your report, it’s time for a quick review to ensure everything looks great.
Quick Review Checklist:
- Double-Check Data Accuracy: Make sure all the data in your report is correct and up-to-date.
- Check Formatting: Ensure the font is consistent, headings are bold, and the layout is clear.
- Visual Appeal: Verify that the charts and graphs are easy to understand and match the report’s color scheme.
Once you’ve reviewed the report, you can easily share it with your colleagues or clients.
How to Share:
- Share via Google Drive: Click the Share button in the top-right corner and enter the email addresses of your collaborators.
- Download as PDF: Go to File > Download > PDF document if you need a more formal presentation of the report.
Conclusion
Creating a professional report in Google Sheets in under 5 minutes is entirely achievable. By gathering and organizing your data, using templates, adding visual elements, formatting for professionalism, and automating calculations with formulas, you can create clear, engaging, and actionable reports in no time.
Visit our YouTube channel to learn step-by-step video tutorials
Youtube.com/@NeotechNavigators