In the fast-paced world of customer service, measuring performance is essential for continuous improvement. To track and monitor the effectiveness of your customer service team, having a clear and well-organized KPI (Key Performance Indicator) Dashboard can make all the difference. This article will provide a comprehensive guide on how to create a Customer Service KPI Dashboard in Google Sheets, highlighting the key features, KPIs, and their definitions, along with how to use the dashboard effectively to improve your team’s performance.
What is a Customer Service KPI Dashboard?
A Customer Service KPI Dashboard is a tool that displays key performance indicators (KPIs) to assess the efficiency, productivity, and quality of customer service operations. It provides data-driven insights into how well a customer service team is performing, allowing managers to make informed decisions. This dashboard enables teams to focus on areas requiring attention while celebrating their strengths.
Key Features of the Customer Service KPI Dashboard
Click to buy Customer Service KPI Dashboard in Google Sheets
This ready-to-use Customer Service KPI Dashboard template in Google Sheets is designed to help you track and analyze your team’s performance. The dashboard includes the following key features:
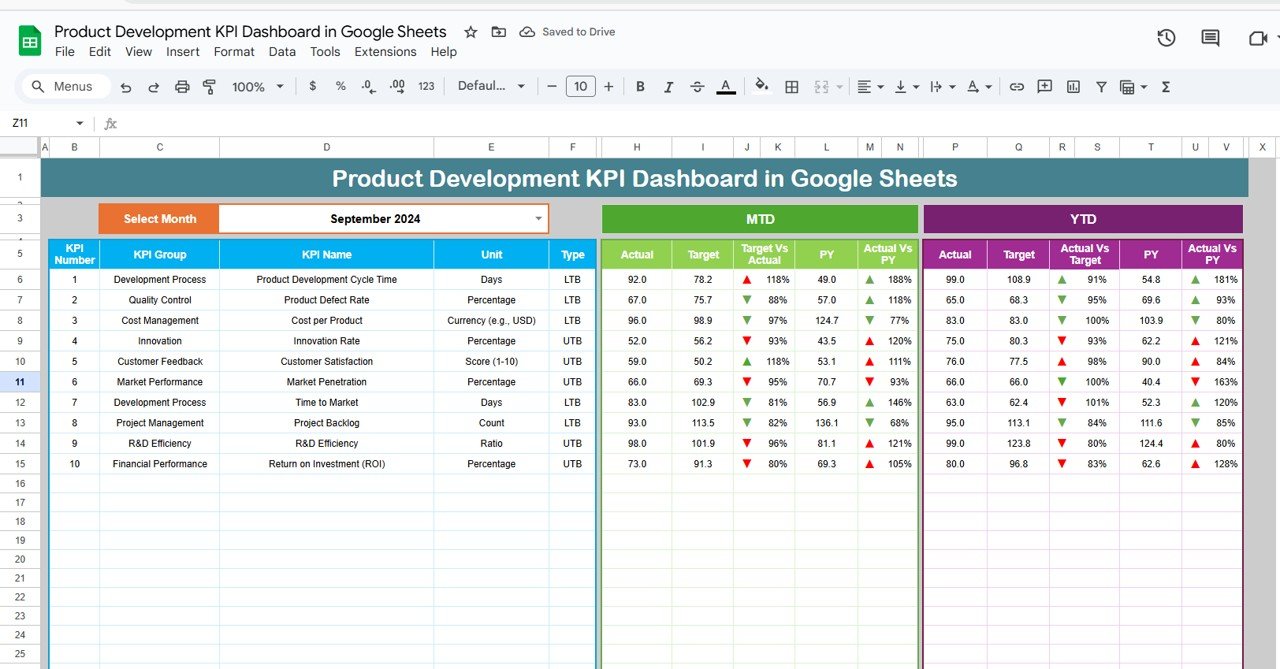
Dashboard Sheet Tab:
- This main sheet presents all KPIs in a clear and concise format.
- Use the drop-down in Cell D3 to select the month, and the data will update accordingly.
- The dashboard displays MTD (Month-to-Date) Actual, Target, and Previous Year data, with Target vs. Actual and PY (Previous Year) vs. Actual comparisons. Conditional formatting highlights performance with arrows showing whether performance has increased or decreased.

Click to buy Customer Service KPI Dashboard in Google Sheets
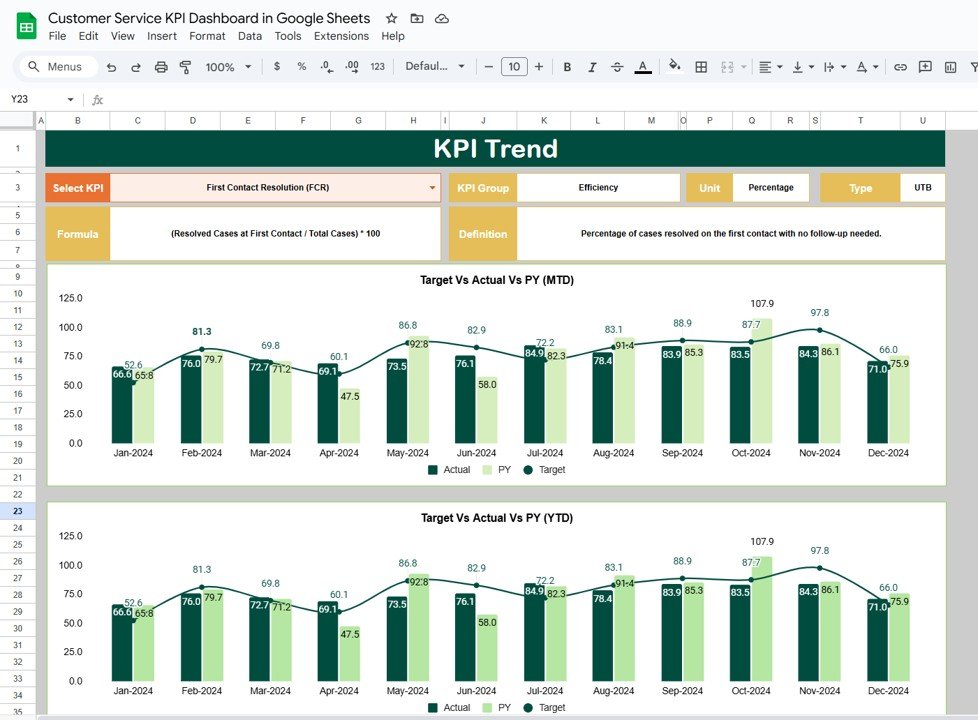
KPI Trend Sheet Tab:
- Allows you to select a specific KPI from the drop-down in Cell C3.
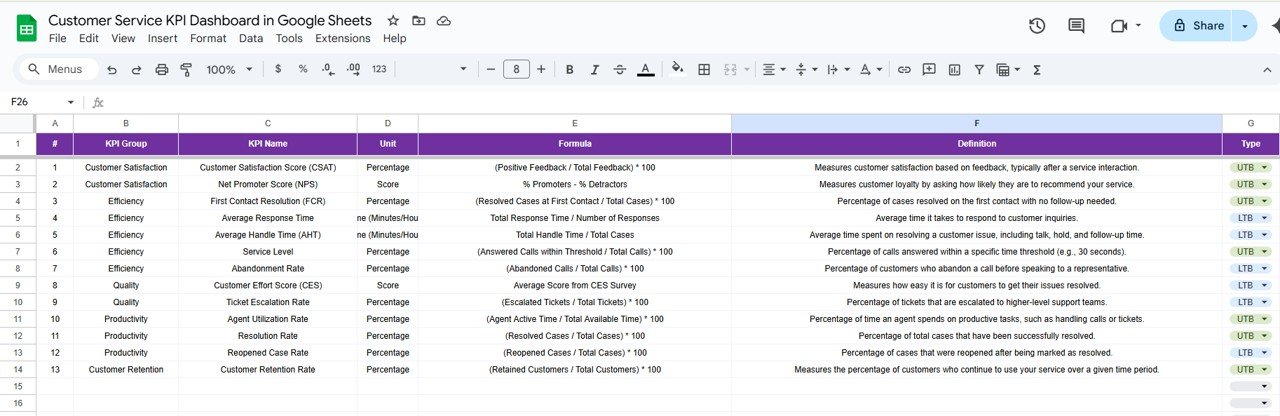
- The sheet provides the KPI Group, Unit, Type of KPI (whether “Lower is Better” or “Upper is Better”), Formula, and Definition for each KPI.
Click to buy Customer Service KPI Dashboard in Google Sheets
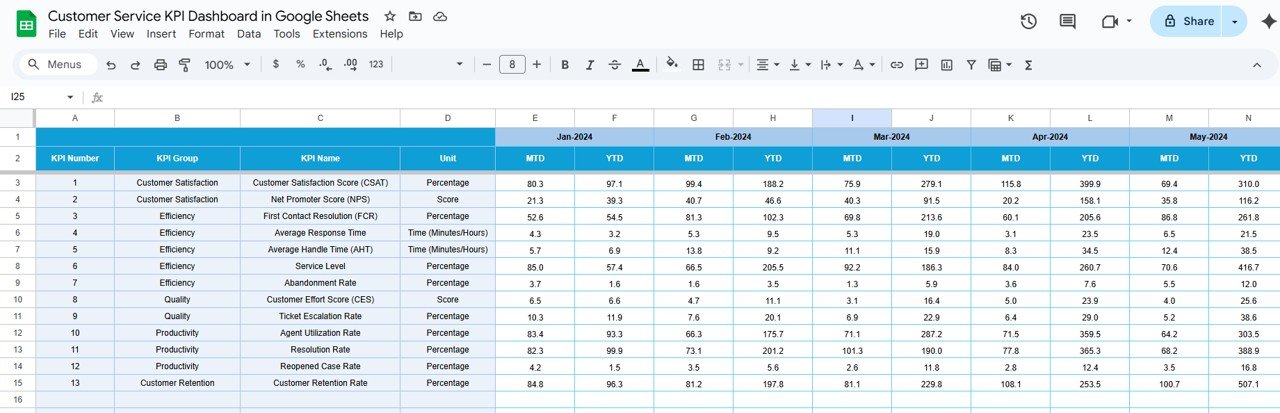
Actual Numbers Sheet Tab:
- Here, you input actual numbers for YTD and MTD for each month.
- You can easily change the month from Cell E1 and update the data accordingly.

Target Sheet Tab:
- This tab allows you to enter the target numbers for each KPI, both for MTD and YTD.
Click to buy Customer Service KPI Dashboard in Google Sheets
Previous Year Numbers Sheet Tab:
- Enter the data from the previous year in this tab to compare your performance against historical data.

Click to buy Customer Service KPI Dashboard in Google Sheets
KPI Definition Sheet Tab:
- This sheet is where you define each KPI, its group, unit, formula, and full definition.
KPIs for Customer Service
In this section, we will cover the essential KPIs for a customer service team and explain their unit of measurement, formulas, and whether they require improvement (i.e., lower is better or upper is better).
Advantages of Using a Customer Service KPI Dashboard:
-
-
Better Performance Tracking: The Customer Service KPI Dashboard allows managers to quickly assess how well the team is performing against established goals and benchmarks.
-
Data-Driven Decision Making: The dashboard provides clear, visual data to help managers make informed decisions based on actual performance metrics.
-
Improved Customer Experience: By tracking customer service KPIs like First Response Time and Customer Satisfaction, businesses can enhance the overall customer experience.
-
Goal Setting and Achievement: The dashboard helps set realistic targets and provides insights into whether the team is on track to achieve those goals, creating a culture of accountability.
-
Benchmarking: With historical data and comparisons with previous year metrics, businesses can track improvements and identify areas that require further attention.
Opportunities for Improvement in Customer Service KPI Dashboard:
Click to buy Customer Service KPI Dashboard in Google Sheets
While the Customer Service KPI Dashboard provides excellent insights into team performance, there are always opportunities for improvement:
-
Customization of KPIs: Customize the dashboard to include KPIs that are specifically relevant to your business. For instance, if your business operates in multiple regions, you may want to track regional customer satisfaction or response times.
-
Real-Time Data Integration: Integrating real-time data feeds can enhance the dashboard’s usefulness by providing up-to-the-minute performance insights.
-
Advanced Analytics: Incorporating advanced analytics tools like machine learning or predictive analytics can help forecast customer service trends, improving proactive decision-making.
-
Automated Alerts: Setting up automated alerts for when KPIs fall below targets can prompt timely action and prevent issues from escalating.
Best Practices for Managing Your Customer Service KPI Dashboard:
-
Regularly Update Data: Ensure that the data input into the dashboard is updated regularly to provide an accurate picture of performance.
-
Set Clear KPIs: Only track KPIs that align with your customer service goals and business objectives.
-
Ensure Accessibility: Make the dashboard accessible to key stakeholders, including team leaders and upper management, so they can take appropriate actions based on the data.
-
Focus on Actionable Metrics: Focus on KPIs that can lead to actionable insights. For example, First Contact Resolution and Customer Satisfaction are directly tied to improving customer service quality.
-
Review and Adjust Targets Periodically: Regularly review the KPIs and targets to ensure they align with changing business priorities and external factors, such as market shifts or customer behavior.
Conclusion:
Click to buy Customer Service KPI Dashboard in Google Sheets
A Customer Service KPI Dashboard is an essential tool for any organization that wants to improve its customer service operations. With this template, you can monitor performance, set achievable targets, and make data-driven decisions that enhance both customer and employee satisfaction. By using best practices and continuously improving your KPI tracking, your customer service team can become more efficient, effective, and aligned with overall business goals.
Frequently Asked Questions with Answers:
1. What is the purpose of a Customer Service KPI Dashboard? The purpose of a Customer Service KPI Dashboard is to provide a visual representation of key performance indicators to monitor and improve customer service operations.
2. How often should I update the Customer Service KPI Dashboard? It is important to update the dashboard regularly, at least once a month, to ensure that it reflects current performance levels and trends.
3. Can I customize the KPIs on the Customer Service KPI Dashboard? Yes, the dashboard can be customized to include KPIs that are specifically relevant to your business or industry.
4. What are the benefits of using KPIs in customer service? KPIs help businesses track performance, identify areas of improvement, and ensure that customer service teams are meeting business goals and providing excellent service.
5. How can I improve my Customer Service KPIs? Focus on training, improving response times, and gathering customer feedback to drive improvements in KPIs such as First Response Time and Customer Satisfaction.
6. How do I track employee performance in the Customer Service KPI Dashboard? Employee performance can be tracked using KPIs like Employee Satisfaction Score (ESAT) and First Contact Resolution that measure individual contributions to team goals.
Visit our YouTube channel to learn step-by-step video tutorials
Youtube.com/@NeotechNavigators
Click to buy Customer Service KPI Dashboard in Google Sheets