In the competitive world of food packaging, tracking performance is no longer optional—it’s a necessity. Businesses must monitor critical metrics to ensure efficiency, maintain quality, and optimize costs. That’s where the Food Packaging KPI Dashboard in Google Sheets comes into play. This powerful tool allows packaging managers, operations teams, and quality assurance professionals to gain valuable insights into key performance indicators (KPIs) using a simple, yet dynamic spreadsheet.
In this comprehensive article, we will explore everything you need to know about the Food Packaging KPI Dashboard, including its structure, features, advantages, best practices, and FAQs.Food Packaging KPI Dashboard in Google Sheets
What Is the Food Packaging KPI Dashboard in Google Sheets?
The Food Packaging KPI Dashboard in Google Sheets is a pre-designed spreadsheet template that helps food packaging businesses measure and visualize their operational performance across key indicators. It includes everything from data entry sheets to automated dashboards, offering a one-stop solution to analyze monthly trends, set targets, and compare historical data.Food Packaging KPI Dashboard in Google Sheets
Key Features of the Dashboard
This Google Sheets dashboard consists of 6 well-organized worksheet tabs, each serving a unique purpose. Let’s break them down:
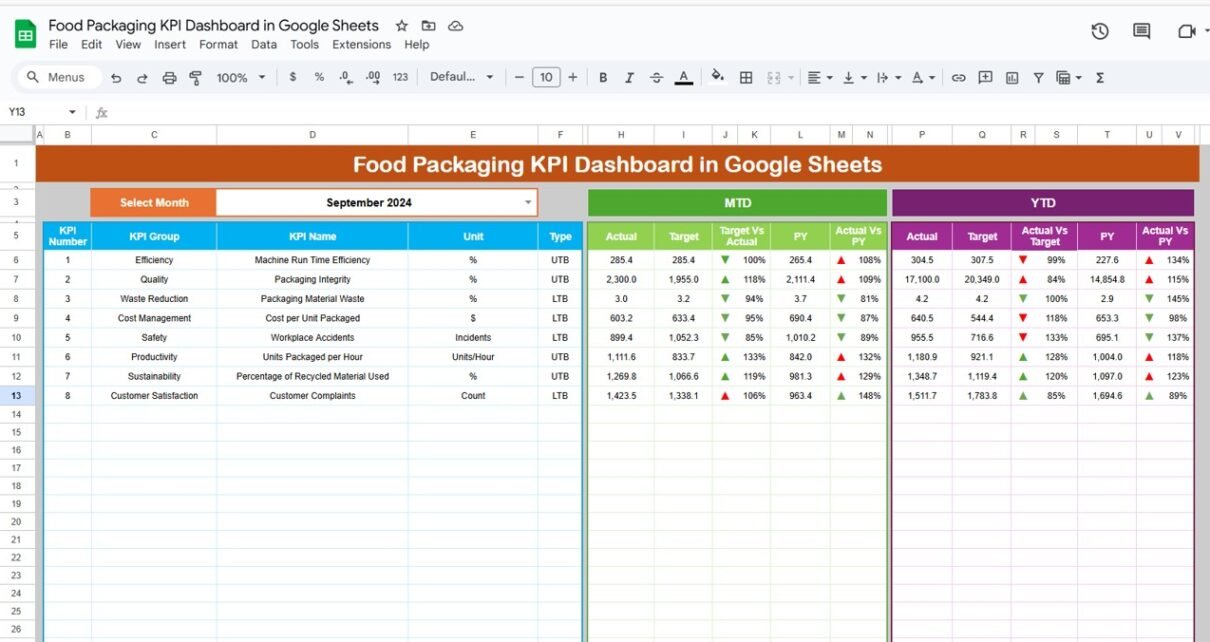
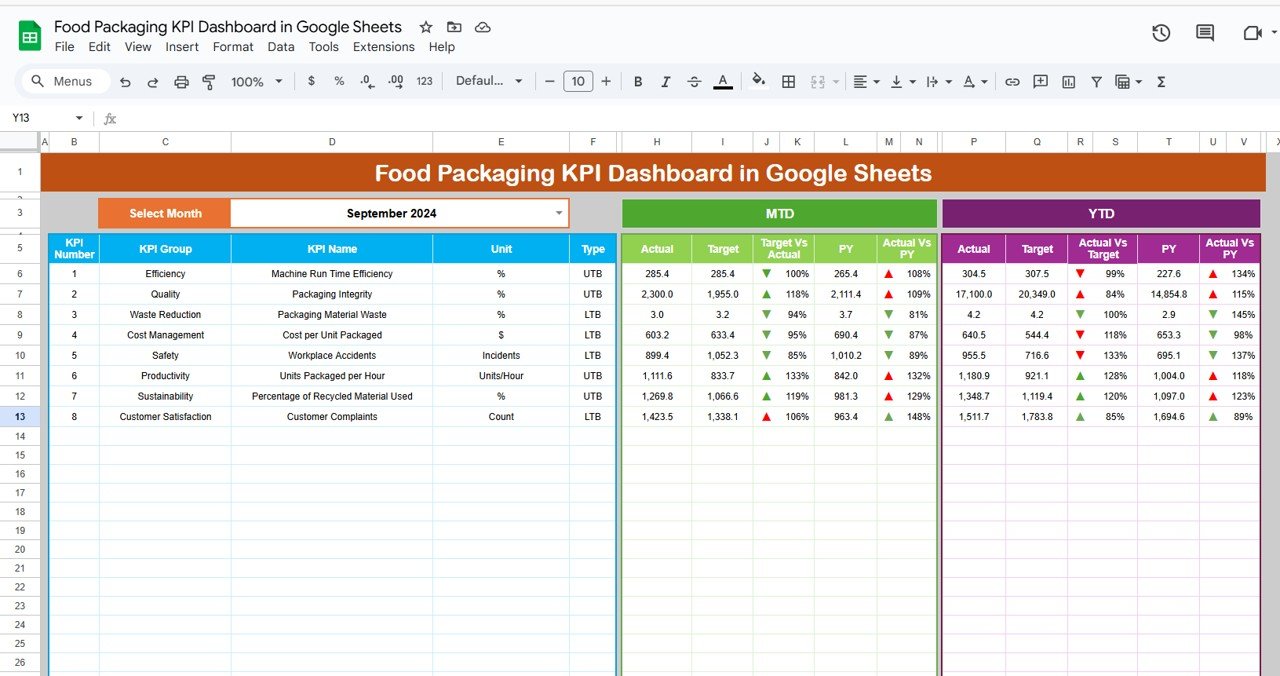
1. Dashboard Sheet Tab
-
Acts as the main visual representation of your KPIs.
-
Users can select any month from the dropdown in cell D3, and the entire dashboard will update accordingly.
- MTD (Month-to-Date): Actual vs. Target vs. Previous Year.
- YTD (Year-to-Date): Actual vs. Target vs. Previous Year.
-
Includes conditional formatting with up/down arrows for quick visual assessment.
-
Enables real-time decision-making based on actual performance trends.Food Packaging KPI Dashboard in Google Sheets
Click to buy Food Packaging KPI Dashboard in Google Sheets
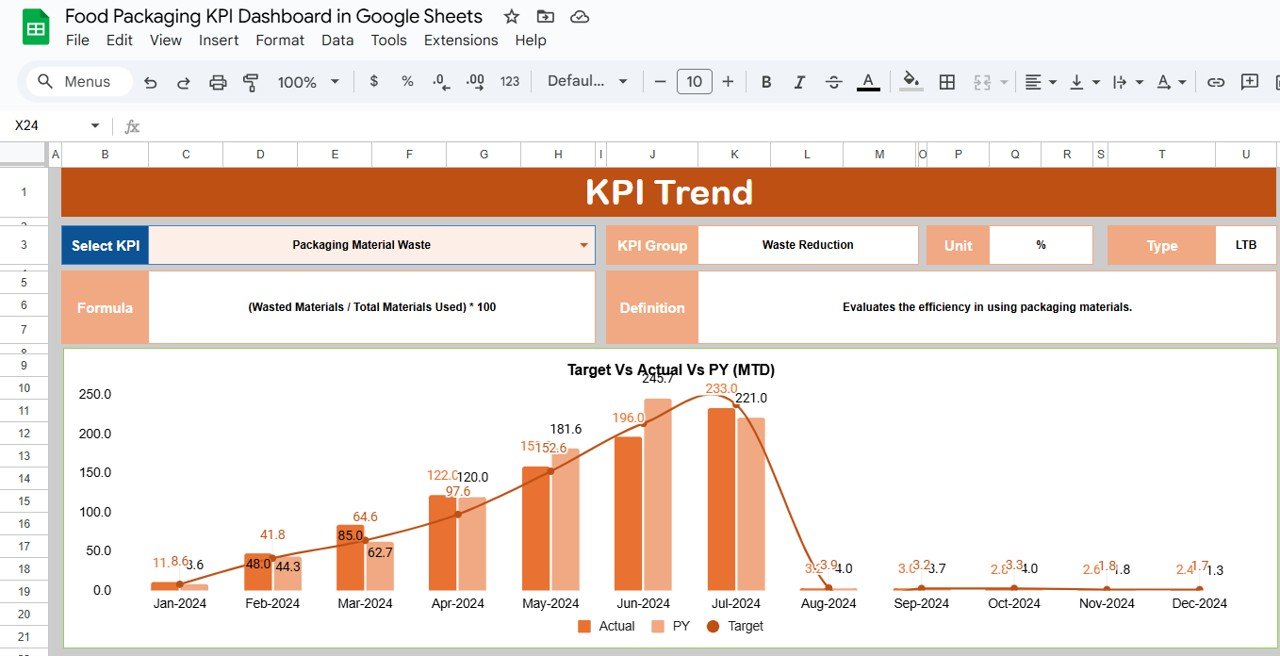
2. KPI Trend Sheet Tab
-
Allows users to select a KPI Name from a dropdown list in cell C3.KPI Group
-
Unit of Measurement
-
Type of KPI: Upper the Better (UTB) or Lower the Better (LTB)
-
KPI Formula
-
KPI Definition
-
-
Ideal for analyzing performance over time and understanding each KPI’s objective.
Click to buy Food Packaging KPI Dashboard in Google Sheets
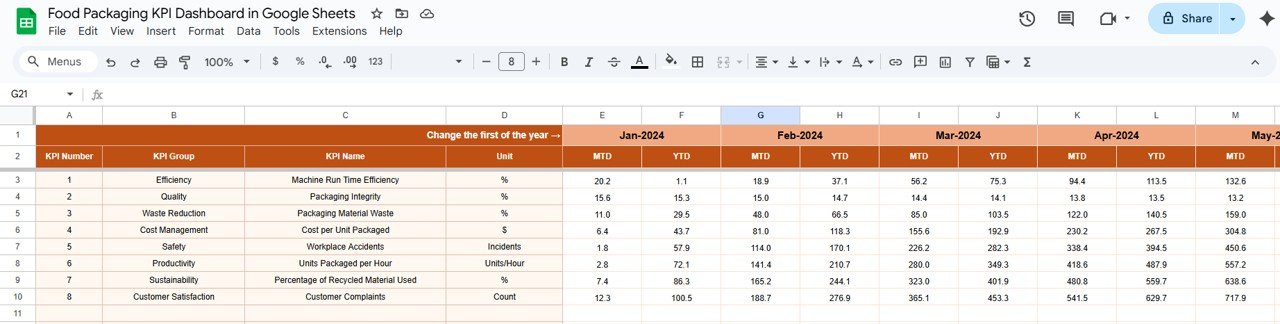
3. Actual Numbers Sheet Tab
-
Users can input MTD and YTD actual values for a specific month.
-
Simply change the month in cell E1 to align your inputs.
-
Ensures data consistency and centralized management of performance data.
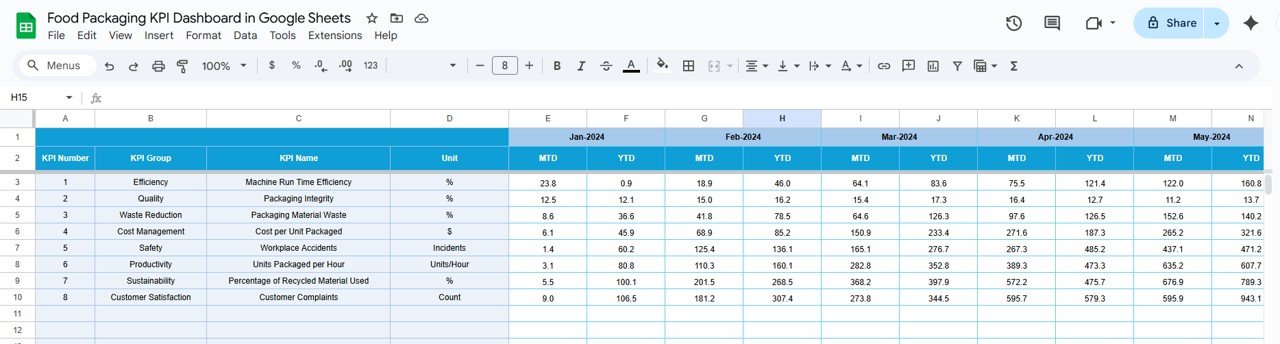
4. Target Sheet Tab
-
Here, businesses define their monthly performance targets for each KPI.
-
Captures both MTD and YTD target figures.
-
Helps in aligning goals across departments and setting realistic benchmarks.
Click to buy Food Packaging KPI Dashboard in Google Sheets
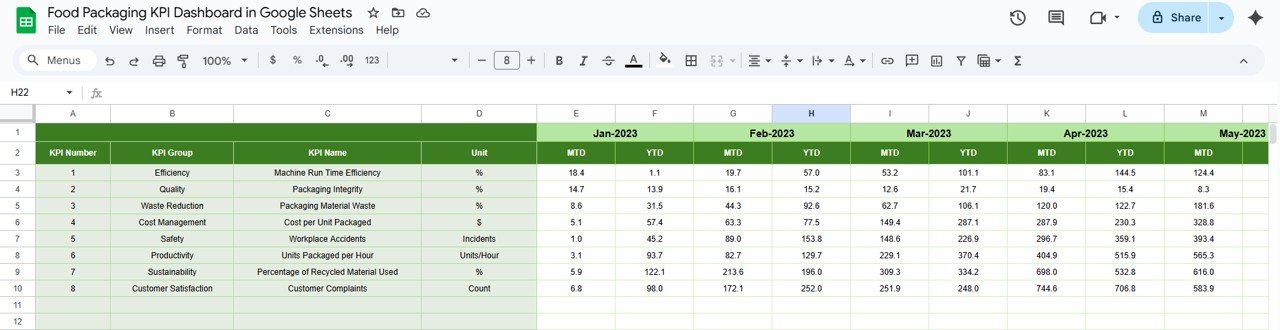
5. Previous Year Numbers Sheet Tab
-
Allows input of last year’s performance data for all KPIs.
-
Used for YOY (Year-over-Year) comparisons.
-
Supports trend analysis and performance improvement strategies.
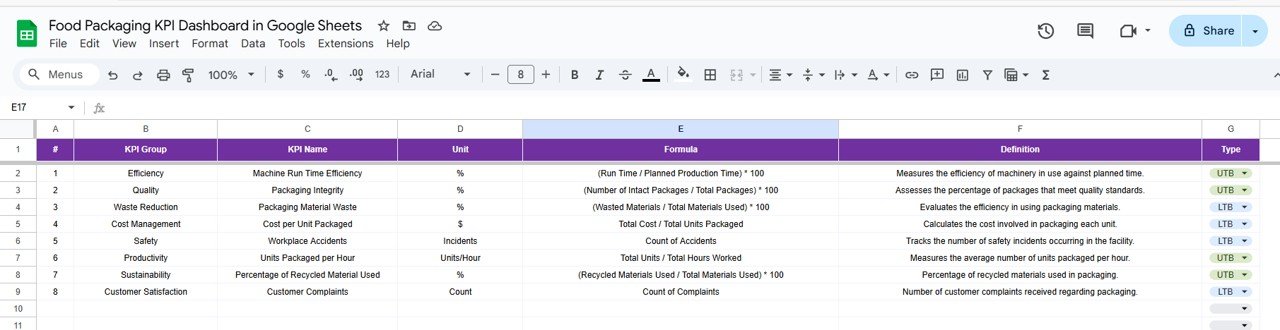
6. KPI Definition Sheet Tab
-
The foundation of your dashboard.
- KPI Name
- KPI Group
- Unit
- Formula
- Definition
- Type (UTB or LTB)
Ensures every team member understands what each KPI represents and how it’s calculated.
Click to buy Food Packaging KPI Dashboard in Google Sheets
Why Use a KPI Dashboard in Food Packaging?
Food packaging operations involve multiple variables—machine efficiency, packaging defects, cost per unit, and more. Tracking these manually can be chaotic. A dashboard in Google Sheets offers:
-
Accessibility across teams
-
Automation via formulas and conditional formatting
-
Visualization for better understanding
-
Historical comparisons for informed decisions
Advantages of the Food Packaging KPI Dashboard
Here are the top benefits of using this dashboard:
-
Dynamic Visualization: See your KPIs change instantly with just one dropdown.
-
Month-wise and Yearly Comparisons: Assess monthly and yearly trends side-by-side.
-
Better Decision-Making: Real-time insights enable informed decisions.
-
Customized for Food Packaging: Tailored KPIs ensure industry relevance.
-
Growth Tracking: Easily identify areas of improvement and success.
-
Editable & Scalable: Add new KPIs as your business evolves.
Best Practices for Using the Food Packaging KPI Dashboard
Follow these strategies to get the most out of your dashboard:
-
Set realistic targets for each KPI at the beginning of the year.
-
Update actual numbers monthly to maintain accuracy.
-
Review trends at least quarterly to track performance patterns.
-
Educate your team on each KPI’s definition and importance.
-
Use conditional formatting (arrows, color codes) for quick alerts.
-
Regularly review the KPI definition sheet to avoid confusion.
How to Customize the Dashboard for Your Business?
Customizing the dashboard in Google Sheets is simple and flexible:
-
Add or remove KPIs from the KPI Definition tab.
-
Modify formulas based on your unique workflow.
-
Create new charts in the Dashboard tab using Google Sheets’ chart tools.
-
Link the dashboard to external databases or forms for automatic data feeding.
-
Collaborate with your team by sharing access via Google Drive.
Click to buy Food Packaging KPI Dashboard in Google Sheets
Frequently Asked Questions (FAQs)
1. Can I use this dashboard for other industries too?
Yes, you can. While designed for food packaging, you can easily customize the KPIs and labels for other manufacturing or logistics domains.
2. How often should I update the data?
You should update MTD and YTD figures at least once a month. Some high-volume businesses prefer weekly updates.
3. Is this dashboard suitable for small businesses?
Absolutely. It’s perfect for startups and small manufacturers looking to monitor performance without investing in complex software.
4. What if I don’t know how to write formulas?
The prebuilt template includes ready-made formulas. You can also view definitions in the KPI Definition tab to understand how each formula works.
5. Can I track custom KPIs like Carbon Emissions or Packaging Innovation Index?
Yes. Simply add a new row in the KPI Definition tab, define your formula, and update the other sheets accordingly.
6. How do I visualize trends in a chart?
Use the KPI Trend tab. Select your KPI from the dropdown, and it will show you trends over the months.
Conclusion
The Food Packaging KPI Dashboard in Google Sheets is a powerful, accessible, and customizable tool for any organization involved in packaging operations. With its structured approach, visual clarity, and flexibility, this dashboard empowers you to make smart decisions backed by real data.Food Packaging KPI Dashboard in Google Sheets
Visit our YouTube channel to learn step-by-step video tutorials